Estimated zip code population in 2022: 13,615 Zip code population in 2010: 13,976 Zip code population in 2000: 14,858
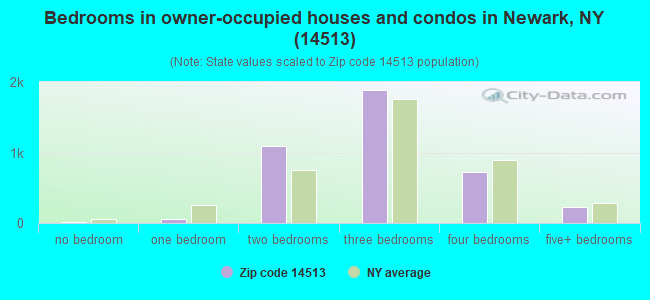
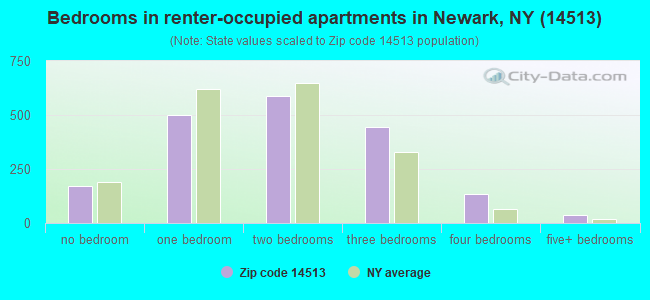
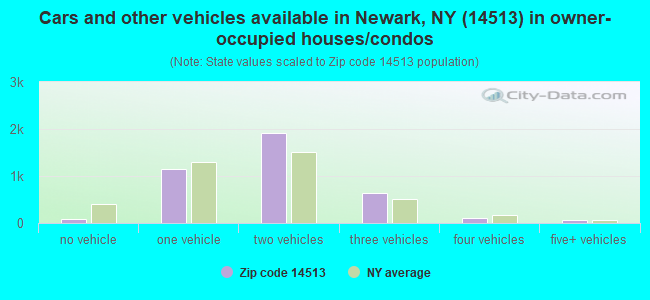
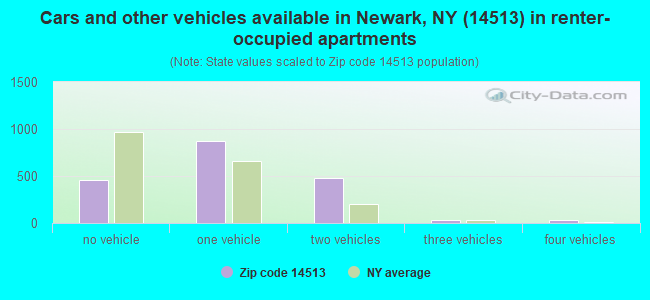
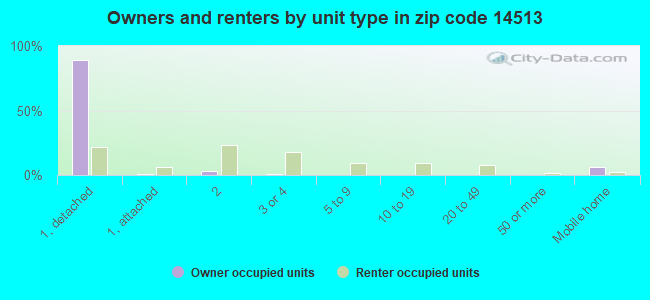
Houses and condos: 6,220 Renter-occupied apartments: 1,876
% of renters here:
32%
State:
46%
March 2022 cost of living index in zip code 14513: 101.6 (near average, U.S. average is 100)
Land area: 46.9 sq. mi. Water area: 0.2 sq. mi.
Population density: 290 people per square mile
(very low).
OSM Map
General Map
Google Map
MSN Map
OSM Map
General Map
Google Map
MSN Map
OSM Map
General Map
Google Map
MSN Map
OSM Map
General Map
Google Map
MSN Map
Please wait while loading the map...
Real estate property taxes paid for housing units in 2022:
This zip code:
2.7% ($3,498)
New York:
1.5% ($6,180)
Median real estate property taxes paid for housing units with mortgages in 2022: $3,611 (2.6%) Median real estate property taxes paid for housing units with no mortgage in 2022: $2,926 (2.6%)
Averages for the 2020 tax year for zip code 14513, filed in 2021:
Average Adjusted Gross Income (AGI) in 2020: $49,067 (Individual Income Tax Returns)
Here:
$49,067
State:
$90,930
Salary/wage: $42,124 (reported on 82.1% of returns)
Here:
$42,124
State:
$72,104
(% of AGI for various income ranges: 1246.1% for AGIs below $25k, 3604.7% for AGIs $25k-50k, 6218.2% for AGIs $50k-75k, 9165.7% for AGIs $75k-100k, 15391.4% for AGIs $100k-200k)
Taxable interest for individuals: $641 (reported on 34.0% of returns)
This zip code:
$641
New York:
$3,075
(% of AGI for various income ranges: 19.7% for AGIs below $25k, 18.8% for AGIs $25k-50k, 30.5% for AGIs $50k-75k, 67.6% for AGIs $75k-100k, 65.1% for AGIs $100k-200k)
Ordinary dividends: $3,418 (reported on 13.4% of returns)
Here:
$3,418
State:
$11,095
(% of AGI for various income ranges: 15.3% for AGIs below $25k, 25.6% for AGIs $25k-50k, 36.2% for AGIs $50k-75k, 60.8% for AGIs $75k-100k, 307.4% for AGIs $100k-200k)
Net capital gain/loss in AGI: +$8,813 (reported on 10.4% of returns)
Here:
+$8,813
State:
+$44,925
(% of AGI for various income ranges: 4.5% for AGIs below $25k, 13.2% for AGIs $25k-50k, 72.9% for AGIs $50k-75k, 161.6% for AGIs $75k-100k, 443.4% for AGIs $100k-200k)
Profit/loss from business: +$10,370 (reported on 8.7% of returns)
Here:
+$10,370
State:
+$14,940
(% of AGI for various income ranges: 43.0% for AGIs below $25k, 59.8% for AGIs $25k-50k, 90.8% for AGIs $50k-75k, 184.9% for AGIs $75k-100k, 813.1% for AGIs $100k-200k)
Taxable individual retirement arrangement distribution: $15,002 (reported on 9.8% of returns)
14513:
$15,002
New York:
$19,609
(% of AGI for various income ranges: 80.9% for AGIs below $25k, 100.1% for AGIs $25k-50k, 188.6% for AGIs $50k-75k, 386.2% for AGIs $75k-100k, 1073.7% for AGIs $100k-200k)
Total itemized deductions: $26,274 (reported on 2.9% of returns)
Here:
$26,274
State:
$39,326
(% of AGI for various income ranges: 30.8% for AGIs below $25k, 58.4% for AGIs $25k-50k, 163.9% for AGIs $50k-75k, 208.4% for AGIs $75k-100k, 422.0% for AGIs $100k-200k)
Charity contributions: $4,562 (reported on 2.0% of returns)
Here:
$4,562
State:
$15,420
(% of AGI for various income ranges: 6.6% for AGIs below $25k, 10.9% for AGIs $50k-75k, 34.1% for AGIs $75k-100k, 79.4% for AGIs $100k-200k)
Taxes paid: $7,100 (reported on 2.9% of returns)
14513:
$7,100
State:
$9,183
(% of AGI for various income ranges: 5.6% for AGIs below $25k, 10.8% for AGIs $25k-50k, 42.5% for AGIs $50k-75k, 74.9% for AGIs $75k-100k, 133.7% for AGIs $100k-200k)
Earned income credit: $2,286 (reported on 16.9% of returns)
Here:
$2,286
State:
$2,138
(% of AGI for various income ranges: 91.6% for AGIs below $25k, 66.8% for AGIs $25k-50k)
Percentage of individuals using paid preparers for their 2020 taxes: 95.1%
Here:
95%
State:
95%
(% for various income ranges: 94.0% for AGIs below $25k, 96.7% for AGIs $25k-50k, 94.4% for AGIs $50k-75k, 94.4% for AGIs $75k-100k, 94.8% for AGIs $100k-200k, 100.0% for AGIs over 200k)
Averages for the 2012 tax year for zip code 14513, filed in 2013:
Average Adjusted Gross Income (AGI) in 2012: $41,280 (Individual Income Tax Returns)
Here:
$41,280
State:
$77,088
Salary/wage: $36,041 (reported on 84.4% of returns)
Here:
$36,041
State:
$60,593
(% of AGI for various income ranges: 74.6% for AGIs below $25k, 80.6% for AGIs $25k-50k, 76.4% for AGIs $50k-75k, 74.2% for AGIs $75k-100k, 69.7% for AGIs $100k-200k, 45.7% for AGIs over 200k)
Taxable interest for individuals: $813 (reported on 37.4% of returns)
This zip code:
$813
New York:
$3,125
(% of AGI for various income ranges: 0.9% for AGIs below $25k, 0.5% for AGIs $25k-50k, 0.4% for AGIs $50k-75k, 0.4% for AGIs $75k-100k, 1.4% for AGIs $100k-200k, 1.4% for AGIs over 200k)
Ordinary dividends: $2,678 (reported on 17.0% of returns)
Here:
$2,678
State:
$10,299
(% of AGI for various income ranges: 1.1% for AGIs below $25k, 0.8% for AGIs $25k-50k, 0.7% for AGIs $50k-75k, 0.9% for AGIs $75k-100k, 1.5% for AGIs $100k-200k, 3.2% for AGIs over 200k)
Net capital gain/loss in AGI: +$3,549 (reported on 11.2% of returns)
Here:
+$3,549
State:
+$42,474
(% of AGI for various income ranges: 0.4% for AGIs $25k-50k, 0.6% for AGIs $50k-75k, 0.6% for AGIs $75k-100k, 1.3% for AGIs $100k-200k, 6.7% for AGIs over 200k)
Profit/loss from business: +$9,348 (reported on 10.0% of returns)
Here:
+$9,348
State:
+$16,168
(% of AGI for various income ranges: 3.7% for AGIs below $25k, 1.8% for AGIs $25k-50k, 1.9% for AGIs $50k-75k, 1.3% for AGIs $75k-100k, 3.8% for AGIs $100k-200k)
Taxable individual retirement arrangement distribution: $11,375 (reported on 11.5% of returns)
14513:
$11,375
New York:
$17,621
(% of AGI for various income ranges: 3.9% for AGIs below $25k, 2.7% for AGIs $25k-50k, 2.4% for AGIs $50k-75k, 4.3% for AGIs $75k-100k, 4.2% for AGIs $100k-200k)
Self-employment retirement plans: $14,900 (reported on 0.3% of returns)
14513:
$14,900
New York:
$27,330
Total itemized deductions: $16,439 (21% of AGI, reported on 21.9% of returns)
Here:
$16,439
State:
$34,985
Here:
20.7% of AGI
State:
21.3% of AGI
(% of AGI for various income ranges: 4.8% for AGIs below $25k, 6.7% for AGIs $25k-50k, 7.9% for AGIs $50k-75k, 10.1% for AGIs $75k-100k, 13.1% for AGIs $100k-200k, 11.0% for AGIs over 200k)
Charity contributions: $2,594 (reported on 16.9% of returns)
Here:
$2,594
State:
$5,572
(% of AGI for various income ranges: 0.4% for AGIs below $25k, 0.7% for AGIs $25k-50k, 1.0% for AGIs $50k-75k, 1.2% for AGIs $75k-100k, 1.8% for AGIs $100k-200k, 1.5% for AGIs over 200k)
Taxes paid: $8,079 (reported on 21.8% of returns)
14513:
$8,079
State:
$18,656
(% of AGI for various income ranges: 1.3% for AGIs below $25k, 2.6% for AGIs $25k-50k, 3.6% for AGIs $50k-75k, 4.8% for AGIs $75k-100k, 7.3% for AGIs $100k-200k, 8.4% for AGIs over 200k)
Earned income credit: $2,224 (reported on 19.5% of returns)
Here:
$2,224
State:
$2,230
(% of AGI for various income ranges: 5.9% for AGIs below $25k, 1.0% for AGIs $25k-50k)
Percentage of individuals using paid preparers for their 2012 taxes: 52.3%
Here:
52%
State:
66%
(% for various income ranges: 47.0% for AGIs below $25k, 54.0% for AGIs $25k-50k, 57.0% for AGIs $50k-75k, 57.7% for AGIs $75k-100k, 61.0% for AGIs $100k-200k, 80.0% for AGIs over 200k)
Averages for the 2004 tax year for zip code 14513, filed in 2005:
Average Adjusted Gross Income (AGI) in 2004: $35,291 (Individual Income Tax Returns)
Here:
$35,291
State:
$59,519
Salary/wage: $32,722 (reported on 85.7% of returns)
Here:
$32,722
State:
$50,673
(% of AGI for various income ranges: 112.5% for AGIs below $10k, 76.5% for AGIs $10k-25k, 83.2% for AGIs $25k-50k, 80.7% for AGIs $50k-75k, 81.3% for AGIs $75k-100k, 69.0% for AGIs over 100k)
Taxable interest for individuals: $1,027 (reported on 50.7% of returns)
This zip code:
$1,027
New York:
$2,377
(% of AGI for various income ranges: 4.3% for AGIs below $10k, 2.0% for AGIs $10k-25k, 1.1% for AGIs $25k-50k, 0.9% for AGIs $50k-75k, 1.1% for AGIs $75k-100k, 2.4% for AGIs over 100k)
Taxable dividends: $2,061 (reported on 22.2% of returns)
Here:
$2,061
State:
$5,394
(% of AGI for various income ranges: 3.3% for AGIs below $10k, 1.2% for AGIs $10k-25k, 0.8% for AGIs $25k-50k, 0.8% for AGIs $50k-75k, 1.4% for AGIs $75k-100k, 2.6% for AGIs over 100k)
Net capital gain/loss: +$2,436 (reported on 16.0% of returns)
Here:
+$2,436
State:
+$23,581
(% of AGI for various income ranges: -2.0% for AGIs below $10k, 0.4% for AGIs $10k-25k, 0.4% for AGIs $25k-50k, 0.7% for AGIs $50k-75k, 1.1% for AGIs $75k-100k, 3.6% for AGIs over 100k)
Profit/loss from business: +$9,909 (reported on 9.8% of returns)
Here:
+$9,909
State:
+$13,809
(% of AGI for various income ranges: -2.7% for AGIs below $10k, 2.9% for AGIs $10k-25k, 1.8% for AGIs $25k-50k, 2.0% for AGIs $50k-75k, 1.9% for AGIs $75k-100k, 6.6% for AGIs over 100k)
IRA payment deduction: $2,638 (reported on 2.1% of returns)
14513:
$2,638
New York:
$3,115
(% of AGI for various income ranges: 0.3% for AGIs $10k-25k, 0.2% for AGIs $25k-50k, 0.2% for AGIs $50k-75k, 0.2% for AGIs $75k-100k)
Self-employed pension: $12,576 (reported on 0.5% of returns)
Here:
$12,576
New York:
$19,016
Total itemized deductions: $15,260 (22% of AGI, reported on 25.7% of returns)
Here:
$15,260
State:
$25,864
Here:
22.1% of AGI
State:
21.9% of AGI
(% of AGI for various income ranges: 7.4% for AGIs below $10k, 5.7% for AGIs $10k-25k, 8.2% for AGIs $25k-50k, 13.2% for AGIs $50k-75k, 13.8% for AGIs $75k-100k, 15.0% for AGIs over 100k)
Charity contributions deductions: $2,176 (3% of AGI, reported on 22.9% of returns)
Here:
$2,176
State:
$4,439
Here:
3.0% of AGI
State:
3.6% of AGI
(% of AGI for various income ranges: 0.5% for AGIs below $10k, 0.6% for AGIs $10k-25k, 0.9% for AGIs $25k-50k, 1.4% for AGIs $50k-75k, 1.9% for AGIs $75k-100k, 2.4% for AGIs over 100k)
Total tax: $4,370 (reported on 71.7% of returns)
14513:
$4,370
State:
$11,730
(% of AGI for various income ranges: 1.9% for AGIs below $10k, 3.7% for AGIs $10k-25k, 6.6% for AGIs $25k-50k, 8.6% for AGIs $50k-75k, 10.3% for AGIs $75k-100k, 16.6% for AGIs over 100k)
Earned income credit: $1,748 (reported on 18.4% of returns)
Here:
$1,748
State:
$1,757
Percentage of individuals using paid preparers for their 2004 taxes: 61.1%
Here:
61%
State:
67%
(% for various income ranges: 52.7% for AGIs below $10k, 62.6% for AGIs $10k-25k, 61.8% for AGIs $25k-50k, 64.7% for AGIs $50k-75k, 62.4% for AGIs $75k-100k, 74.1% for AGIs over 100k)
Household received Food Stamps/SNAP in the past 12 months: 923 Household did not receive Food Stamps/SNAP in the past 12 months: 4,943
Women who had a birth in the past 12 months: 152 (129 now married, 21 unmarried) Women who did not have a birth in the past 12 months: 2,449 (1,201 now married, 1,233 unmarried)
Housing units in zip code 14513 with a mortgage: 2,457 (263 second mortgage, 8 home equity loan, 237 both second mortgage and home equity loan) Houses without a mortgage: 148
Median monthly owner costs for units with a mortgage: $1,252 Median monthly owner costs for units without a mortgage: $581
Residents with income below the poverty level in 2022:
This zip code:
13.9%
Whole state:
14.3%
Residents with income below 50% of the poverty level in 2022:
This zip code:
6.4%
Whole state:
6.8%
Median number of rooms in houses and condos:
Here:
6.2
State:
6.3
Median number of rooms in apartments:
Here:
4.4
State:
3.8
Notable locations in this zip code not listed on our city pages
Notable locations in zip code 14513: Heiden Valley Farms (A), Peacework Organic Farm (B), Stebbins Corners (C), Five Waters Corners (D), Sunset Farms Dairy (E), Fairville Station (F), Newark Wastewater Treatment Plant (G), Silver Hill Technology Park (H), Newark Industrial Park (I), Taranwould Golf Course (J), Bodine Farm (K), Crowfield Farm (L), Golf Farm (M), Lehigh Farms (N), Erie Falcon Golf and Recreation Center (O), Village of Newark Community Center (P), Newark Public Library (Q), New York Central Hose Company (R), East End Fire Station (S), Newark Manor Nursing Home (T). Display/hide their locations on the map
Churches in zip code 14513 include: Assembly of God of Newark (A), Calvary Church (B), Church of God (C), Kingdom Hall of Jehovahs Witnesses (D), Lighthouse Baptist Church (E), Redeemer Lutheran Church (F), Newark Baptist Fellowship (G), Newark Christian Fellowship (H), Seventh Day Adventist Church (I). Display/hide their locations on the map
Cemeteries: East Newark Cemetery (1), Newark Cemetery (2), Marbletown Cemetery (3), Fairville Cemetery (4), Parker Cemetery (5), East Palmyra Cemetery (6), Glerum Farm Cemetery (7). Display/hide their locations on the map
In group quarters: 535 (-1 institutionalized population)
Size of family households: 1,629 2-persons, 638 3-persons, 714 4-persons, 280 5-persons, 90 6-persons, 57 7-or-more-persons
Size of nonfamily households: 2,078 1-person, 399 2-persons, 3 3-persons
1,482 married couples with children.
924 single-parent households (161 men, 763 women).
92.6% of residents of 14513 zip code speak English at home.
6.3% of residents speak Spanish at home (56% very well, 18% well, 26% not well).
0.5% of residents speak other Indo-European language at home (43% very well, 18% well, 38% not well).
0.7% of residents speak Asian or Pacific Island language at home (59% very well, 34% well, 8% not well).
0.2% of residents speak other language at home (57% very well, 43% well).
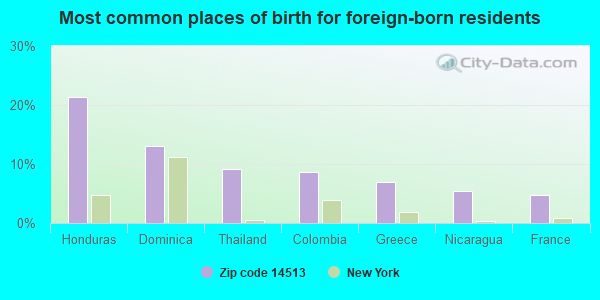
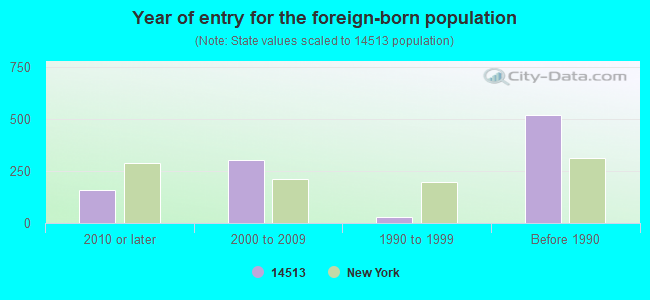
Foreign born population: 573 (4.2%) (70.2% of them are naturalized citizens)
This zip code:
4.2%
Whole state:
22.7%
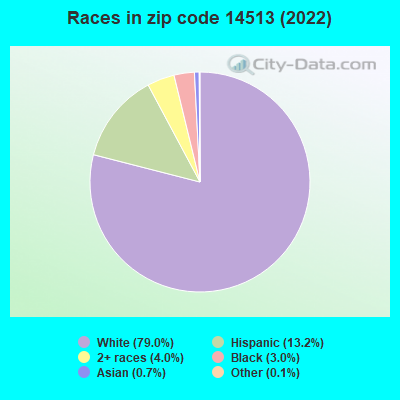
21%Honduras
13%Dominica
9%Thailand
9%Colombia
7%Greece
5%Nicaragua
5%France
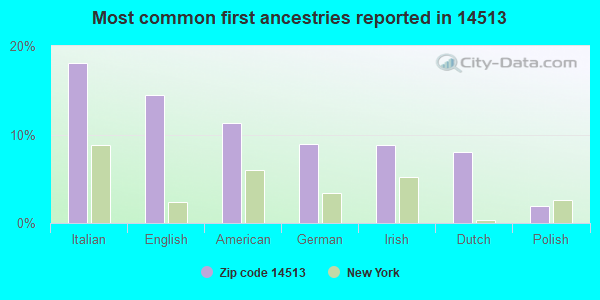
18%Italian
14%English
11%American
9%German
9%Irish
8%Dutch
2%Polish
Year of entry for the foreign-born population
1582010 or later
3022000 to 2009
301990 to 1999
520Before 1990
Facilities with environmental interests located in this zip code:
IEC ELECTRONICS CORP (105 NORTON STREET in NEWARK, NY)
AIR SYNTHETIC MINOR (AIRS/AFS) STATE MASTER (New York facility tracking) - AIR PROGRAM, HAZARDOUS WASTE PROGRAM CRITERIA AND HAZARDOUS AIR POLLUTANT INVENTORY (Inventory of air pollution sources) National Pollutant Discharge Elimination System NON-MAJOR (Tracking pollutant discharge elimination systems) - permit Small Quantity Generators, between 100 kg and 1000 kg of hazardous waste/month (Resource Conservation and Recovery Act (tracking hazardous waste)) TRANSPORTER (Resource Conservation and Recovery Act (tracking hazardous waste)) TRI REPORTER (Tracking of toxic chemicals releasing facilities) Business SIC classification: ELECTRONIC COMPONENTS Organizations: JAMES P MAZUROWSKI (FACILITY APPLICATION CONTACT)
Alternative names: I E C ELECTRONICS CORP, IEC ELECTRONICS CORP., IEC ELECTRONICS NEWARK OPS.
COLLISION 31 (6796 RTE 31 E in NEWARK, NY)
STATE MASTER (New York facility tracking) - AIR PROGRAM, (Resource Conservation and Recovery Act (tracking hazardous waste))
HICKORY MACHINE CO INC (218 FORD ST in NEWARK, NY)
(Resource Conservation and Recovery Act (tracking hazardous waste)) Conditionally Exempt Small Quantity Generators, less than 100 kg/month of hazardous waste (Resource Conservation and Recovery Act (tracking hazardous waste)) - notification Organizations: ARTHUR H THOMPSON II (CONTACT/OWNER)
HINES COLOR (621 MAPLE STREET EAST in NEWARK, NY)
(Resource Conservation and Recovery Act (tracking hazardous waste)) Alternative names: NEWARK FLORISTS INC
I E C ELECTRONICS CORP PLANT 2 (MURRAY ST in NEWARK, NY)
(Resource Conservation and Recovery Act (tracking hazardous waste))
CONCORD FORD LINC MERC INC (NEWARK PALMYRA RD in NEWARK, NY)
(Resource Conservation and Recovery Act (tracking hazardous waste))
Housing units lacking complete plumbing facilities: 3.3% Housing units lacking complete kitchen facilities: 3.9%
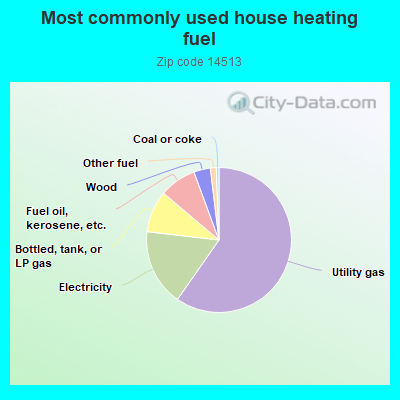
59.6%Utility gas
17.1%Electricity
9.3%Bottled, tank, or LP gas
8.2%Fuel oil, kerosene, etc.
3.7%Wood
1.3%Other fuel
0.6%Coal or coke
Population in 1990: 14,670. Population change in the 1990s: +188 (+1.3%).
Place of birth for U.S.-born residents:
This state: 11,210
Northeast: 311
Midwest: 227
South: 691
West: 95
60% of the 14513 zip code residents lived in the same house 5 years ago. Out of people who lived in different houses, 71% lived in this county. Out of people who lived in different counties, 50% lived in New York.
89% of the 14513 zip code residents lived in the same house 1 year ago. Out of people who lived in different houses, 48% moved from this county. Out of people who lived in different houses, 49% moved from different county within same state. Out of people who lived in different houses, 3% moved from different state.
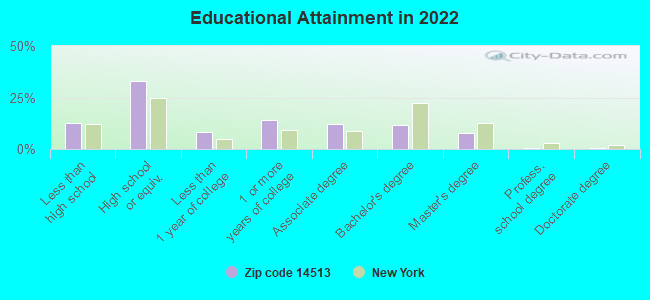
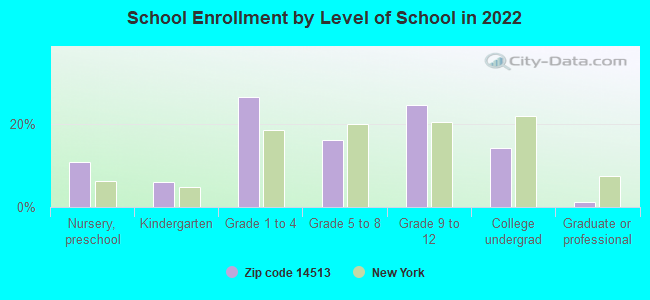
Private vs. public school enrollment:
Students in private schools in grades 1 to 8 (elementary and middle school): 309
Here:
25.1%
New York:
15.6%
Students in private schools in grades 9 to 12 (high school): 41
Here:
5.8%
New York:
15.0%
Students in private undergraduate colleges: 68
Here:
17.0%
New York:
39.2%
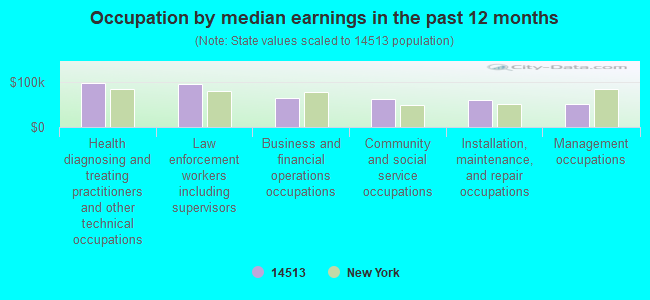
Occupation by median earnings in the past 12 months ($)
97,605Health diagnosing and treating practitioners and other technical occupations
94,748Law enforcement workers including supervisors
64,013Business and financial operations occupations
61,026Community and social service occupations
59,952Installation, maintenance, and repair occupations
50,094Management occupations
Companies with federal contracts located in this zip code:
ULTRALIFE BATTERIES INC (2000 TECHNOLOGY PARKWAY in NEWARK, NY; small business) : $137,195,629 in 67 contractsfrom 2000 to 2006
Contracts for Batteries, Nonrechargeable, Batteries, Rechargeable, Other Research and Development -- Basic Research (R&D), Miscellaneous Electrical and Electronic Components by Army, Defense Logistics Agency, Bureau of Prisoners/Federal Prison System, U.S. Special Operations Command, and others Signed by year:2000: $1,332,180; 2001: $4,317,163; 2002: $5,756,738; 2003: $79,300,069; 2004: $26,771,252; 2005: $11,492,183; 2006: $8,226,044.
Biggest contracts:
$14,015,108 with Army for Batteries, Nonrechargeable. Signed on 2003-07-31. Completion date: 2004-03-31.
$14,014,950, same as above.Signed on 2003-12-22. Completion date: 2004-03-31.
$11,955,703, same as above.Signed on 2003-02-20. Completion date: 2003-08-01.
$9,299,922, same as above.Signed on 2003-05-15. Completion date: 2003-11-20.
MACO BAG CORPORATION (412 VAN BUREN in NEWARK, NY; small business) : $446,690 in 8 contractsfrom 2002 to 2005
Contracts for Decontaminating and Impregnating Equipment, Bags and Sacks by Army Signed by year:2000: $0; 2001: $0; 2002: $207,646; 2003: $100,000; 2004: -$456; 2005: $139,500; 2006: $0.
Biggest contracts:
$107,100 with Army for Decontaminating and Impregnating Equipment. Signed on 2002-08-15. Completion date: 2003-03-15.
$100,000, same as above.Signed on 2003-05-30. Completion date: 2003-03-15.
$71,100, same as above.Signed on 2005-03-16. Completion date: 2005-07-16.
$68,400, same as above.Signed on 2005-11-07. Completion date: 2005-07-16.
EMPIRE ENTERPRISES JKB, INC (4440 MAPLE RIDGE ROAD in NEWARK, NY; small business)
$23,950 with U.S. Army Corps of Engineers - civil program financing only for Maintenance, Repair or Alteration of Real Property -- Other Administrative Facilities and Service Buildings. Signed on 2002-07-02. Completion date: 2002-09-03.
Top industries in this zip code by the number of employees in 2005:
Health Care and Social Assistance: General Medical and Surgical Hospitals (500-999 employees: 1 establishment)
Health Care and Social Assistance: Home Health Care Services (100-249: 1, 50-99: 1)
Health Care and Social Assistance: Child Day Care Services (100-249: 1, 20-49: 1, 10-19: 1, 1-4: 4)
2002 - 2018 National Fire Incident Reporting System (NFIRS) incidents
Based on the data from the years 2002 - 2018 the average number of fires per year is 42. The highest number of fires - 83 took place in 2007, and the least - 20 in 2013. The data has a declining trend.
When looking into fire subcategories, the most incidents belonged to: Structure Fires (46.5%), and Outside Fires (26.3%).
Fire incident types reported to NFIRS in Zip Code 14513


 Nearest zip codes: 14537, 14489, 14505, 14522, 14532, 14551.


 Based on the data from the years 2002 - 2018 the average number of fires per year is 42. The highest number of fires - 83 took place in 2007, and the least - 20 in 2013. The data has a declining trend.
 When looking into fire subcategories, the most incidents belonged to: Structure Fires (46.5%), and Outside Fires (26.3%).