Estimated zip code population in 2022: 4,900 Zip code population in 2010: 5,081 Zip code population in 2000: 5,282
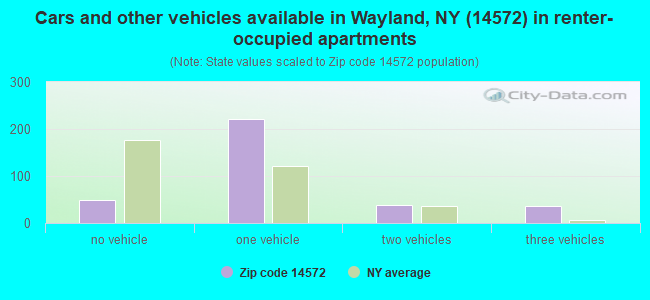
Houses and condos: 2,363 Renter-occupied apartments: 341
% of renters here:
18%
State:
46%
March 2022 cost of living index in zip code 14572: 93.4 (less than average, U.S. average is 100)
Land area: 74.7 sq. mi. Water area: 0.3 sq. mi.
Population density: 66 people per square mile
(very low).
OSM Map
General Map
Google Map
MSN Map
OSM Map
General Map
Google Map
MSN Map
OSM Map
General Map
Google Map
MSN Map
OSM Map
General Map
Google Map
MSN Map
Please wait while loading the map...
Real estate property taxes paid for housing units in 2022:
This zip code:
2.5% ($2,769)
New York:
1.5% ($6,180)
Median real estate property taxes paid for housing units with mortgages in 2022: $2,948 (2.4%) Median real estate property taxes paid for housing units with no mortgage in 2022: $2,635 (2.8%)
Averages for the 2020 tax year for zip code 14572, filed in 2021:
Average Adjusted Gross Income (AGI) in 2020: $53,167 (Individual Income Tax Returns)
Here:
$53,167
State:
$90,930
Salary/wage: $43,840 (reported on 81.6% of returns)
Here:
$43,840
State:
$72,104
(% of AGI for various income ranges: 1179.0% for AGIs below $25k, 3452.6% for AGIs $25k-50k, 5922.3% for AGIs $50k-75k, 8617.5% for AGIs $75k-100k, 13673.1% for AGIs $100k-200k)
Taxable interest for individuals: $597 (reported on 32.5% of returns)
This zip code:
$597
New York:
$3,075
(% of AGI for various income ranges: 15.2% for AGIs below $25k, 17.4% for AGIs $25k-50k, 28.7% for AGIs $50k-75k, 25.0% for AGIs $75k-100k, 67.5% for AGIs $100k-200k)
Ordinary dividends: $1,974 (reported on 15.4% of returns)
Here:
$1,974
State:
$11,095
(% of AGI for various income ranges: 22.4% for AGIs below $25k, 17.7% for AGIs $25k-50k, 33.0% for AGIs $50k-75k, 40.0% for AGIs $75k-100k, 201.3% for AGIs $100k-200k)
Net capital gain/loss in AGI: +$7,319 (reported on 11.8% of returns)
Here:
+$7,319
State:
+$44,925
(% of AGI for various income ranges: 8.6% for AGIs below $25k, 15.8% for AGIs $25k-50k, 46.3% for AGIs $50k-75k, 158.1% for AGIs $75k-100k, 910.6% for AGIs $100k-200k)
Profit/loss from business: +$2,769 (reported on 11.4% of returns)
Here:
+$2,769
State:
+$14,940
(% of AGI for various income ranges: 39.6% for AGIs below $25k, 4.5% for AGIs $25k-50k, 42.0% for AGIs $50k-75k, 152.5% for AGIs $75k-100k, 80.0% for AGIs $100k-200k)
Taxable individual retirement arrangement distribution: $15,817 (reported on 10.5% of returns)
14572:
$15,817
New York:
$19,609
(% of AGI for various income ranges: 79.2% for AGIs below $25k, 99.6% for AGIs $25k-50k, 253.0% for AGIs $50k-75k, 428.1% for AGIs $75k-100k, 892.5% for AGIs $100k-200k)
Total itemized deductions: $21,500 (reported on 1.8% of returns)
Here:
$21,500
State:
$39,326
(% of AGI for various income ranges: 537.5% for AGIs $75k-100k)
Taxes paid: $6,925 (reported on 1.8% of returns)
14572:
$6,925
State:
$9,183
(% of AGI for various income ranges: 173.1% for AGIs $75k-100k)
Earned income credit: $2,092 (reported on 16.2% of returns)
Here:
$2,092
State:
$2,138
(% of AGI for various income ranges: 86.2% for AGIs below $25k, 64.7% for AGIs $25k-50k)
Percentage of individuals using paid preparers for their 2020 taxes: 96.1%
Here:
96%
State:
95%
(% for various income ranges: 94.4% for AGIs below $25k, 98.5% for AGIs $25k-50k, 95.0% for AGIs $50k-75k, 95.7% for AGIs $75k-100k, 95.8% for AGIs $100k-200k, 100.0% for AGIs over 200k)
Averages for the 2012 tax year for zip code 14572, filed in 2013:
Average Adjusted Gross Income (AGI) in 2012: $41,237 (Individual Income Tax Returns)
Here:
$41,237
State:
$77,088
Salary/wage: $37,244 (reported on 84.3% of returns)
Here:
$37,244
State:
$60,593
(% of AGI for various income ranges: 73.5% for AGIs below $25k, 80.0% for AGIs $25k-50k, 75.8% for AGIs $50k-75k, 78.4% for AGIs $75k-100k, 72.6% for AGIs $100k-200k)
Taxable interest for individuals: $593 (reported on 31.7% of returns)
This zip code:
$593
New York:
$3,125
(% of AGI for various income ranges: 0.8% for AGIs below $25k, 0.6% for AGIs $25k-50k, 0.4% for AGIs $50k-75k, 0.3% for AGIs $75k-100k, 0.2% for AGIs $100k-200k)
Ordinary dividends: $1,293 (reported on 17.8% of returns)
Here:
$1,293
State:
$10,299
(% of AGI for various income ranges: 0.4% for AGIs below $25k, 0.4% for AGIs $25k-50k, 0.6% for AGIs $50k-75k, 0.5% for AGIs $75k-100k, 0.7% for AGIs $100k-200k)
Net capital gain/loss in AGI: +$3,025 (reported on 8.7% of returns)
Here:
+$3,025
State:
+$42,474
(% of AGI for various income ranges: 0.3% for AGIs $25k-50k, 0.6% for AGIs $50k-75k, 1.3% for AGIs $75k-100k, 0.9% for AGIs $100k-200k)
Profit/loss from business: +$7,844 (reported on 11.7% of returns)
Here:
+$7,844
State:
+$16,168
(% of AGI for various income ranges: 5.3% for AGIs below $25k, 2.6% for AGIs $25k-50k, 2.6% for AGIs $50k-75k, 2.0% for AGIs $75k-100k)
Taxable individual retirement arrangement distribution: $10,490 (reported on 9.1% of returns)
14572:
$10,490
New York:
$17,621
(% of AGI for various income ranges: 3.8% for AGIs below $25k, 2.3% for AGIs $25k-50k, 2.3% for AGIs $50k-75k, 4.5% for AGIs $75k-100k)
Total itemized deductions: $16,277 (21% of AGI, reported on 19.1% of returns)
Here:
$16,277
State:
$34,985
Here:
20.8% of AGI
State:
21.3% of AGI
(% of AGI for various income ranges: 4.4% for AGIs below $25k, 5.3% for AGIs $25k-50k, 7.8% for AGIs $50k-75k, 7.0% for AGIs $75k-100k, 11.7% for AGIs $100k-200k)
Charity contributions: $2,358 (reported on 14.3% of returns)
Here:
$2,358
State:
$5,572
(% of AGI for various income ranges: 0.4% for AGIs below $25k, 0.4% for AGIs $25k-50k, 0.9% for AGIs $50k-75k, 0.8% for AGIs $75k-100k, 1.3% for AGIs $100k-200k)
Taxes paid: $7,325 (reported on 19.1% of returns)
14572:
$7,325
State:
$18,656
(% of AGI for various income ranges: 1.7% for AGIs below $25k, 1.8% for AGIs $25k-50k, 3.3% for AGIs $50k-75k, 3.3% for AGIs $75k-100k, 6.1% for AGIs $100k-200k)
Earned income credit: $1,973 (reported on 21.3% of returns)
Here:
$1,973
State:
$2,230
(% of AGI for various income ranges: 5.8% for AGIs below $25k, 1.2% for AGIs $25k-50k)
Percentage of individuals using paid preparers for their 2012 taxes: 60.0%
Here:
60%
State:
66%
(% for various income ranges: 54.1% for AGIs below $25k, 60.7% for AGIs $25k-50k, 64.9% for AGIs $50k-75k, 68.4% for AGIs $75k-100k, 73.3% for AGIs $100k-200k)
Averages for the 2004 tax year for zip code 14572, filed in 2005:
Average Adjusted Gross Income (AGI) in 2004: $34,485 (Individual Income Tax Returns)
Here:
$34,485
State:
$59,519
Salary/wage: $32,085 (reported on 86.5% of returns)
Here:
$32,085
State:
$50,673
(% of AGI for various income ranges: 92.2% for AGIs below $10k, 75.1% for AGIs $10k-25k, 83.5% for AGIs $25k-50k, 81.2% for AGIs $50k-75k, 81.7% for AGIs $75k-100k, 71.7% for AGIs over 100k)
Taxable interest for individuals: $827 (reported on 43.6% of returns)
This zip code:
$827
New York:
$2,377
(% of AGI for various income ranges: 4.0% for AGIs below $10k, 2.4% for AGIs $10k-25k, 0.7% for AGIs $25k-50k, 0.9% for AGIs $50k-75k, 0.5% for AGIs $75k-100k, 1.0% for AGIs over 100k)
Taxable dividends: $1,090 (reported on 21.2% of returns)
Here:
$1,090
State:
$5,394
(% of AGI for various income ranges: 2.7% for AGIs below $10k, 0.8% for AGIs $10k-25k, 0.5% for AGIs $25k-50k, 0.5% for AGIs $50k-75k, 0.3% for AGIs $75k-100k, 1.3% for AGIs over 100k)
Net capital gain/loss: +$3,163 (reported on 12.8% of returns)
Here:
+$3,163
State:
+$23,581
(% of AGI for various income ranges: -1.6% for AGIs below $10k, -0.4% for AGIs $10k-25k, 0.5% for AGIs $25k-50k, 1.3% for AGIs $50k-75k, 0.5% for AGIs $75k-100k, 6.1% for AGIs over 100k)
Profit/loss from business: +$6,539 (reported on 12.9% of returns)
Here:
+$6,539
State:
+$13,809
(% of AGI for various income ranges: 5.3% for AGIs below $10k, 4.2% for AGIs $10k-25k, 2.1% for AGIs $25k-50k, 1.9% for AGIs $50k-75k, 1.8% for AGIs $75k-100k, 3.0% for AGIs over 100k)
IRA payment deduction: $2,674 (reported on 1.9% of returns)
14572:
$2,674
New York:
$3,115
Total itemized deductions: $13,626 (21% of AGI, reported on 20.4% of returns)
Here:
$13,626
State:
$25,864
Here:
20.9% of AGI
State:
21.9% of AGI
(% of AGI for various income ranges: 4.2% for AGIs $10k-25k, 5.8% for AGIs $25k-50k, 8.4% for AGIs $50k-75k, 12.6% for AGIs $75k-100k, 12.8% for AGIs over 100k)
Charity contributions deductions: $1,838 (3% of AGI, reported on 18.8% of returns)
Here:
$1,838
State:
$4,439
Here:
2.8% of AGI
State:
3.6% of AGI
(% of AGI for various income ranges: 0.5% for AGIs $10k-25k, 0.7% for AGIs $25k-50k, 1.2% for AGIs $50k-75k, 1.4% for AGIs $75k-100k, 1.7% for AGIs over 100k)
Total tax: $3,876 (reported on 72.4% of returns)
14572:
$3,876
State:
$11,730
(% of AGI for various income ranges: 2.2% for AGIs below $10k, 3.8% for AGIs $10k-25k, 6.6% for AGIs $25k-50k, 8.5% for AGIs $50k-75k, 9.8% for AGIs $75k-100k, 15.1% for AGIs over 100k)
Earned income credit: $1,664 (reported on 16.7% of returns)
Here:
$1,664
State:
$1,757
Percentage of individuals using paid preparers for their 2004 taxes: 62.4%
Here:
62%
State:
67%
(% for various income ranges: 54.3% for AGIs below $10k, 66.5% for AGIs $10k-25k, 60.2% for AGIs $25k-50k, 66.6% for AGIs $50k-75k, 67.8% for AGIs $75k-100k, 73.8% for AGIs over 100k)
Likely homosexual households (counted as self-reported same-sex unmarried-partner households)
Lesbian couples: 0.7% of all households
Gay men: 0.0% of all households
Household received Food Stamps/SNAP in the past 12 months: 302 Household did not receive Food Stamps/SNAP in the past 12 months: 1,622
Women who had a birth in the past 12 months: 58 (52 now married, 5 unmarried) Women who did not have a birth in the past 12 months: 991 (373 now married, 618 unmarried)
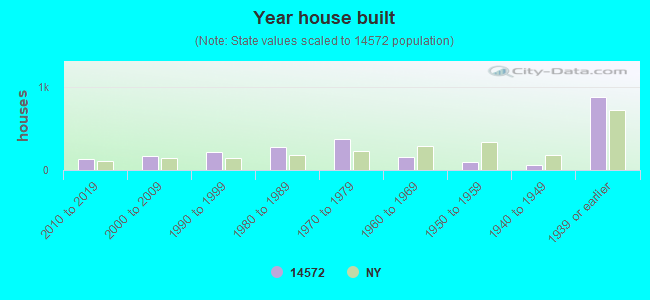
Housing units in zip code 14572 with a mortgage: 784 (69 second mortgage, 70 both second mortgage and home equity loan) Houses without a mortgage: 149
Median monthly owner costs for units with a mortgage: $1,143 Median monthly owner costs for units without a mortgage: $615
Residents with income below the poverty level in 2022:
This zip code:
20.4%
Whole state:
14.3%
Residents with income below 50% of the poverty level in 2022:
This zip code:
11.3%
Whole state:
6.8%
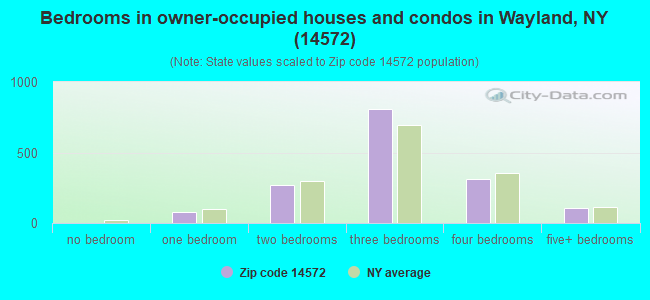
Median number of rooms in houses and condos:
Here:
6.8
State:
6.3
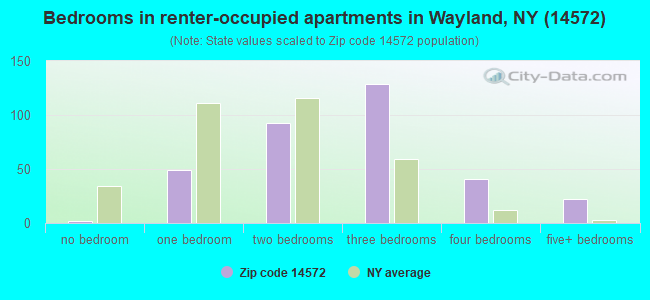
Median number of rooms in apartments:
Here:
5.5
State:
3.8
Notable locations in this zip code not listed on our city pages
Notable locations in zip code 14572: Tabor Corners (A), Wayland Village Wastewater Treatment Plant (B), Bowles Corners (C), Wayland Free Library (D), Wayland Fire Department (E). Display/hide their locations on the map
Churches in zip code 14572 include: Wright Church (A), Pleasant Valley Church (B), Lighthouse Wesleyan Church (C), Saint Paul's United Church of Christ (D), Seventh Day Adventist Church (E), Holy Family Catholic Community (F), Loon Lake Chapel (G), North Loon Lake Church (H). Display/hide their locations on the map
Cemeteries: Saint Josephs Cemetery (1), Saint Peters Cemetery (2), Fort Farm Cemetery (3), Pleasant Valley West Cemetery (4), Sacred Heart Cemetery (5), North Loon Lake Cemetery (6), Wayland Cemetery (7). Display/hide their locations on the map
In group quarters: 49 (-1 institutionalized population)
Size of family households: 642 2-persons, 244 3-persons, 206 4-persons, 123 5-persons, 39 6-persons, 59 7-or-more-persons
Size of nonfamily households: 518 1-person, 86 2-persons, 4 4-persons
772 married couples with children.
398 single-parent households (90 men, 308 women).
95.7% of residents of 14572 zip code speak English at home.
1.0% of residents speak Spanish at home (64% very well, 30% well, 6% not well).
2.8% of residents speak other Indo-European language at home (89% very well, 11% well).
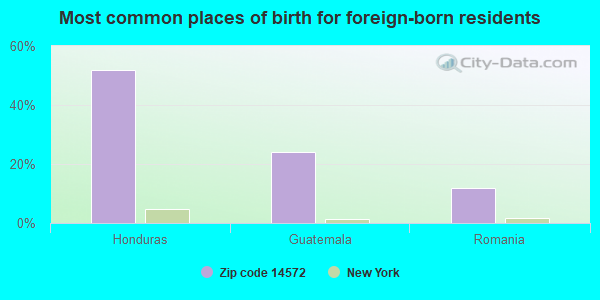
Foreign born population: 25 (0.5%) (16.1% of them are naturalized citizens)
This zip code:
0.5%
Whole state:
22.7%
52%Honduras
24%Guatemala
12%Romania
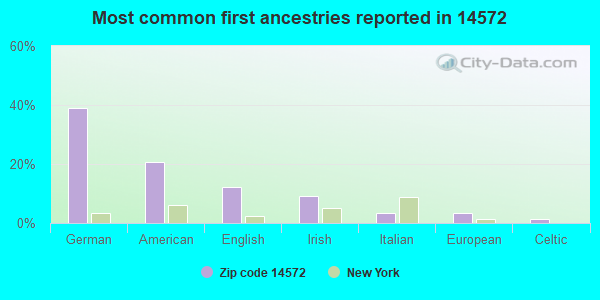
39%German
21%American
12%English
9%Irish
4%Italian
3%European
1%Celtic
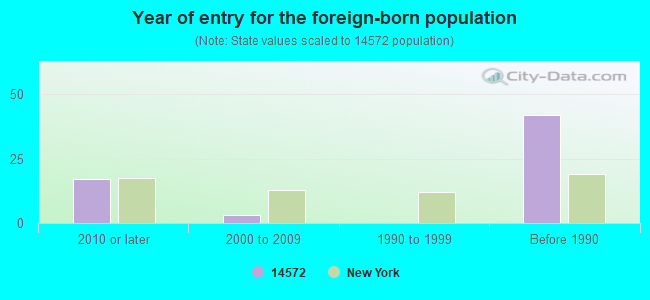
Year of entry for the foreign-born population
172010 or later
32000 to 2009
01990 to 1999
42Before 1990
Facilities with environmental interests located in this zip code:
GUNLOCKE CO (1 GUNLOCKE DRIVE in WAYLAND, NY)
AIR MAJOR (AIRS/AFS) STATE MASTER (New York facility tracking) - AIR PROGRAM, National Pollutant Discharge Elimination System Permit, AIR MAJOR, HAZARDOUS WASTE PROGRAM, National Pollutant Discharge Elimination System Permit (Integrated Compliance Information System) - ICIS-02-1996-0083, FORMAL ENFORCEMENT ACTION, ICIS-02-1992-0030, ICIS-02-1995-0098, COMPLIANCE ACTIVITY (Tracking inspections of insecticide, fungicide, and rodenticide, and toxic substances) CRITERIA AND HAZARDOUS AIR POLLUTANT INVENTORY (Inventory of air pollution sources) National Pollutant Discharge Elimination System NON-MAJOR (Tracking pollutant discharge elimination systems) - permit HAZARDOUS WASTE BIENNIAL REPORTER (Resource Conservation and Recovery Act (tracking hazardous waste)) Large Quantity Generators, more that 1000 kg of hazardous waste/month (Resource Conservation and Recovery Act (tracking hazardous waste)) TRI REPORTER (Tracking of toxic chemicals releasing facilities) Business SIC classification: WOOD OFFICE FURNITURE; FABRICATED METAL PRODUCTS; NONCLASSIFIABLE ESTABLISHMENTS Business NAICS classification: WOOD OFFICE FURNITURE MANUFACTURING.; WOOD OFFICE FURNITURE MANUFACTURING.; WOOD OFFICE FURNITURE MANUFACTURING. Organizations: HON INDUSTRIES INC (CONTACT/OPERATOR)
, THE GUNLOCKE COMPANY (CONTACT/OWNER)
, JOHN DAMHOSL GM (CONTACT/OWNER)
, PETER HAGMIRE (FACILITY APPLICATION CONTACT)
, GUNLOCKE CO INC (LEGALLY RESPONSIBLE PARTY)
A B COWLES (26 PINE ST in WAYLAND, NY)
Large Quantity Generators, more that 1000 kg of hazardous waste/month (Resource Conservation and Recovery Act (tracking hazardous waste)) - notification TRANSPORTER (Resource Conservation and Recovery Act (tracking hazardous waste)) - notification Organizations: A B COWLES INC (CONTACT/OWNER)
GUARGLIA JERRY & TONY (311 W NAPLES ST in WAYLAND, NY)
(Resource Conservation and Recovery Act (tracking hazardous waste)) Organizations: JERRY & TONY GUARGLIA (CONTACT/OWNER)
A R & M CORP WAYLAND TERMINAL (RTE 15 in WAYLAND, NY)
(Resource Conservation and Recovery Act (tracking hazardous waste))
BENNETTS BUICK-CHEVROLET-OLDS CORP (7 S LACKAWANNA ST in WAYLAND, NY)
(Resource Conservation and Recovery Act (tracking hazardous waste))
GRIFFITH ENERGY INC (119 MAIN ST. in WAYLAND, NY)
CRITERIA AND HAZARDOUS AIR POLLUTANT INVENTORY (Inventory of air pollution sources) TRI REPORTER (Tracking of toxic chemicals releasing facilities) Business SIC classification: PETROLEUM BULK STATIONS AND TERMINALS Alternative names: GRIFFITH OIL CO. INC., GRIFFITH OIL. CO. INC.
Housing units lacking complete plumbing facilities: 2.3% Housing units lacking complete kitchen facilities: 2.7%
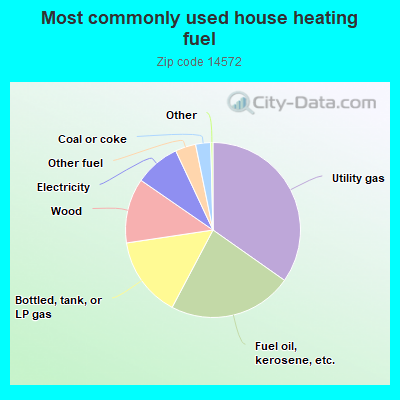
34.8%Utility gas
23.0%Fuel oil, kerosene, etc.
14.9%Bottled, tank, or LP gas
12.0%Wood
8.4%Electricity
3.8%Other fuel
2.8%Coal or coke
Population in 1990: 5,626.
Place of birth for U.S.-born residents:
This state: 4,365
Northeast: 150
Midwest: 83
South: 170
West: 47
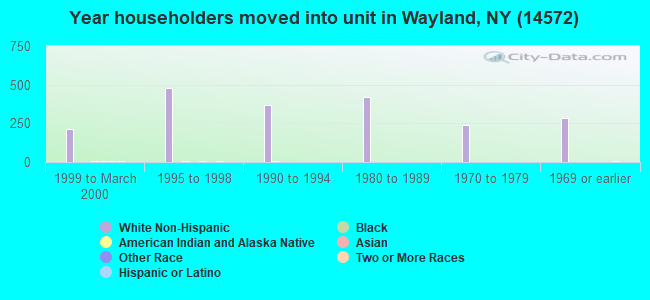
64% of the 14572 zip code residents lived in the same house 5 years ago. Out of people who lived in different houses, 58% lived in this county. Out of people who lived in different counties, 50% lived in New York.
93% of the 14572 zip code residents lived in the same house 1 year ago. Out of people who lived in different houses, 42% moved from this county. Out of people who lived in different houses, 42% moved from different county within same state. Out of people who lived in different houses, 15% moved from different state.
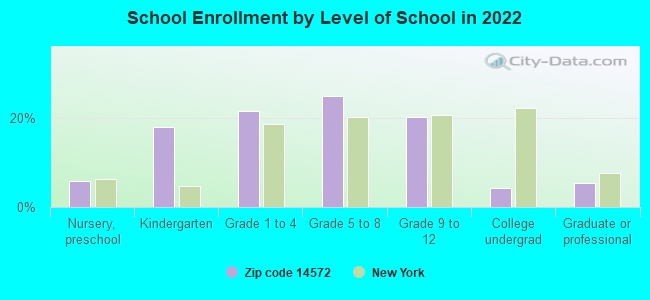
Private vs. public school enrollment:
Students in private schools in grades 1 to 8 (elementary and middle school): 73
Here:
11.7%
New York:
15.6%
Students in private schools in grades 9 to 12 (high school): 26
Here:
9.7%
New York:
15.0%
Students in private undergraduate colleges: 2
Here:
5.0%
New York:
39.2%
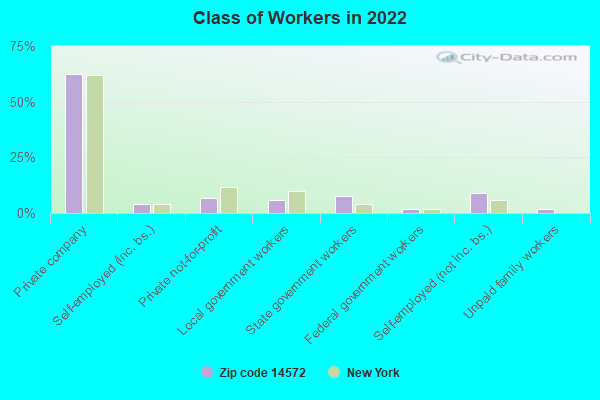
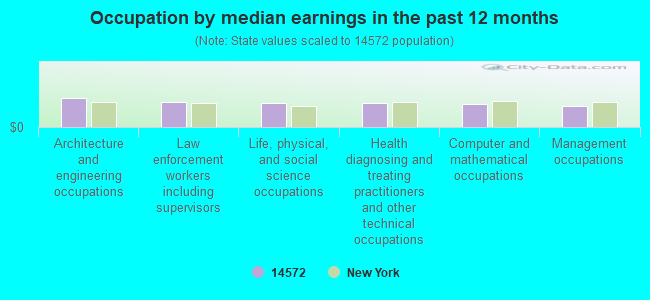
Occupation by median earnings in the past 12 months ($)
100,165Architecture and engineering occupations
84,046Law enforcement workers including supervisors
83,212Life, physical, and social science occupations
82,994Health diagnosing and treating practitioners and other technical occupations
78,195Computer and mathematical occupations
71,000Management occupations
Top industries in this zip code by the number of employees in 2005:
Finance and Insurance: Insurance Agencies and Brokerages (10-19 employees: 1 establishment, 5-9 employees: 1 establishment, 1-4 employees: 1 establishment)
Health Care and Social Assistance: Child Day Care Services (10-19: 1, 5-9: 1)
Health Care and Social Assistance: Offices of Dentists (10-19: 1, 5-9: 1)
People in group quarters in 2010:
22 people in group homes intended for adults
People in group quarters in 2000:
34 people in homes for the mentally retarded
10 people in other noninstitutional group quarters
Fatal accident statistics in 2012:
Fatal accident count: 1
Vehicles involved in fatal accidents: 2
Fatal accidents caused by drunken drivers: 1
Fatalities: 1
Persons involved in fatal accidents: 1
Pedestrians involved in fatal accidents: 0
Home Mortgage Disclosure Act Aggregated Statistics For Year 2009 (Based on 2 partial tracts)
A) FHA, FSA/RHS & VA Home Purchase Loans
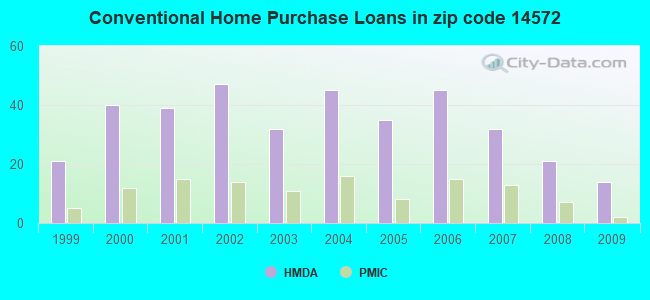
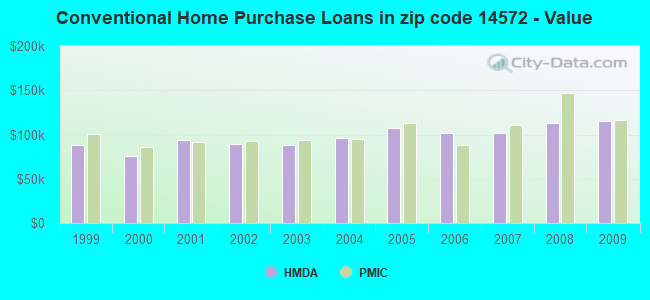
B) Conventional Home Purchase Loans
C) Refinancings
D) Home Improvement Loans
E) Loans on Dwellings For 5+ Families
F) Non-occupant Loans on < 5 Family Dwellings (A B C & D)
G) Loans On Manufactured Home Dwelling (A B C & D)
Number
Average Value
Number
Average Value
Number
Average Value
Number
Average Value
Number
Average Value
Number
Average Value
Number
Average Value
LOANS ORIGINATED
15
$107,750
14
$114,857
41
$116,579
20
$22,312
1
$234,000
8
$135,562
8
$72,000
APPLICATIONS APPROVED, NOT ACCEPTED
0
$0
2
$107,625
8
$144,000
1
$15,750
0
$0
0
$0
2
$42,375
APPLICATIONS DENIED
2
$67,500
5
$115,950
23
$112,761
11
$12,682
0
$0
3
$88,000
4
$53,812
APPLICATIONS WITHDRAWN
2
$70,125
2
$240,000
14
$117,107
1
$11,250
0
$0
1
$75,000
2
$59,250
FILES CLOSED FOR INCOMPLETENESS
0
$0
1
$312,750
6
$138,125
1
$26,250
0
$0
0
$0
1
$26,250
Aggregated Statistics For Year 2008 (Based on 2 partial tracts)
A) FHA, FSA/RHS & VA Home Purchase Loans
B) Conventional Home Purchase Loans
C) Refinancings
D) Home Improvement Loans
F) Non-occupant Loans on < 5 Family Dwellings (A B C & D)
G) Loans On Manufactured Home Dwelling (A B C & D)
Number
Average Value
Number
Average Value
Number
Average Value
Number
Average Value
Number
Average Value
Number
Average Value
LOANS ORIGINATED
5
$91,350
21
$112,643
33
$106,750
23
$34,630
11
$148,159
6
$55,875
APPLICATIONS APPROVED, NOT ACCEPTED
2
$52,500
2
$200,625
5
$100,050
2
$28,125
1
$119,250
1
$33,000
APPLICATIONS DENIED
5
$76,800
2
$46,875
47
$109,261
17
$42,441
3
$71,500
11
$63,205
APPLICATIONS WITHDRAWN
2
$54,375
3
$136,750
23
$106,043
6
$81,000
3
$166,000
2
$40,125
FILES CLOSED FOR INCOMPLETENESS
0
$0
0
$0
4
$121,500
0
$0
0
$0
2
$47,250
Aggregated Statistics For Year 2007 (Based on 2 partial tracts)
A) FHA, FSA/RHS & VA Home Purchase Loans
B) Conventional Home Purchase Loans
C) Refinancings
D) Home Improvement Loans
F) Non-occupant Loans on < 5 Family Dwellings (A B C & D)
G) Loans On Manufactured Home Dwelling (A B C & D)
Number
Average Value
Number
Average Value
Number
Average Value
Number
Average Value
Number
Average Value
Number
Average Value
LOANS ORIGINATED
12
$95,188
32
$102,258
41
$98,451
33
$21,500
11
$109,909
7
$56,357
APPLICATIONS APPROVED, NOT ACCEPTED
0
$0
2
$155,625
11
$86,250
3
$61,000
2
$63,000
0
$0
APPLICATIONS DENIED
3
$79,500
7
$174,429
48
$83,609
31
$33,556
5
$57,600
5
$79,050
APPLICATIONS WITHDRAWN
2
$99,000
2
$199,875
28
$97,205
7
$45,107
0
$0
1
$15,750
FILES CLOSED FOR INCOMPLETENESS
0
$0
4
$72,000
8
$165,656
2
$39,375
1
$51,000
1
$65,250
Aggregated Statistics For Year 2006 (Based on 2 partial tracts)
A) FHA, FSA/RHS & VA Home Purchase Loans
B) Conventional Home Purchase Loans
C) Refinancings
D) Home Improvement Loans
F) Non-occupant Loans on < 5 Family Dwellings (A B C & D)
G) Loans On Manufactured Home Dwelling (A B C & D)
Number
Average Value
Number
Average Value
Number
Average Value
Number
Average Value
Number
Average Value
Number
Average Value
LOANS ORIGINATED
8
$93,562
45
$102,083
53
$85,090
28
$30,402
12
$89,688
17
$62,559
APPLICATIONS APPROVED, NOT ACCEPTED
0
$0
5
$78,300
9
$90,833
5
$24,450
2
$68,250
2
$36,375
APPLICATIONS DENIED
2
$41,250
9
$89,083
62
$85,173
38
$32,487
2
$46,875
19
$41,961
APPLICATIONS WITHDRAWN
1
$24,750
5
$58,950
25
$88,980
8
$69,750
2
$94,875
4
$62,250
FILES CLOSED FOR INCOMPLETENESS
0
$0
0
$0
8
$88,594
1
$47,250
0
$0
0
$0
Aggregated Statistics For Year 2005 (Based on 2 partial tracts)
A) FHA, FSA/RHS & VA Home Purchase Loans
B) Conventional Home Purchase Loans
C) Refinancings
D) Home Improvement Loans
F) Non-occupant Loans on < 5 Family Dwellings (A B C & D)
G) Loans On Manufactured Home Dwelling (A B C & D)
Number
Average Value
Number
Average Value
Number
Average Value
Number
Average Value
Number
Average Value
Number
Average Value
LOANS ORIGINATED
11
$102,545
35
$106,843
41
$87,512
35
$22,457
7
$107,357
10
$50,175
APPLICATIONS APPROVED, NOT ACCEPTED
1
$89,250
7
$83,143
11
$102,955
2
$33,375
1
$75,000
2
$78,750
APPLICATIONS DENIED
2
$36,000
9
$67,167
74
$86,625
30
$30,075
3
$51,000
18
$61,458
APPLICATIONS WITHDRAWN
2
$82,500
9
$218,917
38
$88,855
6
$98,625
2
$768,750
8
$48,844
FILES CLOSED FOR INCOMPLETENESS
0
$0
4
$69,000
10
$98,325
0
$0
2
$41,250
0
$0
Aggregated Statistics For Year 2004 (Based on 2 partial tracts)
A) FHA, FSA/RHS & VA Home Purchase Loans
B) Conventional Home Purchase Loans
C) Refinancings
D) Home Improvement Loans
F) Non-occupant Loans on < 5 Family Dwellings (A B C & D)
G) Loans On Manufactured Home Dwelling (A B C & D)
Number
Average Value
Number
Average Value
Number
Average Value
Number
Average Value
Number
Average Value
Number
Average Value
LOANS ORIGINATED
8
$88,500
45
$96,583
56
$84,737
28
$21,348
11
$79,636
8
$49,969
APPLICATIONS APPROVED, NOT ACCEPTED
0
$0
6
$69,875
17
$85,191
5
$23,700
2
$85,875
2
$39,000
APPLICATIONS DENIED
2
$81,000
6
$52,625
73
$80,949
32
$34,289
2
$89,625
8
$56,062
APPLICATIONS WITHDRAWN
0
$0
5
$110,400
41
$83,415
6
$35,000
1
$62,250
3
$54,250
FILES CLOSED FOR INCOMPLETENESS
0
$0
3
$64,500
11
$107,864
0
$0
0
$0
0
$0
Aggregated Statistics For Year 2003 (Based on 2 partial tracts)
A) FHA, FSA/RHS & VA Home Purchase Loans
B) Conventional Home Purchase Loans
C) Refinancings
D) Home Improvement Loans
F) Non-occupant Loans on < 5 Family Dwellings (A B C & D)
Number
Average Value
Number
Average Value
Number
Average Value
Number
Average Value
Number
Average Value
LOANS ORIGINATED
9
$91,417
32
$88,406
110
$83,884
24
$13,531
8
$75,750
APPLICATIONS APPROVED, NOT ACCEPTED
2
$67,500
5
$81,600
16
$85,031
2
$14,250
1
$69,750
APPLICATIONS DENIED
2
$53,625
8
$77,625
65
$75,612
15
$20,400
2
$33,000
APPLICATIONS WITHDRAWN
0
$0
7
$76,929
34
$66,463
4
$15,562
2
$61,125
FILES CLOSED FOR INCOMPLETENESS
0
$0
0
$0
5
$84,000
2
$41,250
0
$0
Aggregated Statistics For Year 2002 (Based on 2 partial tracts)
A) FHA, FSA/RHS & VA Home Purchase Loans
B) Conventional Home Purchase Loans
C) Refinancings
D) Home Improvement Loans
F) Non-occupant Loans on < 5 Family Dwellings (A B C & D)
Number
Average Value
Number
Average Value
Number
Average Value
Number
Average Value
Number
Average Value
LOANS ORIGINATED
14
$72,643
47
$88,707
86
$93,672
24
$13,094
7
$94,821
APPLICATIONS APPROVED, NOT ACCEPTED
5
$70,500
0
$0
17
$111,353
5
$13,800
0
$0
APPLICATIONS DENIED
0
$0
10
$53,325
48
$71,891
20
$19,275
3
$63,750
APPLICATIONS WITHDRAWN
1
$47,250
3
$78,250
29
$80,172
5
$36,000
0
$0
FILES CLOSED FOR INCOMPLETENESS
0
$0
2
$49,125
10
$88,950
0
$0
1
$57,000
Aggregated Statistics For Year 2001 (Based on 2 partial tracts)
A) FHA, FSA/RHS & VA Home Purchase Loans
B) Conventional Home Purchase Loans
C) Refinancings
D) Home Improvement Loans
F) Non-occupant Loans on < 5 Family Dwellings (A B C & D)
Number
Average Value
Number
Average Value
Number
Average Value
Number
Average Value
Number
Average Value
LOANS ORIGINATED
11
$79,909
39
$93,462
71
$78,053
26
$12,260
8
$81,375
APPLICATIONS APPROVED, NOT ACCEPTED
1
$36,000
8
$50,812
17
$74,162
4
$17,812
0
$0
APPLICATIONS DENIED
2
$80,250
9
$68,917
57
$71,658
16
$12,188
0
$0
APPLICATIONS WITHDRAWN
2
$63,000
4
$96,562
39
$70,019
5
$20,250
0
$0
FILES CLOSED FOR INCOMPLETENESS
0
$0
2
$143,625
8
$61,781
1
$7,500
0
$0
Aggregated Statistics For Year 2000 (Based on 2 partial tracts)
A) FHA, FSA/RHS & VA Home Purchase Loans
B) Conventional Home Purchase Loans
C) Refinancings
D) Home Improvement Loans
F) Non-occupant Loans on < 5 Family Dwellings (A B C & D)
Number
Average Value
Number
Average Value
Number
Average Value
Number
Average Value
Number
Average Value
LOANS ORIGINATED
9
$63,833
40
$75,712
41
$56,104
41
$12,000
8
$40,781
APPLICATIONS APPROVED, NOT ACCEPTED
1
$48,750
12
$49,688
18
$70,792
8
$21,750
0
$0
APPLICATIONS DENIED
0
$0
26
$48,981
39
$60,385
17
$21,221
5
$35,700
APPLICATIONS WITHDRAWN
1
$48,750
5
$76,650
19
$71,132
2
$16,125
2
$32,250
FILES CLOSED FOR INCOMPLETENESS
1
$48,750
1
$47,250
4
$62,062
0
$0
0
$0
Aggregated Statistics For Year 1999 (Based on 1 partial tract)
A) FHA, FSA/RHS & VA Home Purchase Loans
B) Conventional Home Purchase Loans
C) Refinancings
D) Home Improvement Loans
F) Non-occupant Loans on < 5 Family Dwellings (A B C & D)
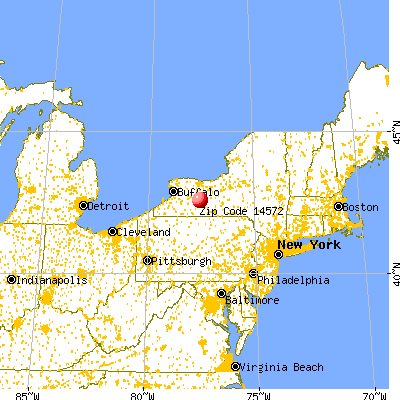


 Nearest zip codes: 14529, 14808, 14826, 14560, 14545, 14437.