Estimated zip code population in 2022: 13,810 Zip code population in 2010: 14,233 Zip code population in 2000: 14,534
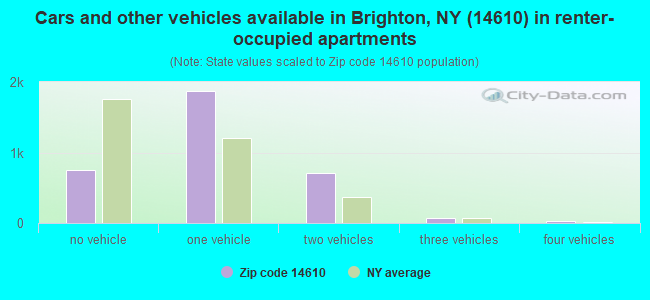
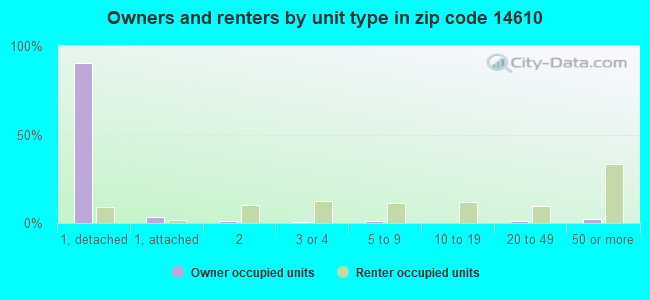
Houses and condos: 7,821 Renter-occupied apartments: 3,411
% of renters here:
46%
State:
46%
March 2022 cost of living index in zip code 14610: 103.0 (near average, U.S. average is 100)
Land area: 4.3 sq. mi. Water area: 0.0 sq. mi.
Population density: 3,185 people per square mile
(average).
OSM Map
General Map
Google Map
MSN Map
OSM Map
General Map
Google Map
MSN Map
OSM Map
General Map
Google Map
MSN Map
OSM Map
General Map
Google Map
MSN Map
Please wait while loading the map...
Real estate property taxes paid for housing units in 2022:
This zip code:
2.7% ($6,290)
New York:
1.5% ($6,180)
Median real estate property taxes paid for housing units with mortgages in 2022: $6,306 (2.9%) Median real estate property taxes paid for housing units with no mortgage in 2022: $6,287 (2.5%)
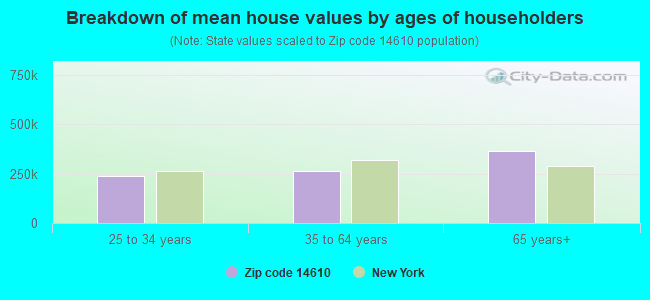
Estimated median house/condo value in 2022: $231,108
14610:
$231,108
New York:
$400,400
According to our research of New York and other state lists, there were 12 registered sex offenders living in 14610 zip code as of April 27, 2024. The ratio of all residents to sex offenders in zip code 14610 is 1,165 to 1. The ratio of registered sex offenders to all residents in this zip code is near the state average.
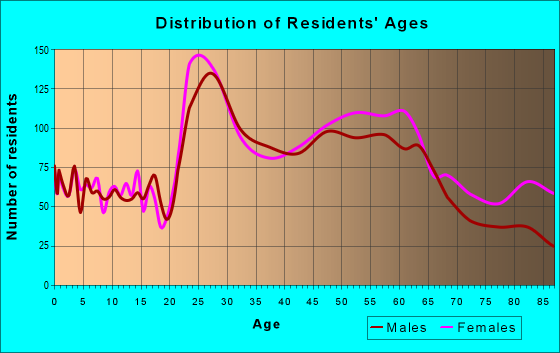
Median resident age:
This zip code:
44.0 years
New York median age:
40.0 years
Average household size:
This zip code:
1.8 people
New York:
2.5 people
Averages for the 2020 tax year for zip code 14610, filed in 2021:
Average Adjusted Gross Income (AGI) in 2020: $106,175 (Individual Income Tax Returns)
Here:
$106,175
State:
$90,930
Salary/wage: $83,111 (reported on 76.3% of returns)
Here:
$83,111
State:
$72,104
(% of AGI for various income ranges: 1086.7% for AGIs below $25k, 3562.2% for AGIs $25k-50k, 6394.8% for AGIs $50k-75k, 9186.7% for AGIs $75k-100k, 17487.9% for AGIs $100k-200k, 109619.5% for AGIs over 200k)
Taxable interest for individuals: $2,729 (reported on 50.5% of returns)
This zip code:
$2,729
New York:
$3,075
(% of AGI for various income ranges: 29.5% for AGIs below $25k, 29.9% for AGIs $25k-50k, 54.5% for AGIs $50k-75k, 122.2% for AGIs $75k-100k, 203.4% for AGIs $100k-200k, 3748.5% for AGIs over 200k)
Ordinary dividends: $12,820 (reported on 35.6% of returns)
Here:
$12,820
State:
$11,095
(% of AGI for various income ranges: 85.1% for AGIs below $25k, 89.5% for AGIs $25k-50k, 186.9% for AGIs $50k-75k, 462.6% for AGIs $75k-100k, 1205.6% for AGIs $100k-200k, 10763.0% for AGIs over 200k)
Net capital gain/loss in AGI: +$26,870 (reported on 31.5% of returns)
Here:
+$26,870
State:
+$44,925
(% of AGI for various income ranges: 36.6% for AGIs below $25k, 64.1% for AGIs $25k-50k, 177.2% for AGIs $50k-75k, 358.5% for AGIs $75k-100k, 1220.2% for AGIs $100k-200k, 26409.0% for AGIs over 200k)
Profit/loss from business: +$26,411 (reported on 16.1% of returns)
Here:
+$26,411
State:
+$14,940
(% of AGI for various income ranges: 98.6% for AGIs below $25k, 144.9% for AGIs $25k-50k, 176.7% for AGIs $50k-75k, 403.7% for AGIs $75k-100k, 1427.5% for AGIs $100k-200k, 8608.5% for AGIs over 200k)
Taxable individual retirement arrangement distribution: $23,051 (reported on 14.6% of returns)
14610:
$23,051
New York:
$19,609
(% of AGI for various income ranges: 108.7% for AGIs below $25k, 190.8% for AGIs $25k-50k, 315.8% for AGIs $50k-75k, 669.3% for AGIs $75k-100k, 1558.7% for AGIs $100k-200k, 3288.5% for AGIs over 200k)
Self-employed (Keogh) retirement plans: $31,541 (reported on 2.2% of returns)
14610:
$31,541
New York:
$32,497
(% of AGI for various income ranges: 36.2% for AGIs $50k-75k, 233.0% for AGIs $100k-200k, 1815.0% for AGIs over 200k)
Total itemized deductions: $39,506 (reported on 12.5% of returns)
Here:
$39,506
State:
$39,326
(% of AGI for various income ranges: 80.6% for AGIs below $25k, 173.5% for AGIs $25k-50k, 315.5% for AGIs $50k-75k, 691.1% for AGIs $75k-100k, 1049.5% for AGIs $100k-200k, 11135.5% for AGIs over 200k)
Charity contributions: $20,206 (reported on 10.6% of returns)
Here:
$20,206
State:
$15,420
(% of AGI for various income ranges: 5.6% for AGIs below $25k, 17.5% for AGIs $25k-50k, 49.4% for AGIs $50k-75k, 127.0% for AGIs $75k-100k, 305.4% for AGIs $100k-200k, 6593.5% for AGIs over 200k)
Taxes paid: $8,529 (reported on 12.5% of returns)
14610:
$8,529
State:
$9,183
(% of AGI for various income ranges: 17.9% for AGIs below $25k, 38.3% for AGIs $25k-50k, 128.4% for AGIs $50k-75k, 264.6% for AGIs $75k-100k, 349.2% for AGIs $100k-200k, 1497.0% for AGIs over 200k)
Earned income credit: $1,546 (reported on 6.8% of returns)
Here:
$1,546
State:
$2,138
(% of AGI for various income ranges: 38.2% for AGIs below $25k, 25.0% for AGIs $25k-50k)
Percentage of individuals using paid preparers for their 2020 taxes: 94.5%
Here:
95%
State:
95%
(% for various income ranges: 91.8% for AGIs below $25k, 93.6% for AGIs $25k-50k, 95.9% for AGIs $50k-75k, 94.7% for AGIs $75k-100k, 96.7% for AGIs $100k-200k, 97.3% for AGIs over 200k)
Averages for the 2012 tax year for zip code 14610, filed in 2013:
Average Adjusted Gross Income (AGI) in 2012: $101,120 (Individual Income Tax Returns)
Here:
$101,120
State:
$77,088
Salary/wage: $70,255 (reported on 77.8% of returns)
Here:
$70,255
State:
$60,593
(% of AGI for various income ranges: 66.4% for AGIs below $25k, 79.0% for AGIs $25k-50k, 71.4% for AGIs $50k-75k, 68.9% for AGIs $75k-100k, 62.8% for AGIs $100k-200k, 40.7% for AGIs over 200k)
Taxable interest for individuals: $4,933 (reported on 55.2% of returns)
This zip code:
$4,933
New York:
$3,125
(% of AGI for various income ranges: 1.9% for AGIs below $25k, 0.8% for AGIs $25k-50k, 0.8% for AGIs $50k-75k, 0.8% for AGIs $75k-100k, 1.3% for AGIs $100k-200k, 4.2% for AGIs over 200k)
Ordinary dividends: $15,647 (reported on 36.6% of returns)
Here:
$15,647
State:
$10,299
(% of AGI for various income ranges: 4.7% for AGIs below $25k, 2.5% for AGIs $25k-50k, 2.6% for AGIs $50k-75k, 2.9% for AGIs $75k-100k, 4.1% for AGIs $100k-200k, 7.7% for AGIs over 200k)
Net capital gain/loss in AGI: +$23,799 (reported on 30.6% of returns)
Here:
+$23,799
State:
+$42,474
(% of AGI for various income ranges: 0.3% for AGIs below $25k, 0.3% for AGIs $25k-50k, 1.0% for AGIs $50k-75k, 2.1% for AGIs $75k-100k, 3.0% for AGIs $100k-200k, 12.2% for AGIs over 200k)
Profit/loss from business: +$27,241 (reported on 15.9% of returns)
Here:
+$27,241
State:
+$16,168
(% of AGI for various income ranges: 6.4% for AGIs below $25k, 3.5% for AGIs $25k-50k, 3.1% for AGIs $50k-75k, 2.9% for AGIs $75k-100k, 5.0% for AGIs $100k-200k, 4.5% for AGIs over 200k)
Taxable individual retirement arrangement distribution: $21,112 (reported on 16.7% of returns)
14610:
$21,112
New York:
$17,621
(% of AGI for various income ranges: 4.8% for AGIs below $25k, 3.5% for AGIs $25k-50k, 4.4% for AGIs $50k-75k, 4.6% for AGIs $75k-100k, 5.6% for AGIs $100k-200k, 2.3% for AGIs over 200k)
Self-employment retirement plans: $23,611 (reported on 2.5% of returns)
14610:
$23,611
New York:
$27,330
(% of AGI for various income ranges: 0.5% for AGIs $50k-75k, 0.7% for AGIs $100k-200k, 0.8% for AGIs over 200k)
Total itemized deductions: $38,231 (20% of AGI, reported on 43.4% of returns)
Here:
$38,231
State:
$34,985
Here:
20.1% of AGI
State:
21.3% of AGI
(% of AGI for various income ranges: 14.8% for AGIs below $25k, 9.7% for AGIs $25k-50k, 14.0% for AGIs $50k-75k, 15.6% for AGIs $75k-100k, 17.7% for AGIs $100k-200k, 17.8% for AGIs over 200k)
Charity contributions: $8,507 (reported on 37.5% of returns)
Here:
$8,507
State:
$5,572
(% of AGI for various income ranges: 1.0% for AGIs below $25k, 1.1% for AGIs $25k-50k, 1.9% for AGIs $50k-75k, 2.0% for AGIs $75k-100k, 2.8% for AGIs $100k-200k, 4.2% for AGIs over 200k)
Taxes paid: $19,201 (reported on 43.3% of returns)
14610:
$19,201
State:
$18,656
(% of AGI for various income ranges: 3.8% for AGIs below $25k, 4.0% for AGIs $25k-50k, 6.3% for AGIs $50k-75k, 7.3% for AGIs $75k-100k, 9.4% for AGIs $100k-200k, 9.3% for AGIs over 200k)
Earned income credit: $1,478 (reported on 8.1% of returns)
Here:
$1,478
State:
$2,230
(% of AGI for various income ranges: 2.4% for AGIs below $25k, 0.4% for AGIs $25k-50k)
Percentage of individuals using paid preparers for their 2012 taxes: 54.5%
Here:
55%
State:
66%
(% for various income ranges: 46.4% for AGIs below $25k, 43.9% for AGIs $25k-50k, 55.1% for AGIs $50k-75k, 64.4% for AGIs $75k-100k, 68.0% for AGIs $100k-200k, 84.5% for AGIs over 200k)
Averages for the 2004 tax year for zip code 14610, filed in 2005:
Average Adjusted Gross Income (AGI) in 2004: $78,910 (Individual Income Tax Returns)
Here:
$78,910
State:
$59,519
Salary/wage: $57,691 (reported on 77.8% of returns)
Here:
$57,691
State:
$50,673
(% of AGI for various income ranges: 4654.1% for AGIs below $10k, 72.1% for AGIs $10k-25k, 79.0% for AGIs $25k-50k, 72.9% for AGIs $50k-75k, 71.7% for AGIs $75k-100k, 45.9% for AGIs over 100k)
Taxable interest for individuals: $3,150 (reported on 66.5% of returns)
This zip code:
$3,150
New York:
$2,377
(% of AGI for various income ranges: 735.8% for AGIs below $10k, 4.3% for AGIs $10k-25k, 1.8% for AGIs $25k-50k, 1.7% for AGIs $50k-75k, 1.3% for AGIs $75k-100k, 2.8% for AGIs over 100k)
Taxable dividends: $7,550 (reported on 44.8% of returns)
Here:
$7,550
State:
$5,394
(% of AGI for various income ranges: 836.7% for AGIs below $10k, 4.2% for AGIs $10k-25k, 2.6% for AGIs $25k-50k, 3.1% for AGIs $50k-75k, 3.4% for AGIs $75k-100k, 4.7% for AGIs over 100k)
Net capital gain/loss: +$23,587 (reported on 36.1% of returns)
Here:
+$23,587
State:
+$23,581
(% of AGI for various income ranges: -59.6% for AGIs below $10k, 1.2% for AGIs $10k-25k, 0.8% for AGIs $25k-50k, 1.8% for AGIs $50k-75k, 1.9% for AGIs $75k-100k, 16.0% for AGIs over 100k)
Profit/loss from business: +$24,923 (reported on 15.6% of returns)
Here:
+$24,923
State:
+$13,809
(% of AGI for various income ranges: 463.3% for AGIs below $10k, 4.1% for AGIs $10k-25k, 2.6% for AGIs $25k-50k, 2.9% for AGIs $50k-75k, 4.0% for AGIs $75k-100k, 5.8% for AGIs over 100k)
IRA payment deduction: $2,866 (reported on 2.8% of returns)
14610:
$2,866
New York:
$3,115
(% of AGI for various income ranges: 0.3% for AGIs $10k-25k, 0.3% for AGIs $25k-50k, 0.2% for AGIs $50k-75k, 0.1% for AGIs $75k-100k, 0.1% for AGIs over 100k)
Self-employed pension: $19,365 (reported on 3.2% of returns)
Here:
$19,365
New York:
$19,016
(% of AGI for various income ranges: 0.2% for AGIs $25k-50k, 0.2% for AGIs $50k-75k, 0.5% for AGIs $75k-100k, 1.1% for AGIs over 100k)
Total itemized deductions: $28,232 (20% of AGI, reported on 45.3% of returns)
Here:
$28,232
State:
$25,864
Here:
19.5% of AGI
State:
21.9% of AGI
(% of AGI for various income ranges: 892.7% for AGIs below $10k, 14.0% for AGIs $10k-25k, 11.8% for AGIs $25k-50k, 16.0% for AGIs $50k-75k, 18.6% for AGIs $75k-100k, 16.6% for AGIs over 100k)
Charity contributions deductions: $7,346 (5% of AGI, reported on 42.1% of returns)
Here:
$7,346
State:
$4,439
Here:
4.8% of AGI
State:
3.6% of AGI
(% of AGI for various income ranges: 58.7% for AGIs below $10k, 1.7% for AGIs $10k-25k, 1.7% for AGIs $25k-50k, 2.6% for AGIs $50k-75k, 3.0% for AGIs $75k-100k, 4.8% for AGIs over 100k)
Total tax: $16,241 (reported on 82.0% of returns)
14610:
$16,241
State:
$11,730
(% of AGI for various income ranges: 121.1% for AGIs below $10k, 4.8% for AGIs $10k-25k, 8.7% for AGIs $25k-50k, 10.6% for AGIs $50k-75k, 11.2% for AGIs $75k-100k, 20.9% for AGIs over 100k)
Earned income credit: $1,172 (reported on 7.1% of returns)
Here:
$1,172
State:
$1,757
Percentage of individuals using paid preparers for their 2004 taxes: 59.9%
Here:
60%
State:
67%
(% for various income ranges: 56.5% for AGIs below $10k, 53.2% for AGIs $10k-25k, 53.9% for AGIs $25k-50k, 60.8% for AGIs $50k-75k, 64.6% for AGIs $75k-100k, 76.8% for AGIs over 100k)
Likely homosexual households (counted as self-reported same-sex unmarried-partner households)
Lesbian couples: 0.1% of all households
Gay men: 0.5% of all households
Household received Food Stamps/SNAP in the past 12 months: 360 Household did not receive Food Stamps/SNAP in the past 12 months: 6,950
Women who had a birth in the past 12 months: 74 (67 now married, 6 unmarried) Women who did not have a birth in the past 12 months: 3,301 (1,195 now married, 2,106 unmarried)
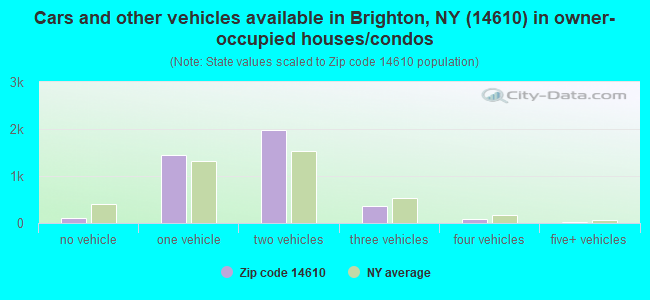
Housing units in zip code 14610 with a mortgage: 2,519 (290 second mortgage, 288 both second mortgage and home equity loan) Houses without a mortgage: 110
Median monthly owner costs for units with a mortgage: $1,625 Median monthly owner costs for units without a mortgage: $901
Residents with income below the poverty level in 2022:
This zip code:
11.2%
Whole state:
14.3%
Residents with income below 50% of the poverty level in 2022:
This zip code:
5.8%
Whole state:
6.8%
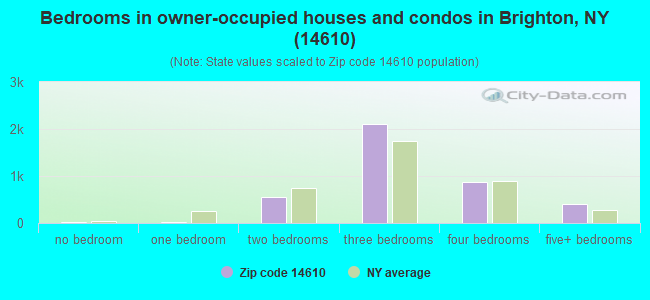
Median number of rooms in houses and condos:
Here:
6.9
State:
6.3
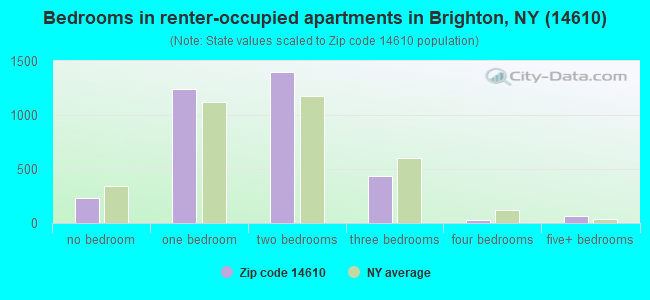
Median number of rooms in apartments:
Here:
4.0
State:
3.8
Notable locations in this zip code not listed on our city pages
Notable locations in zip code 14610: Rochester Country Club (A), Stone Tolan House (B), Brighton Landfill (C), Carlson Park (D), Blossom Health Care Center (E), The Friendly Home (F), WROC - TV 8 (G), Brighton Fire Department Station 3 (H). Display/hide their locations on the map
Churches in zip code 14610 include: Baptist Temple Church (A), Brighton Presbyterian Church (B), Brighton Reformed Church (C), Browncroft Baptist Church (D), Christian Love Bible Church (E), First Unitarian Church of Rochester (F), Peace of Christ Roman Catholic Parish (G), Temple Beth El (H), Trinity Reformed Church (I). Display/hide their locations on the map
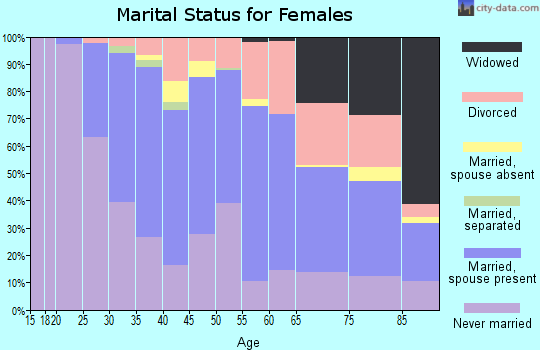
1,497 married couples with children.
306 single-parent households (95 men, 211 women).
92.0% of residents of 14610 zip code speak English at home.
2.2% of residents speak Spanish at home (66% very well, 32% well, 1% not well, 1% not at all).
3.3% of residents speak other Indo-European language at home (54% very well, 16% well, 23% not well, 7% not at all).
1.9% of residents speak Asian or Pacific Island language at home (89% very well, 11% well).
1.0% of residents speak other language at home (89% very well, 9% well, 2% not at all).
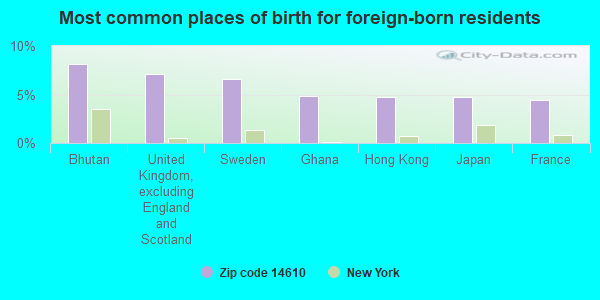
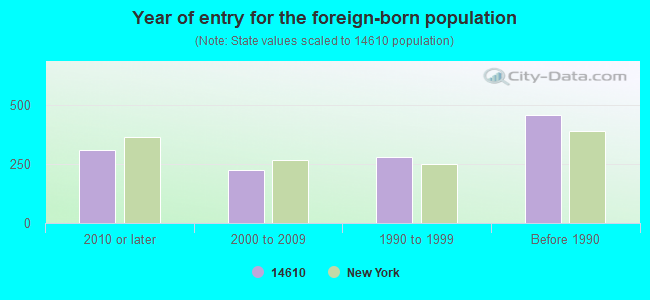
Foreign born population: 1,198 (8.7%) (81.8% of them are naturalized citizens)
Major facilities with environmental interests located in this zip code:
COUNCIL ROCK PRIMARY SCHOOL ( in ROCHESTER, NY)
(National Center for Education Statistics) - STATE ID-260101060001 Organizations: BRIGHTON CSD (SCHOOL DISTRICT)
HARRIS CORP RF COMMUNICATS DIV (1680-1700 UNIVERSITY AVE in ROCHESTER, NY)
HAZARDOUS WASTE BIENNIAL REPORTER (Resource Conservation and Recovery Act (tracking hazardous waste)) Large Quantity Generators, more that 1000 kg of hazardous waste/month (Resource Conservation and Recovery Act (tracking hazardous waste)) - notification Business NAICS classification: ELECTRON TUBE MANUFACTURING. Organizations: 1700 UNIVERSITY INC (CONTACT/OPERATOR)
, 1700 ASSOCIATES (CONTACT/OWNER)
Alternative names: HARRIS CORPORATION
IMPCO INC (100 ROCKWOOD ST in ROCHESTER, NY)
(Resource Conservation and Recovery Act (tracking hazardous waste))
HARRY KINCH SERVICE STATION (1691 EAST AVE in ROCHESTER, NY)
(Resource Conservation and Recovery Act (tracking hazardous waste))
J O COOK INC (I-390 SOUTH MILE #7 in BRIGHTON, NY)
(Resource Conservation and Recovery Act (tracking hazardous waste)) Business NAICS classification: OTHER FUEL DEALERS.
COUNTRY CLUB OF ROCHESTER (2935 EAST AVE in ROCHESTER, NY)
(Resource Conservation and Recovery Act (tracking hazardous waste))
(Resource Conservation and Recovery Act (tracking hazardous waste))
BILL & EARLS GARAGE (235 WINTON RD N in ROCHESTER, NY)
(Resource Conservation and Recovery Act (tracking hazardous waste))
CHERRY DAVID & CHRISTY (300 S WINTON RD in ROCHESTER, NY)
(Resource Conservation and Recovery Act (tracking hazardous waste))
COLBY PARK APARTMENTS THE (1225 PARK AVE in ROCHESTER, NY)
(Resource Conservation and Recovery Act (tracking hazardous waste))
HENRY HUDSON SCHOOL (450 HUMBOLDT ROAD in ROCHESTER, NY)
ENFORCEMENT/COMPLIANCE ACTIVITY (Integrated Compliance Information System) COMPLIANCE ACTIVITY (Tracking inspections of insecticide, fungicide, and rodenticide, and toxic substances)
HOSTMANN STEINBERG INC (146 HALSTEAD ST in ROCHESTER, NY)
Conditionally Exempt Small Quantity Generators, less than 100 kg/month of hazardous waste (Resource Conservation and Recovery Act (tracking hazardous waste)) - notification
AMERADA HESS CORPORATION (1849 EAST AVENUE in ROCHESTER, NY)
Conditionally Exempt Small Quantity Generators, less than 100 kg/month of hazardous waste (Resource Conservation and Recovery Act (tracking hazardous waste)) Alternative names: AMERADA HESS STATION 32355
Housing units lacking complete plumbing facilities: 0.5% Housing units lacking complete kitchen facilities: 1.4%
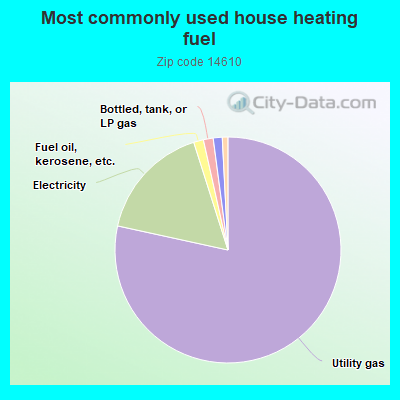
78.5%Utility gas
16.7%Electricity
1.4%Fuel oil, kerosene, etc.
1.4%Bottled, tank, or LP gas
1.3%No fuel used
0.8%Other fuel
Population in 1990: 15,167.
Place of birth for U.S.-born residents:
This state: 9,850
Northeast: 901
Midwest: 681
South: 741
West: 340
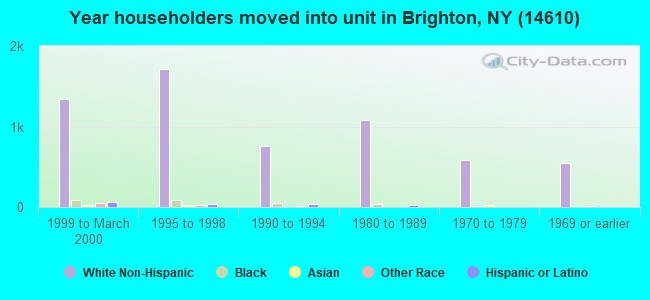
54% of the 14610 zip code residents lived in the same house 5 years ago. Out of people who lived in different houses, 72% lived in this county. Out of people who lived in different counties, 50% lived in New York.
87% of the 14610 zip code residents lived in the same house 1 year ago. Out of people who lived in different houses, 65% moved from this county. Out of people who lived in different houses, 18% moved from different county within same state. Out of people who lived in different houses, 11% moved from different state. Out of people who lived in different houses, 6% moved from abroad.
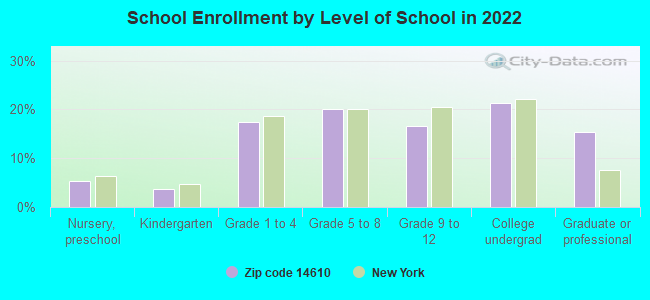
Private vs. public school enrollment:
Students in private schools in grades 1 to 8 (elementary and middle school): 204
Here:
22.8%
New York:
15.6%
Students in private schools in grades 9 to 12 (high school): 101
Here:
25.5%
New York:
15.0%
Students in private undergraduate colleges: 200
Here:
39.2%
New York:
39.2%
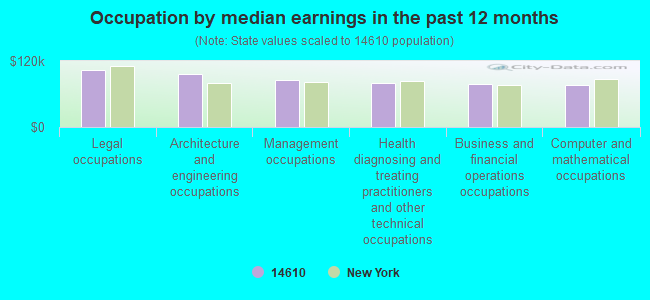
Occupation by median earnings in the past 12 months ($)
103,804Legal occupations
95,518Architecture and engineering occupations
85,518Management occupations
79,484Health diagnosing and treating practitioners and other technical occupations
78,656Business and financial operations occupations
77,133Computer and mathematical occupations
Companies with federal contracts located in this zip code (ROCHESTER, NY):
P & L E-COMMUNICATIONS LLC (131 GOULD ST; small business) : $412,751 in 2 contractsfrom 2005 to 2006
$232,769 with Air Force for Other Defense -- Applied Research and Exploratory Development (R&D). Signed on 2006-06-15. Completion date: 2007-07-20.
$179,982, same as above.Signed on 2005-07-20. Completion date: 2006-07-20.
BEST VOLVO (1500 UNIVERSITY AV.,; small business) : $51,625 in 2 contractsin 2004
$26,125 with National Highway Traffic Safety Administration for Market Research and Public Opinion Services (includes telephone and field interviews, focus testing, and surveys). Taking place in CA. Signed on 2004-01-06. Completion date: 2004-01-16.
$25,500 with National Highway Traffic Safety Administration for Market Research and Public Opinion Services (includes telephone and field interviews, focus testing, and surveys). Signed on 2004-03-30. Completion date: 2004-04-12.
T&C POWER CONVERSION, INC (110 HALSTEAD STREET, #7) : $30,552 in 5 contractsfrom 2005 to 2006
Contracts for Miscellaneous Electrical and Electronic Components, Other Defense -- Applied Research and Exploratory Development (R&D), , Electrical and Electronic Properties Measuring and Testing Instruments, and moreby NASA, Navy, National Institutes of Health, Army, and others Signed by year:2000: $0; 2001: $0; 2002: $0; 2003: $0; 2004: $0; 2005: $20,007; 2006: $10,545.
Biggest contracts:
$10,545 with NASA for Miscellaneous Electrical and Electronic Components. Signed on 2006-02-08. Completion date: 2006-03-31.
$6,707 with Navy for Other Defense -- Applied Research and Exploratory Development (R&D). Signed on 2005-08-10. Completion date: 2005-08-19.
$6,605 with National Institutes of Health for . Taking place in MD. Signed on 2005-08-18. Completion date: 2005-08-22.
$5,695 with Army for Electrical and Electronic Properties Measuring and Testing Instruments. Signed on 2005-08-17. Completion date: 2005-10-05.
NEXT CENTURY SYSTEMS INC (90 HOLLOWAY RD; small business)
$6,165 with Air Force for Telephone and Telegraph Equipment. Signed on 2004-09-27. Completion date: 2004-10-01.
MACHINE TOOL RESEARCH, INC (405 BLOSSOM RD; small business) : -$47,840 in 9 contractsfrom 2001 to 2005
Contracts for Engineering and Technical Services, Maintenance, Repair and Rebuilding of Equipment -- Maintenance and Repair Shop Equipment, Lathes, Miscellaneous Secondary Metal Forming and Cutting Machines, and moreby Defense Logistics Agency, Army, Navy Signed by year:2000: $0; 2001: -$268,630; 2002: $0; 2003: $0; 2004: $82,279; 2005: $138,511; 2006: $0.
Biggest contracts:
$67,370 with Defense Logistics Agency for Engineering and Technical Services. Signed on 2001-07-31. Completion date: 2001-12-03.
$66,769 with Army for Maintenance, Repair and Rebuilding of Equipment -- Maintenance and Repair Shop Equipment. Taking place in PA. Signed on 2005-07-06. Completion date: 2005-07-31.
$65,645, same as above.Signed on 2004-07-29. Completion date: 2005-07-31.
$35,800 with Defense Logistics Agency for Lathes. Signed on 2005-02-17. Completion date: 2005-03-31.
Top industries in this zip code by the number of employees in 2005:
Administrative and Support and Waste Management and Remediation Services: Professional Employer Organizations (100-249 employees: 1 establishment, 20-49 employees: 2 establishments)
Arts, Entertainment, and Recreation: Fitness and Recreational Sports Centers (100-249: 1, 20-49: 1, 1-4: 2)
2004 - 2018 National Fire Incident Reporting System (NFIRS) incidents
Based on the data from the years 2004 - 2018 the average number of fires per year is 35. The highest number of fires - 60 took place in 2012, and the least - 14 in 2004. The data has a rising trend.
When looking into fire subcategories, the most incidents belonged to: Structure Fires (42.8%), and Outside Fires (38.1%).
Fire incident types reported to NFIRS in Zip Code 14610


 Nearest zip codes: 14618, 14609, 14625, 14607, 14604, 14620.
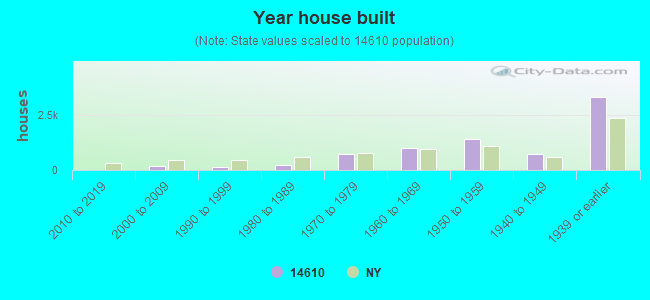


 Based on the data from the years 2004 - 2018 the average number of fires per year is 35. The highest number of fires - 60 took place in 2012, and the least - 14 in 2004. The data has a rising trend.
 When looking into fire subcategories, the most incidents belonged to: Structure Fires (42.8%), and Outside Fires (38.1%).