Estimated zip code population in 2022: 3,075 Zip code population in 2010: 3,540 Zip code population in 2000: 3,961
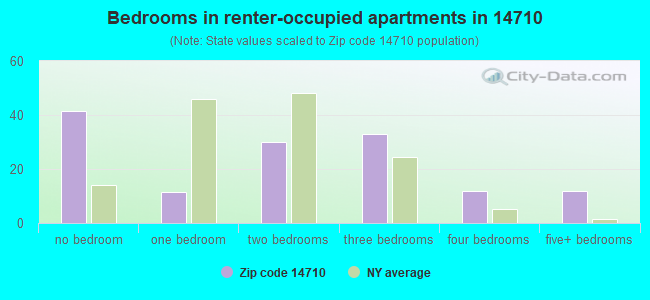
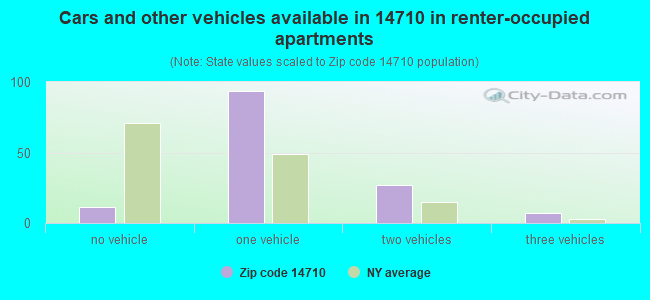
Houses and condos: 2,186 Renter-occupied apartments: 137
% of renters here:
10%
State:
46%
March 2022 cost of living index in zip code 14710: 93.3 (less than average, U.S. average is 100)
Land area: 48.4 sq. mi. Water area: 0.1 sq. mi.
Population density: 64 people per square mile
(very low).
OSM Map
General Map
Google Map
MSN Map
OSM Map
General Map
Google Map
MSN Map
OSM Map
General Map
Google Map
MSN Map
OSM Map
General Map
Google Map
MSN Map
Please wait while loading the map...
Real estate property taxes paid for housing units in 2022:
This zip code:
1.8% ($2,610)
New York:
1.5% ($6,180)
Median real estate property taxes paid for housing units with mortgages in 2022: $2,825 (1.7%) Median real estate property taxes paid for housing units with no mortgage in 2022: $2,289 (2.3%)
Estimated median house/condo value in 2022: $143,544
14710:
$143,544
New York:
$400,400
According to our research of New York and other state lists, there was 1 registered sex offender living in 14710 zip code as of April 27, 2024. The ratio of all residents to sex offenders in zip code 14710 is 3,283 to 1. The ratio of registered sex offenders to all residents in this zip code is much lower than the state average.
Median resident age:
This zip code:
46.3 years
New York median age:
40.0 years
Average household size:
This zip code:
2.3 people
New York:
2.5 people
Averages for the 2020 tax year for zip code 14710, filed in 2021:
Average Adjusted Gross Income (AGI) in 2020: $58,348 (Individual Income Tax Returns)
Here:
$58,348
State:
$90,930
Salary/wage: $49,746 (reported on 77.5% of returns)
Here:
$49,746
State:
$72,104
(% of AGI for various income ranges: 1039.7% for AGIs below $25k, 3216.6% for AGIs $25k-50k, 5560.5% for AGIs $50k-75k, 8423.1% for AGIs $75k-100k, 13379.3% for AGIs $100k-200k)
Taxable interest for individuals: $751 (reported on 36.9% of returns)
This zip code:
$751
New York:
$3,075
(% of AGI for various income ranges: 17.1% for AGIs below $25k, 22.2% for AGIs $25k-50k, 20.5% for AGIs $50k-75k, 76.9% for AGIs $75k-100k, 102.1% for AGIs $100k-200k)
Ordinary dividends: $4,812 (reported on 20.6% of returns)
Here:
$4,812
State:
$11,095
(% of AGI for various income ranges: 23.4% for AGIs below $25k, 26.2% for AGIs $25k-50k, 93.2% for AGIs $50k-75k, 296.9% for AGIs $75k-100k, 396.4% for AGIs $100k-200k)
Net capital gain/loss in AGI: +$8,681 (reported on 16.2% of returns)
Here:
+$8,681
State:
+$44,925
(% of AGI for various income ranges: 8.6% for AGIs below $25k, 26.9% for AGIs $25k-50k, 73.7% for AGIs $50k-75k, 200.8% for AGIs $75k-100k, 610.7% for AGIs $100k-200k)
Profit/loss from business: +$9,959 (reported on 13.8% of returns)
Here:
+$9,959
State:
+$14,940
(% of AGI for various income ranges: 64.9% for AGIs below $25k, 200.9% for AGIs $25k-50k, 140.0% for AGIs $50k-75k, 213.1% for AGIs $75k-100k, 555.7% for AGIs $100k-200k)
Taxable individual retirement arrangement distribution: $15,690 (reported on 13.1% of returns)
14710:
$15,690
New York:
$19,609
(% of AGI for various income ranges: 123.7% for AGIs below $25k, 133.1% for AGIs $25k-50k, 291.6% for AGIs $50k-75k, 530.0% for AGIs $75k-100k, 852.1% for AGIs $100k-200k)
Total itemized deductions: $32,543 (reported on 4.4% of returns)
Here:
$32,543
State:
$39,326
(% of AGI for various income ranges: 438.4% for AGIs $50k-75k, 1032.1% for AGIs $100k-200k)
Charity contributions: $11,260 (reported on 3.1% of returns)
Here:
$11,260
State:
$15,420
(% of AGI for various income ranges: 59.7% for AGIs $25k-50k, 265.7% for AGIs $100k-200k)
Taxes paid: $7,414 (reported on 4.4% of returns)
14710:
$7,414
State:
$9,183
(% of AGI for various income ranges: 98.9% for AGIs $50k-75k, 236.4% for AGIs $100k-200k)
Earned income credit: $2,014 (reported on 13.1% of returns)
Here:
$2,014
State:
$2,138
(% of AGI for various income ranges: 68.3% for AGIs below $25k, 57.5% for AGIs $25k-50k)
Percentage of individuals using paid preparers for their 2020 taxes: 95.0%
Here:
95%
State:
95%
(% for various income ranges: 92.2% for AGIs below $25k, 95.1% for AGIs $25k-50k, 95.8% for AGIs $50k-75k, 100.0% for AGIs $75k-100k, 95.5% for AGIs $100k-200k, 100.0% for AGIs over 200k)
Averages for the 2012 tax year for zip code 14710, filed in 2013:
Average Adjusted Gross Income (AGI) in 2012: $49,551 (Individual Income Tax Returns)
Here:
$49,551
State:
$77,088
Salary/wage: $40,597 (reported on 82.3% of returns)
Here:
$40,597
State:
$60,593
(% of AGI for various income ranges: 72.9% for AGIs below $25k, 72.7% for AGIs $25k-50k, 77.2% for AGIs $50k-75k, 72.1% for AGIs $75k-100k, 56.4% for AGIs $100k-200k)
Taxable interest for individuals: $873 (reported on 40.9% of returns)
This zip code:
$873
New York:
$3,125
(% of AGI for various income ranges: 0.8% for AGIs below $25k, 0.7% for AGIs $25k-50k, 0.5% for AGIs $50k-75k, 1.0% for AGIs $75k-100k, 0.7% for AGIs $100k-200k)
Ordinary dividends: $3,454 (reported on 21.3% of returns)
Here:
$3,454
State:
$10,299
(% of AGI for various income ranges: 1.2% for AGIs below $25k, 0.8% for AGIs $25k-50k, 0.7% for AGIs $50k-75k, 1.0% for AGIs $75k-100k, 2.5% for AGIs $100k-200k)
Net capital gain/loss in AGI: +$12,112 (reported on 14.6% of returns)
Here:
+$12,112
State:
+$42,474
(% of AGI for various income ranges: 1.2% for AGIs $25k-50k, 1.0% for AGIs $75k-100k, 8.7% for AGIs $100k-200k)
Profit/loss from business: +$8,138 (reported on 15.9% of returns)
Here:
+$8,138
State:
+$16,168
(% of AGI for various income ranges: 8.0% for AGIs below $25k, 3.3% for AGIs $25k-50k, 0.9% for AGIs $50k-75k, 2.1% for AGIs $75k-100k, 2.0% for AGIs $100k-200k)
Taxable individual retirement arrangement distribution: $12,126 (reported on 11.6% of returns)
14710:
$12,126
New York:
$17,621
(% of AGI for various income ranges: 4.2% for AGIs below $25k, 3.5% for AGIs $25k-50k, 2.9% for AGIs $50k-75k, 2.3% for AGIs $75k-100k, 2.3% for AGIs $100k-200k)
Total itemized deductions: $21,132 (20% of AGI, reported on 23.2% of returns)
Here:
$21,132
State:
$34,985
Here:
20.3% of AGI
State:
21.3% of AGI
(% of AGI for various income ranges: 6.5% for AGIs below $25k, 7.3% for AGIs $25k-50k, 8.2% for AGIs $50k-75k, 8.9% for AGIs $75k-100k, 13.3% for AGIs $100k-200k)
Charity contributions: $3,558 (reported on 18.9% of returns)
Here:
$3,558
State:
$5,572
(% of AGI for various income ranges: 1.1% for AGIs below $25k, 0.8% for AGIs $25k-50k, 1.1% for AGIs $50k-75k, 1.6% for AGIs $75k-100k, 1.7% for AGIs $100k-200k)
Taxes paid: $10,024 (reported on 23.2% of returns)
14710:
$10,024
State:
$18,656
(% of AGI for various income ranges: 1.8% for AGIs below $25k, 2.2% for AGIs $25k-50k, 3.4% for AGIs $50k-75k, 3.9% for AGIs $75k-100k, 7.6% for AGIs $100k-200k)
Earned income credit: $2,039 (reported on 17.1% of returns)
Here:
$2,039
State:
$2,230
(% of AGI for various income ranges: 5.3% for AGIs below $25k, 1.1% for AGIs $25k-50k)
Percentage of individuals using paid preparers for their 2012 taxes: 54.3%
Here:
54%
State:
66%
(% for various income ranges: 49.3% for AGIs below $25k, 57.9% for AGIs $25k-50k, 55.6% for AGIs $50k-75k, 53.3% for AGIs $75k-100k, 64.7% for AGIs $100k-200k)
Averages for the 2004 tax year for zip code 14710, filed in 2005:
Average Adjusted Gross Income (AGI) in 2004: $37,000 (Individual Income Tax Returns)
Here:
$37,000
State:
$59,519
Salary/wage: $33,268 (reported on 85.5% of returns)
Here:
$33,268
State:
$50,673
(% of AGI for various income ranges: 89.2% for AGIs below $10k, 77.7% for AGIs $10k-25k, 80.3% for AGIs $25k-50k, 81.4% for AGIs $50k-75k, 78.0% for AGIs $75k-100k, 64.9% for AGIs over 100k)
Taxable interest for individuals: $949 (reported on 53.5% of returns)
This zip code:
$949
New York:
$2,377
(% of AGI for various income ranges: 3.6% for AGIs below $10k, 1.2% for AGIs $10k-25k, 1.5% for AGIs $25k-50k, 1.1% for AGIs $50k-75k, 1.2% for AGIs $75k-100k, 1.5% for AGIs over 100k)
Taxable dividends: $1,500 (reported on 25.3% of returns)
Here:
$1,500
State:
$5,394
(% of AGI for various income ranges: 3.5% for AGIs below $10k, 1.2% for AGIs $10k-25k, 0.7% for AGIs $25k-50k, 0.7% for AGIs $50k-75k, 0.9% for AGIs $75k-100k, 1.5% for AGIs over 100k)
Net capital gain/loss: +$4,343 (reported on 19.5% of returns)
Here:
+$4,343
State:
+$23,581
(% of AGI for various income ranges: 0.1% for AGIs below $10k, 0.9% for AGIs $10k-25k, 0.8% for AGIs $25k-50k, 0.8% for AGIs $50k-75k, 4.5% for AGIs $75k-100k, 5.4% for AGIs over 100k)
Profit/loss from business: +$6,783 (reported on 17.0% of returns)
Here:
+$6,783
State:
+$13,809
(% of AGI for various income ranges: 1.7% for AGIs below $10k, 4.7% for AGIs $10k-25k, 2.5% for AGIs $25k-50k, 0.9% for AGIs $50k-75k, 3.2% for AGIs $75k-100k, 5.6% for AGIs over 100k)
IRA payment deduction: $2,912 (reported on 3.4% of returns)
14710:
$2,912
New York:
$3,115
Total itemized deductions: $16,157 (21% of AGI, reported on 21.7% of returns)
Here:
$16,157
State:
$25,864
Here:
21.3% of AGI
State:
21.9% of AGI
(% of AGI for various income ranges: 5.8% for AGIs $10k-25k, 6.7% for AGIs $25k-50k, 10.6% for AGIs $50k-75k, 12.1% for AGIs $75k-100k, 13.2% for AGIs over 100k)
Charity contributions deductions: $2,894 (4% of AGI, reported on 18.6% of returns)
Here:
$2,894
State:
$4,439
Here:
3.6% of AGI
State:
3.6% of AGI
(% of AGI for various income ranges: 0.6% for AGIs $10k-25k, 0.9% for AGIs $25k-50k, 1.7% for AGIs $50k-75k, 2.1% for AGIs $75k-100k, 2.1% for AGIs over 100k)
Total tax: $4,728 (reported on 74.0% of returns)
14710:
$4,728
State:
$11,730
(% of AGI for various income ranges: 2.3% for AGIs below $10k, 4.1% for AGIs $10k-25k, 6.4% for AGIs $25k-50k, 8.4% for AGIs $50k-75k, 9.9% for AGIs $75k-100k, 18.4% for AGIs over 100k)
Earned income credit: $1,523 (reported on 17.1% of returns)
Here:
$1,523
State:
$1,757
Percentage of individuals using paid preparers for their 2004 taxes: 57.5%
Here:
58%
State:
67%
(% for various income ranges: 47.8% for AGIs below $10k, 54.4% for AGIs $10k-25k, 61.2% for AGIs $25k-50k, 64.3% for AGIs $50k-75k, 67.9% for AGIs $75k-100k, 65.4% for AGIs over 100k)
Likely homosexual households (counted as self-reported same-sex unmarried-partner households)
Lesbian couples: 0.0% of all households
Gay men: 0.5% of all households
Household received Food Stamps/SNAP in the past 12 months: 130 Household did not receive Food Stamps/SNAP in the past 12 months: 1,183
Women who had a birth in the past 12 months: 21 (21 now married, 0 unmarried) Women who did not have a birth in the past 12 months: 511 (220 now married, 289 unmarried)
Housing units in zip code 14710 with a mortgage: 635 (56 second mortgage, 57 both second mortgage and home equity loan) Houses without a mortgage: 40
Median monthly owner costs for units with a mortgage: $1,149 Median monthly owner costs for units without a mortgage: $435
Residents with income below the poverty level in 2022:
This zip code:
14.2%
Whole state:
14.3%
Residents with income below 50% of the poverty level in 2022:
This zip code:
8.9%
Whole state:
6.8%
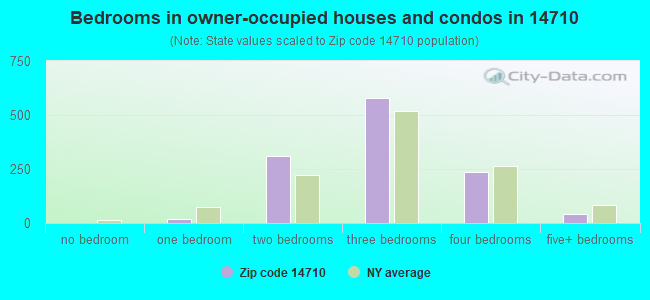
Median number of rooms in houses and condos:
Here:
6.7
State:
6.3
Median number of rooms in apartments:
Here:
4.8
State:
3.8
Notable locations in this zip code not listed on our city pages
Notable locations in zip code 14710: Johnson Farms (A), Ashville Fire Department (B), Ashville Free Library (C), North Harmony Town Hall (D), Ashville Fire District Station (E). Display/hide their locations on the map
Churches in zip code 14710 include: Blockville United Methodist Church (A), Ashville Methodist Church (B), Wesleyan Methodist Church (C), Open Meadows Church (D). Display/hide their locations on the map
Cemeteries: Gardner Cemetery (1), Wellman Road Cemetery (2), Open Meadows Cemetery (3), Blockville Union Burying Ground (4), Wild Rose Cemetery (5), Maple Grove Cemetery (6). Display/hide their locations on the map
Size of family households: 460 2-persons, 157 3-persons, 101 4-persons, 65 5-persons, 22 6-persons, 23 7-or-more-persons
Size of nonfamily households: 409 1-person, 88 2-persons
525 married couples with children.
115 single-parent households (55 men, 60 women).
95.6% of residents of 14710 zip code speak English at home.
0.6% of residents speak Spanish at home (79% well, 21% not well).
4.2% of residents speak other Indo-European language at home (7% very well, 34% well, 30% not well, 30% not at all).
0.2% of residents speak Asian or Pacific Island language at home (100% very well).
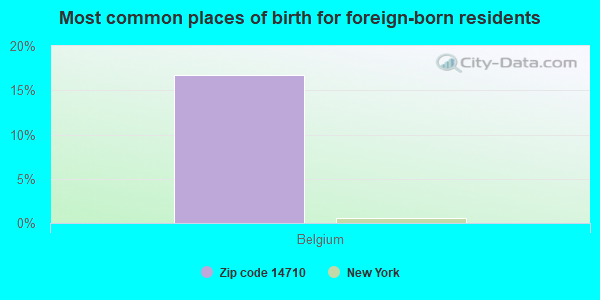
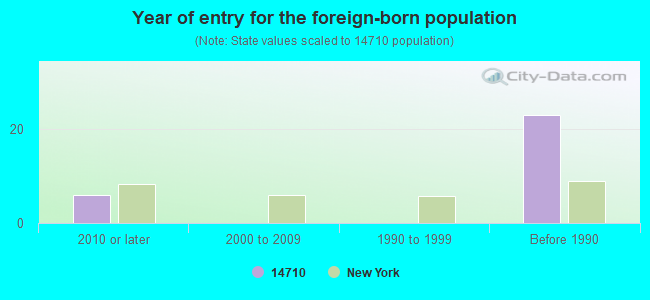
Foreign born population: 25 (0.8%) (100.0% of them are naturalized citizens)
This zip code:
0.8%
Whole state:
22.7%
17%Belgium
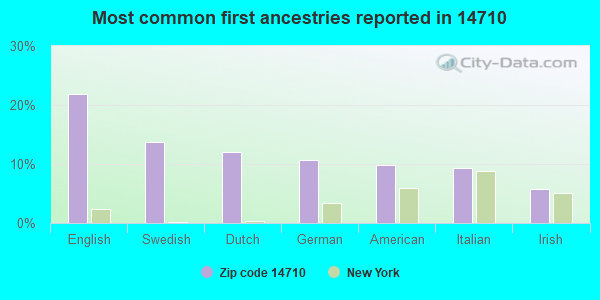
22%English
14%Swedish
12%Dutch
11%German
10%American
9%Italian
6%Irish
Year of entry for the foreign-born population
62010 or later
02000 to 2009
01990 to 1999
23Before 1990
Facilities with environmental interests located in this zip code:
AGWAY ENERGY PRODUCTS (15 E MAIN ST RTE 474 in ASHVILLE, NY)
Conditionally Exempt Small Quantity Generators, less than 100 kg/month of hazardous waste (Resource Conservation and Recovery Act (tracking hazardous waste)) - notification Organizations: AGWAY PETROLEUM CORP (CONTACT/OWNER)
GOOSE CREEK RESTORATION (1 S MAPLE ST in ASHVILLE, NY)
Conditionally Exempt Small Quantity Generators, less than 100 kg/month of hazardous waste (Resource Conservation and Recovery Act (tracking hazardous waste)) - notification
Housing units lacking complete plumbing facilities: 3.6% Housing units lacking complete kitchen facilities: 3.6%
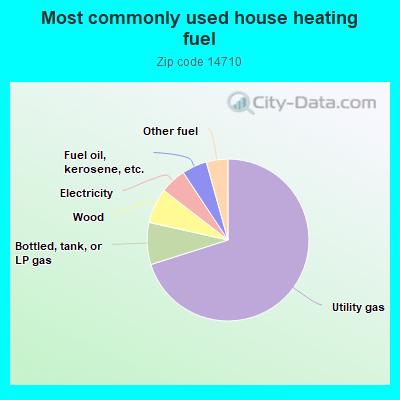
70.1%Utility gas
8.4%Bottled, tank, or LP gas
7.0%Wood
5.2%Electricity
5.0%Fuel oil, kerosene, etc.
4.3%Other fuel
Population in 1990: 2,450. Population change in the 1990s: +1,511 (+61.7%).
Place of birth for U.S.-born residents:
This state: 2,281
Northeast: 462
Midwest: 176
South: 73
West: 49
68% of the 14710 zip code residents lived in the same house 5 years ago. Out of people who lived in different houses, 81% lived in this county. Out of people who lived in different counties, 50% lived in New York.
96% of the 14710 zip code residents lived in the same house 1 year ago. Out of people who lived in different houses, 44% moved from this county. Out of people who lived in different houses, 7% moved from different county within same state. Out of people who lived in different houses, 49% moved from different state.
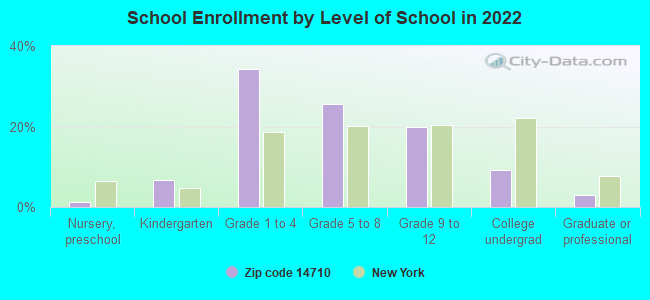
Private vs. public school enrollment:
Students in private schools in grades 1 to 8 (elementary and middle school): 24
Here:
5.7%
New York:
15.6%
Students in private schools in grades 9 to 12 (high school): 13
Here:
9.4%
New York:
15.0%
Students in private undergraduate colleges: 35
Here:
54.0%
New York:
39.2%
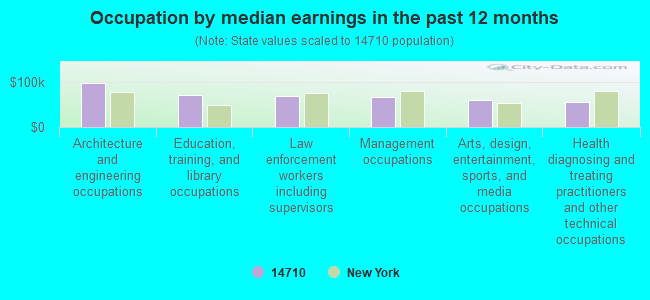
Occupation by median earnings in the past 12 months ($)
97,383Architecture and engineering occupations
71,545Education, training, and library occupations
68,426Law enforcement workers including supervisors
66,678Management occupations
59,556Arts, design, entertainment, sports, and media occupations
54,478Health diagnosing and treating practitioners and other technical occupations
Companies with federal contracts located in this zip code:
DIVERSIFIED COMPONENTS, INC (1287 HUNT RD in ASHVILLE, NY; small business) : $83,501 in 6 contractsfrom 2004 to 2005
Contracts for Guns, through 30 mm, Hose, Pipe, Tube, Lubrication, and Railing Fittings by Defense Logistics Agency Signed by year:2000: $0; 2001: $0; 2002: $0; 2003: $0; 2004: $39,045; 2005: $44,456; 2006: $0.
Biggest contracts:
$27,172 with Defense Logistics Agency for Guns, through 30 mm. Signed on 2004-09-16. Completion date: 2004-12-16.
$21,049 with Defense Logistics Agency for Hose, Pipe, Tube, Lubrication, and Railing Fittings. Signed on 2005-01-27. Completion date: 2005-03-01.
$13,460, same as above.Signed on 2005-09-16. Completion date: 2005-10-19.
$11,873, same as above.Signed on 2004-11-03. Completion date: 2004-11-22.
CHAUTAUQUA CHEMICALS CO, INC (4743 CRAMER DR in ASHVILLE, NY; small business)
$21,720 with Army for Clean Work Stations, Controlled Environment and Related Equipment. Signed on 2005-08-11. Completion date: 2005-09-29.
Top industries in this zip code by the number of employees in 2005:
Wholesale Trade: Other Chemical and Allied Products Merchant Wholesalers (20-49 employees: 1 establishment, 5-9 employees: 1 establishment)
Professional, Scientific, and Technical Services: Engineering Services (10-19: 1)
Construction: Plumbing, Heating, and Air-Conditioning Contractors (5-9: 1, 1-4: 2)
Administrative and Support and Waste Management and Remediation Services: Janitorial Services (5-9: 1, 1-4: 1)
Construction: Other Building Equipment Contractors (5-9: 1)
Fatal accident statistics in 2012:
Fatal accident count: 1
Vehicles involved in fatal accidents: 1
Fatal accidents caused by drunken drivers: 0
Fatalities: 1
Persons involved in fatal accidents: 1
Pedestrians involved in fatal accidents: 0
Home Mortgage Disclosure Act Aggregated Statistics For Year 2003 (Based on 6 partial tracts)
A) FHA, FSA/RHS & VA Home Purchase Loans
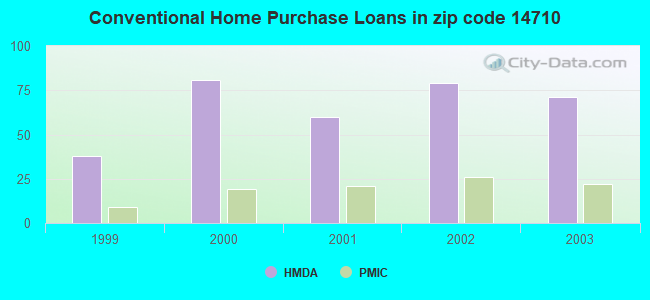
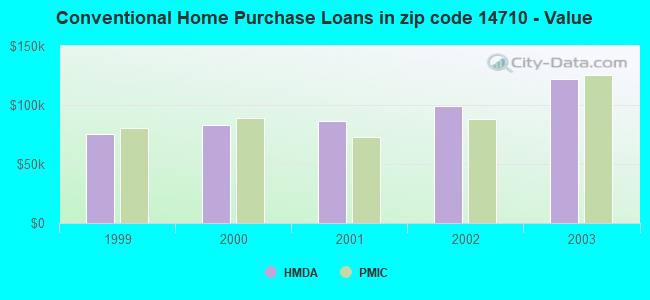
B) Conventional Home Purchase Loans
C) Refinancings
D) Home Improvement Loans
F) Non-occupant Loans on < 5 Family Dwellings (A B C & D)
Number
Average Value
Number
Average Value
Number
Average Value
Number
Average Value
Number
Average Value
LOANS ORIGINATED
7
$81,589
71
$121,855
199
$91,463
34
$14,766
44
$149,487
APPLICATIONS APPROVED, NOT ACCEPTED
1
$49,160
9
$45,377
18
$135,978
2
$36,430
6
$115,308
APPLICATIONS DENIED
1
$33,290
11
$81,628
89
$79,637
16
$14,085
7
$117,781
APPLICATIONS WITHDRAWN
0
$0
6
$103,240
78
$91,359
5
$114,378
7
$153,557
FILES CLOSED FOR INCOMPLETENESS
0
$0
3
$38,380
8
$115,224
0
$0
0
$0
Aggregated Statistics For Year 2002 (Based on 6 partial tracts)
A) FHA, FSA/RHS & VA Home Purchase Loans
B) Conventional Home Purchase Loans
C) Refinancings
D) Home Improvement Loans
F) Non-occupant Loans on < 5 Family Dwellings (A B C & D)
Number
Average Value
Number
Average Value
Number
Average Value
Number
Average Value
Number
Average Value
LOANS ORIGINATED
18
$68,778
79
$99,118
131
$82,182
30
$19,184
36
$111,922
APPLICATIONS APPROVED, NOT ACCEPTED
1
$42,150
5
$80,132
29
$73,984
2
$35,220
4
$113,142
APPLICATIONS DENIED
1
$101,330
11
$56,565
104
$72,666
15
$14,827
4
$153,802
APPLICATIONS WITHDRAWN
0
$0
6
$121,943
93
$80,693
9
$76,599
2
$265,125
FILES CLOSED FOR INCOMPLETENESS
0
$0
1
$91,820
14
$71,465
0
$0
4
$108,968
Aggregated Statistics For Year 2001 (Based on 6 partial tracts)
A) FHA, FSA/RHS & VA Home Purchase Loans
B) Conventional Home Purchase Loans
C) Refinancings
D) Home Improvement Loans
F) Non-occupant Loans on < 5 Family Dwellings (A B C & D)
Number
Average Value
Number
Average Value
Number
Average Value
Number
Average Value
Number
Average Value
LOANS ORIGINATED
12
$65,962
60
$86,104
117
$78,476
43
$14,008
25
$110,433
APPLICATIONS APPROVED, NOT ACCEPTED
2
$50,885
8
$68,001
21
$68,593
3
$23,310
2
$186,825
APPLICATIONS DENIED
0
$0
13
$47,160
92
$58,670
10
$19,159
2
$58,835
APPLICATIONS WITHDRAWN
0
$0
4
$87,415
69
$72,069
6
$41,600
1
$16,620
FILES CLOSED FOR INCOMPLETENESS
0
$0
0
$0
9
$61,426
0
$0
0
$0
Aggregated Statistics For Year 2000 (Based on 6 partial tracts)
A) FHA, FSA/RHS & VA Home Purchase Loans
B) Conventional Home Purchase Loans
C) Refinancings
D) Home Improvement Loans
F) Non-occupant Loans on < 5 Family Dwellings (A B C & D)
Number
Average Value
Number
Average Value
Number
Average Value
Number
Average Value
Number
Average Value
LOANS ORIGINATED
17
$55,382
81
$82,910
49
$65,930
39
$18,396
14
$109,336
APPLICATIONS APPROVED, NOT ACCEPTED
0
$0
9
$59,073
14
$41,655
10
$19,700
1
$105,630
APPLICATIONS DENIED
2
$52,890
29
$41,601
57
$45,316
22
$19,083
1
$17,330
APPLICATIONS WITHDRAWN
1
$39,060
5
$91,616
29
$50,991
1
$6,450
2
$134,735
FILES CLOSED FOR INCOMPLETENESS
0
$0
0
$0
5
$42,320
0
$0
0
$0
Aggregated Statistics For Year 1999 (Based on 3 partial tracts)
A) FHA, FSA/RHS & VA Home Purchase Loans
B) Conventional Home Purchase Loans
C) Refinancings
D) Home Improvement Loans
F) Non-occupant Loans on < 5 Family Dwellings (A B C & D)

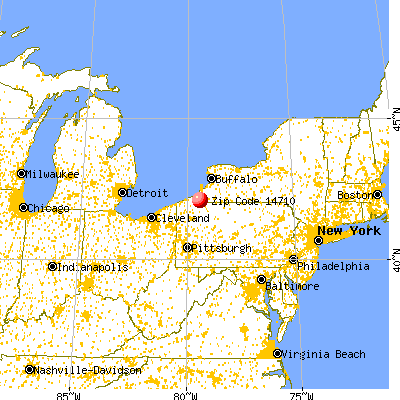


 Nearest zip codes: 14750, 14767, 14756, 14712, 14742, 14722.