Estimated zip code population in 2022: 1,051 Zip code population in 2010: 1,128 Zip code population in 2000: 1,053
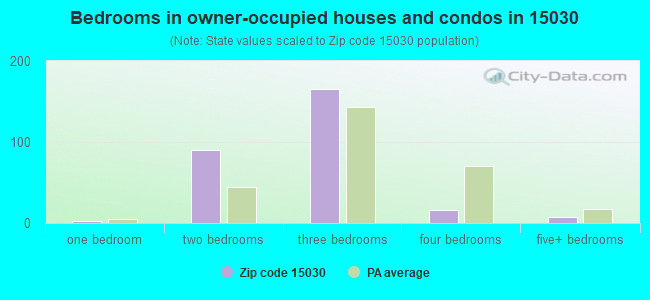
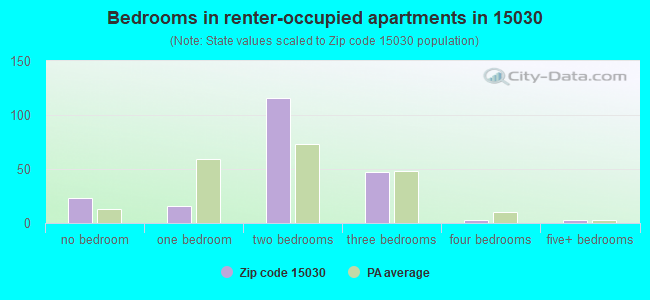
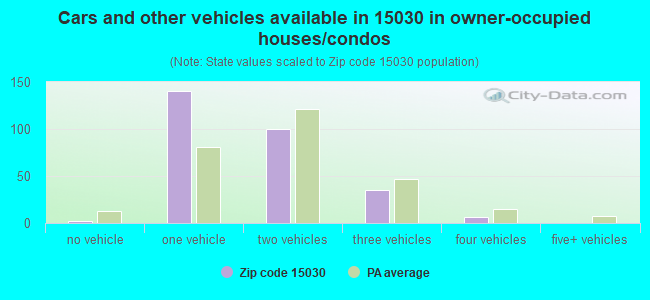
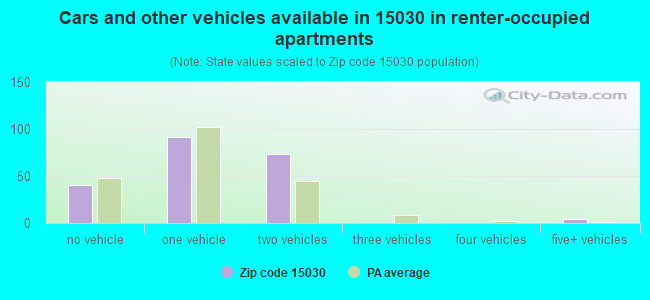
Houses and condos: 602 Renter-occupied apartments: 206
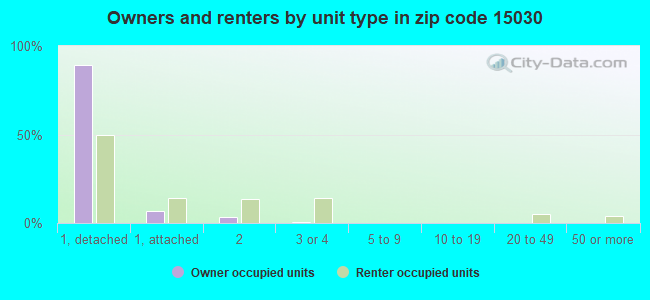
% of renters here:
42%
State:
31%
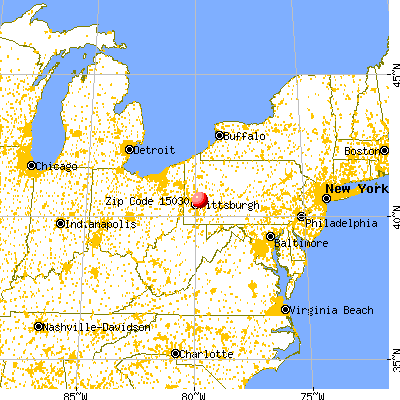
March 2022 cost of living index in zip code 15030: 92.3 (less than average, U.S. average is 100)
Land area: 1.9 sq. mi. Water area: 0.3 sq. mi.
Population density: 559 people per square mile
(low).
OSM Map
General Map
Google Map
MSN Map
OSM Map
General Map
Google Map
MSN Map
OSM Map
General Map
Google Map
MSN Map
OSM Map
General Map
Google Map
MSN Map
Please wait while loading the map...
Real estate property taxes paid for housing units in 2022:
This zip code:
1.2% ($1,183)
Pennsylvania:
1.3% ($3,094)
Median real estate property taxes paid for housing units with mortgages in 2022: $1,630 (1.6%) Median real estate property taxes paid for housing units with no mortgage in 2022: $769 (0.9%)
Business Search- 14 Million verified businesses
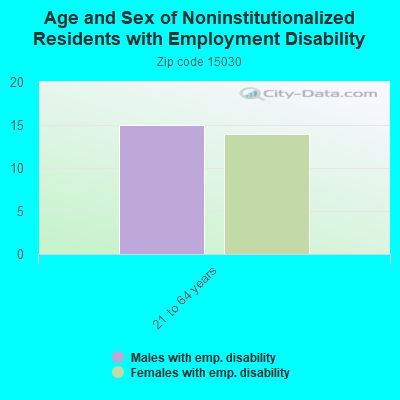
Males: 456
(43.4%)
Females: 595
(56.6%)
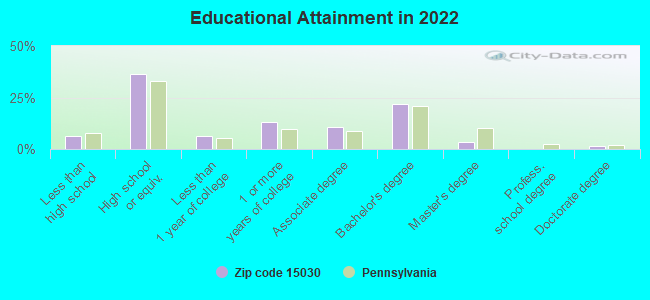
For population 25 years and over in 15030:
High school or higher: 92.9%
Bachelor's degree or higher: 26.4%
Graduate or professional degree: 5.0%
Unemployed: 2.0%
Mean travel time to work (commute): 22.4 minutes
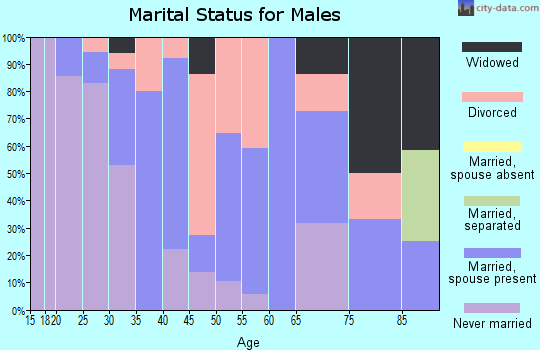
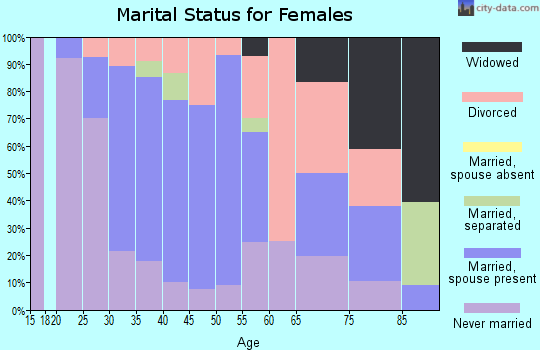
For population 15 years and over in 15030:
Never married: 34.6%
Now married: 38.4%
Separated: 2.5%
Widowed: 12.4%
Divorced: 12.1%
Zip code 15030 compared to state average:
Median house value significantly below state average.
Unemployed percentage below state average.
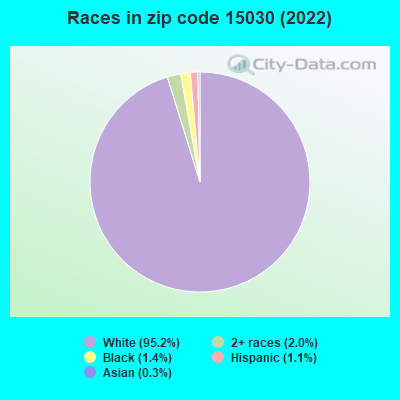
Black race population percentage significantly below state average.
Hispanic race population percentage significantly below state average.
Foreign-born population percentage significantly below state average.
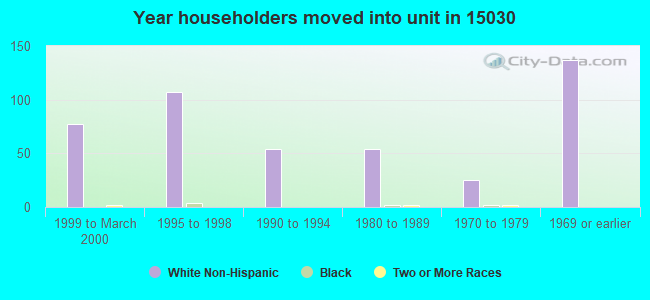
Length of stay since moving in significantly above state average.
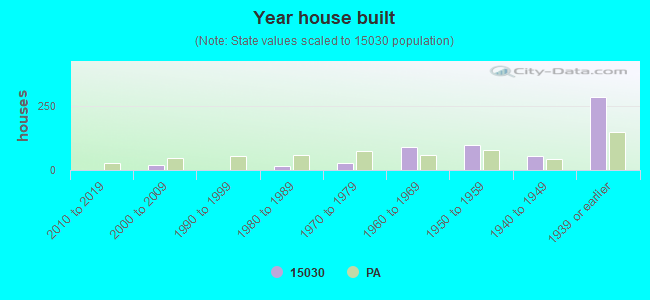
House age above state average.
Number of college students significantly below state average.
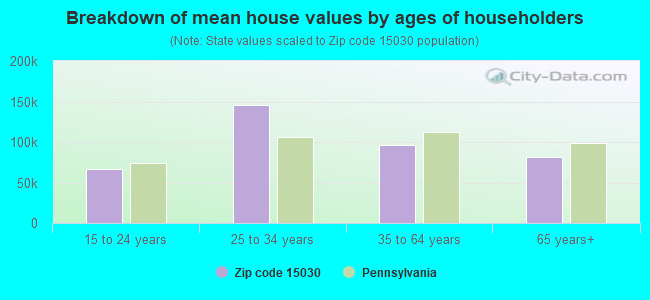
Estimated median house/condo value in 2022: $98,547
15030:
$98,547
Pennsylvania:
$245,500
According to our research of Pennsylvania and other state lists, there was 1 registered sex offender living in 15030 zip code as of April 27, 2024. The ratio of all residents to sex offenders in zip code 15030 is 1,038 to 1. The ratio of registered sex offenders to all residents in this zip code is lower than the state average.
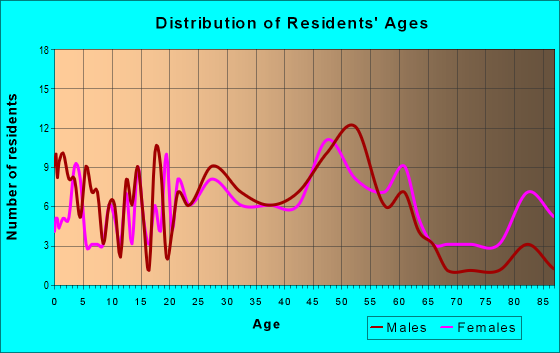
Median resident age:
This zip code:
41.2 years
Pennsylvania median age:
40.9 years
Average household size:
This zip code:
2.1 people
Pennsylvania:
2.4 people
Averages for the 2020 tax year for zip code 15030, filed in 2021:
Average Adjusted Gross Income (AGI) in 2020: $40,139 (Individual Income Tax Returns)
Here:
$40,139
State:
$75,707
Salary/wage: $38,088 (reported on 84.3% of returns)
Here:
$38,088
State:
$62,806
(% of AGI for various income ranges: 1035.0% for AGIs below $25k, 3515.4% for AGIs $25k-50k, 6268.8% for AGIs $50k-75k, 6312.5% for AGIs $75k-100k)
Taxable interest for individuals: $222 (reported on 17.6% of returns)
This zip code:
$222
Pennsylvania:
$1,633
(% of AGI for various income ranges: 8.6% for AGIs below $25k, 10.0% for AGIs $50k-75k)
Ordinary dividends: $600 (reported on 7.8% of returns)
Here:
$600
State:
$7,382
(% of AGI for various income ranges: 7.9% for AGIs below $25k, 16.2% for AGIs $50k-75k)
Net capital gain/loss in AGI: +$300 (reported on 5.9% of returns)
Here:
+$300
State:
+$23,522
(% of AGI for various income ranges: 6.9% for AGIs $25k-50k)
Profit/loss from business: +$1,800 (reported on 5.9% of returns)
Here:
+$1,800
State:
+$16,274
(% of AGI for various income ranges: 41.5% for AGIs $25k-50k)
Taxable individual retirement arrangement distribution: $7,400 (reported on 5.9% of returns)
15030:
$7,400
Pennsylvania:
$18,583
(% of AGI for various income ranges: 158.6% for AGIs below $25k)
Earned income credit: $1,980 (reported on 19.6% of returns)
Here:
$1,980
State:
$2,100
(% of AGI for various income ranges: 88.6% for AGIs below $25k, 56.9% for AGIs $25k-50k)
Percentage of individuals using paid preparers for their 2020 taxes: 90.2%
Here:
90%
State:
92%
(% for various income ranges: 94.4% for AGIs below $25k, 93.8% for AGIs $25k-50k, 90.0% for AGIs $50k-75k, 75.0% for AGIs $75k-100k, 66.7% for AGIs $100k-200k)
Averages for the 2012 tax year for zip code 15030, filed in 2013:
Average Adjusted Gross Income (AGI) in 2012: $35,077 (Individual Income Tax Returns)
Here:
$35,077
State:
$61,346
Salary/wage: $33,613 (reported on 86.8% of returns)
Here:
$33,613
State:
$51,902
(% of AGI for various income ranges: 75.7% for AGIs below $25k, 87.5% for AGIs $25k-50k, 90.6% for AGIs $50k-75k, 77.3% for AGIs $75k-100k)
Taxable interest for individuals: $442 (reported on 22.6% of returns)
This zip code:
$442
Pennsylvania:
$1,588
(% of AGI for various income ranges: 0.4% for AGIs below $25k, 0.4% for AGIs $25k-50k, 0.2% for AGIs $50k-75k, 0.2% for AGIs $75k-100k)
Ordinary dividends: $1,300 (reported on 9.4% of returns)
Here:
$1,300
State:
$5,827
Profit/loss from business: +$2,525 (reported on 7.5% of returns)
Here:
+$2,525
State:
+$16,268
Taxable individual retirement arrangement distribution: $10,633 (reported on 5.7% of returns)
15030:
$10,633
Pennsylvania:
$14,550
Total itemized deductions: $10,960 (19% of AGI, reported on 9.4% of returns)
Here:
$10,960
State:
$23,538
Here:
19.4% of AGI
State:
18.4% of AGI
Charity contributions: $1,450 (reported on 3.8% of returns)
Here:
$1,450
State:
$4,025
Taxes paid: $4,900 (reported on 7.5% of returns)
15030:
$4,900
State:
$9,982
Earned income credit: $1,900 (reported on 22.6% of returns)
Here:
$1,900
State:
$2,106
(% of AGI for various income ranges: 5.3% for AGIs below $25k, 0.9% for AGIs $25k-50k)
Percentage of individuals using paid preparers for their 2012 taxes: 41.5%
Here:
42%
State:
53%
(% for various income ranges: 38.5% for AGIs below $25k, 40.0% for AGIs $25k-50k, 42.9% for AGIs $50k-75k, 60.0% for AGIs $75k-100k)
Averages for the 2004 tax year for zip code 15030, filed in 2005:
Average Adjusted Gross Income (AGI) in 2004: $28,044 (Individual Income Tax Returns)
Here:
$28,044
State:
$48,049
Salary/wage: $28,616 (reported on 81.7% of returns)
Here:
$28,616
State:
$42,646
(% of AGI for various income ranges: 73.4% for AGIs below $10k, 74.0% for AGIs $10k-25k, 85.0% for AGIs $25k-50k, 89.5% for AGIs $50k-75k, 85.0% for AGIs $75k-100k)
Taxable interest for individuals: $1,124 (reported on 39.4% of returns)
This zip code:
$1,124
Pennsylvania:
$1,657
(% of AGI for various income ranges: 7.0% for AGIs below $10k, 3.2% for AGIs $10k-25k, 0.9% for AGIs $25k-50k, 1.0% for AGIs $50k-75k, 0.5% for AGIs $75k-100k)
Taxable dividends: $1,433 (reported on 17.6% of returns)
Here:
$1,433
State:
$3,566
(% of AGI for various income ranges: 3.8% for AGIs below $10k, 2.0% for AGIs $10k-25k, 0.5% for AGIs $25k-50k, 0.3% for AGIs $50k-75k, 0.5% for AGIs $75k-100k)
Net capital gain/loss: +$167 (reported on 8.7% of returns)
Here:
+$167
State:
+$9,716
Profit/loss from business: +$5,476 (reported on 7.6% of returns)
Here:
+$5,476
State:
+$14,267
Total itemized deductions: $11,250 (21% of AGI, reported on 10.2% of returns)
Here:
$11,250
State:
$18,804
Here:
20.5% of AGI
State:
19.5% of AGI
(% of AGI for various income ranges: 4.5% for AGIs $10k-25k, 2.0% for AGIs $25k-50k, 5.0% for AGIs $50k-75k, 7.5% for AGIs $75k-100k)
Charity contributions deductions: $2,077 (4% of AGI, reported on 9.4% of returns)
Here:
$2,077
State:
$3,337
Here:
3.6% of AGI
State:
3.3% of AGI
(% of AGI for various income ranges: 0.3% for AGIs $10k-25k, 0.5% for AGIs $25k-50k, 1.0% for AGIs $50k-75k, 1.3% for AGIs $75k-100k)
Total tax: $3,240 (reported on 69.5% of returns)
15030:
$3,240
State:
$8,008
(% of AGI for various income ranges: 1.8% for AGIs below $10k, 4.2% for AGIs $10k-25k, 7.8% for AGIs $25k-50k, 9.3% for AGIs $50k-75k, 13.1% for AGIs $75k-100k)
Earned income credit: $1,701 (reported on 15.8% of returns)
Here:
$1,701
State:
$1,643
Percentage of individuals using paid preparers for their 2004 taxes: 49.5%
Here:
50%
State:
56%
(% for various income ranges: 47.7% for AGIs below $10k, 50.8% for AGIs $10k-25k, 50.0% for AGIs $25k-50k, 47.6% for AGIs $50k-75k, 52.0% for AGIs $75k-100k)
Household received Food Stamps/SNAP in the past 12 months: 87 Household did not receive Food Stamps/SNAP in the past 12 months: 401
Women who had a birth in the past 12 months: 11 (7 now married, 3 unmarried) Women who did not have a birth in the past 12 months: 179 (65 now married, 113 unmarried)
Housing units in zip code 15030 with a mortgage: 124 (5 second mortgage, 3 both second mortgage and home equity loan) Houses without a mortgage: 8
Median monthly owner costs for units with a mortgage: $887 Median monthly owner costs for units without a mortgage: $430
Residents with income below the poverty level in 2022:
This zip code:
19.7%
Whole state:
11.8%
Residents with income below 50% of the poverty level in 2022:
This zip code:
8.0%
Whole state:
6.1%
Median number of rooms in houses and condos:
Here:
6.2
State:
6.8
Median number of rooms in apartments:
Here:
5.6
State:
4.3
Notable locations in this zip code not listed on our city pages
Notable locations in zip code 15030: Creighton Police Department (A), East Deer Township Hall (B), East Deer Volunteer Hose Company 1 (C), End Bailys Run Branch Station (D). Display/hide their locations on the map
In group quarters: 6 (-1 institutionalized population)
Size of family households: 168 2-persons, 33 3-persons, 32 4-persons, 33 5-persons, 7 6-persons, 3 7-or-more-persons
Size of nonfamily households: 197 1-person, 7 2-persons, 6 3-persons
78 married couples with children.
107 single-parent households (76 men, 31 women).
96.0% of residents of 15030 zip code speak English at home.
2.1% of residents speak Spanish at home (81% very well, 19% not well).
0.2% of residents speak other Indo-European language at home (100% very well).
0.4% of residents speak Asian or Pacific Island language at home (100% very well).
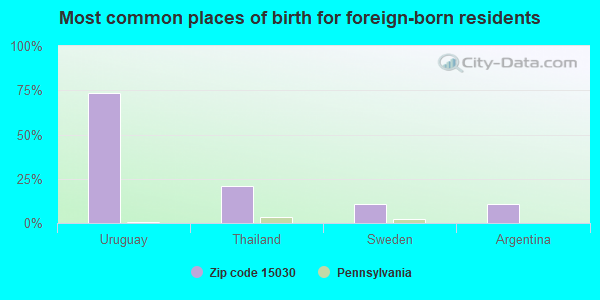
Foreign born population: 20 (1.9%) (100.0% of them are naturalized citizens)
This zip code:
1.9%
Whole state:
7.5%
74%Uruguay
21%Thailand
11%Sweden
11%Argentina
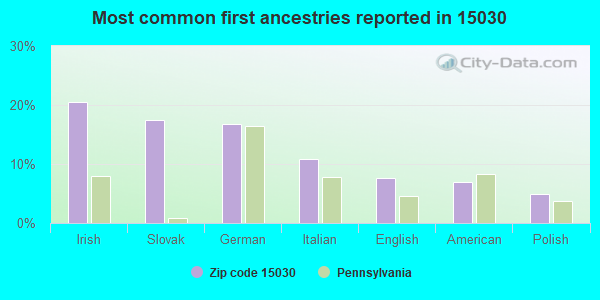
21%Irish
17%Slovak
17%German
11%Italian
8%English
7%American
5%Polish
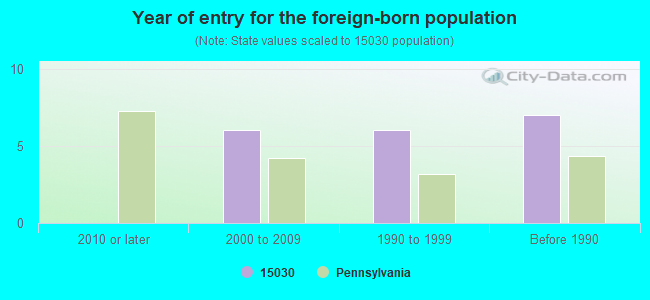
Year of entry for the foreign-born population
02010 or later
62000 to 2009
61990 to 1999
7Before 1990
Facilities with environmental interests located in this zip code:
AIR PROD & CHEM CREIGHTON PLT (ROUTE 28 FREEPORT ROAD in CREIGHTON, PA)
AIR MINOR (AIRS/AFS) (Integrated Compliance Information System) - ICIS-03-1997-0413, FORMAL ENFORCEMENT ACTION COMPLIANCE ACTIVITY (Tracking inspections of insecticide, fungicide, and rodenticide, and toxic substances) STATE MASTER (Pennsylvania database) - PCS-PAR236112, National Pollutant Discharge Elimination System Permit, RCRIS-PAD004497699, HAZARDOUS WASTE PROGRAM National Pollutant Discharge Elimination System NON-MAJOR (Tracking pollutant discharge elimination systems) - permit Small Quantity Generators, between 100 kg and 1000 kg of hazardous waste/month (Resource Conservation and Recovery Act (tracking hazardous waste)) - notification TRI REPORTER (Tracking of toxic chemicals releasing facilities) Business SIC classification: INDUSTRIAL GASES Organizations: AIR PRODUCTS AND CHEMICALS INC (CONTACT/OWNER)
, AIR PRODUCTS AND CHEMICALS, INC. (CONTACT/OWNER)
Alternative names: AIR PRODUCTS & CHEMICALS INC, AIR PRODS. & CHEMICALS INC. CREIGHTON PA FAC.
AUTOLINE (549 FREEPORT RD in CREIGHTON, PA)
Conditionally Exempt Small Quantity Generators, less than 100 kg/month of hazardous waste (Resource Conservation and Recovery Act (tracking hazardous waste)) - notification Organizations: BOMBALSKI JAMES (CONTACT/OWNER)
Housing units lacking complete plumbing facilities: 3.8% Housing units lacking complete kitchen facilities: 13.7%
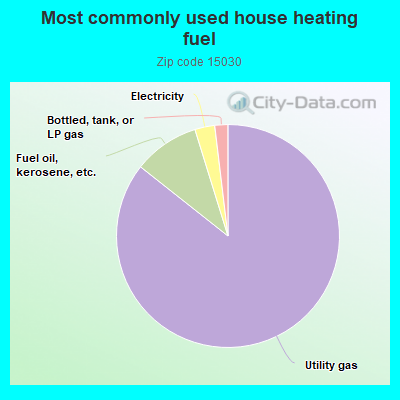
86.0%Utility gas
9.6%Fuel oil, kerosene, etc.
2.9%Electricity
1.9%Bottled, tank, or LP gas
Population in 1990: 1,761.
Place of birth for U.S.-born residents:
This state: 913
Northeast: 13
Midwest: 47
South: 31
West: 17
62% of the 15030 zip code residents lived in the same house 5 years ago. Out of people who lived in different houses, 78% lived in this county. Out of people who lived in different counties, 50% lived in Pennsylvania.
92% of the 15030 zip code residents lived in the same house 1 year ago. Out of people who lived in different houses, 42% moved from this county. Out of people who lived in different houses, 44% moved from different county within same state. Out of people who lived in different houses, 7% moved from different state. Out of people who lived in different houses, 7% moved from abroad.
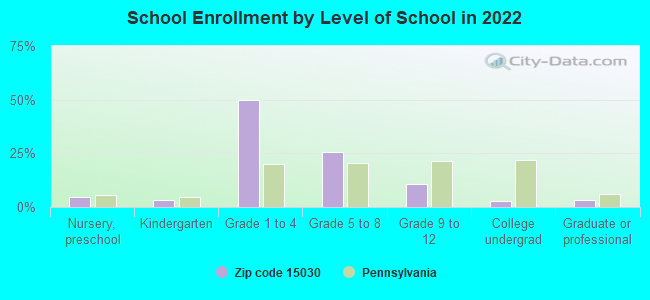
Private vs. public school enrollment:
Students in private schools in grades 1 to 8 (elementary and middle school):
Here:
0.0%
Pennsylvania:
15.7%
Students in private schools in grades 9 to 12 (high school):
Here:
0.0%
Pennsylvania:
13.4%
Students in private undergraduate colleges:
Here:
0.0%
Pennsylvania:
39.8%
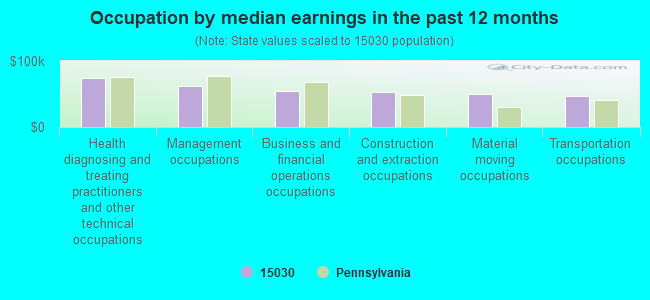
Occupation by median earnings in the past 12 months ($)
74,974Health diagnosing and treating practitioners and other technical occupations
61,885Management occupations
54,378Business and financial operations occupations
52,791Construction and extraction occupations
49,946Material moving occupations
46,256Transportation occupations
Companies with federal contracts located in this zip code:
SPINWELL LTD (426 FREEPORT RD in CREIGHTON, PA; small business) : $3,332,168 in 20 contractsfrom 2004 to 2006
Contracts for Oils and Greases: Cutting, Lubricating, and Hydraulic, Miscellaneous Chemical Specialties by Defense Logistics Agency Signed by year:2000: $0; 2001: $0; 2002: $0; 2003: $0; 2004: $898,480; 2005: $1,099,806; 2006: $1,333,882.
Biggest contracts:
$624,373 with Defense Logistics Agency for Oils and Greases: Cutting, Lubricating, and Hydraulic. Signed on 2006-03-31. Completion date: 2006-05-20.
$624,373, same as above.Signed on 2006-03-31. Completion date: 2006-05-30.
$517,677, same as above.Signed on 2005-09-16. Completion date: 2005-10-16.
$221,540, same as above.Signed on 2004-03-29. Completion date: 2004-05-13.
PITT PENN OIL CO INC (426 FREEPORT ROAD in CREIGHTON, PA; small business) : $884,558 in 10 contractsfrom 1999 to 2003
Contracts for Oils and Greases: Cutting, Lubricating, and Hydraulic, Miscellaneous Chemical Specialties by Defense Logistics Agency Signed by year:2000: $32,162; 2001: $251,774; 2002: $384,699; 2003: $124,196; 2004: $0; 2005: $0; 2006: $0.
Biggest contracts:
$354,307 with Defense Logistics Agency for Oils and Greases: Cutting, Lubricating, and Hydraulic. Signed on 2002-07-31. Completion date: 2003-07-30.
$95,299 with Defense Logistics Agency for Miscellaneous Chemical Specialties. Signed on 2001-03-09. Completion date: 2001-04-23.
$91,727 with Defense Logistics Agency for Oils and Greases: Cutting, Lubricating, and Hydraulic. Signed on 1999-10-29. Completion date: 1999-12-28.
$82,799, same as above.Signed on 2001-12-03. Completion date: 2002-01-02.
Top industries in this zip code by the number of employees in 2005:
Wholesale Trade: Recyclable Material Merchant Wholesalers (20-49 employees: 1 establishment)
Health Care and Social Assistance: Homes for the Elderly (20-49: 1)
Construction: Residential Remodelers (20-49: 1)
Accommodation and Food Services: Full-Service Restaurants (20-49: 1)
Other Services (except Public Administration): Labor Unions and Similar Labor Organizations (10-19: 1, 5-9: 1)
Wholesale Trade: Other Chemical and Allied Products Merchant Wholesalers (10-19: 1)
Wholesale Trade: Motor Vehicle Supplies and New Parts Merchant Wholesalers (10-19: 1)
People in group quarters in 2000:
53 people in nursing homes
Home Mortgage Disclosure Act Aggregated Statistics For Year 2009 (Based on 2 partial tracts)
A) FHA, FSA/RHS & VA Home Purchase Loans
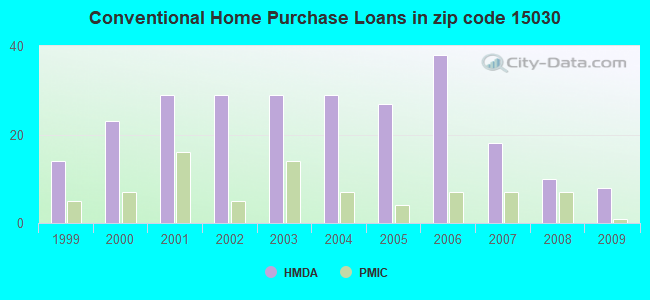
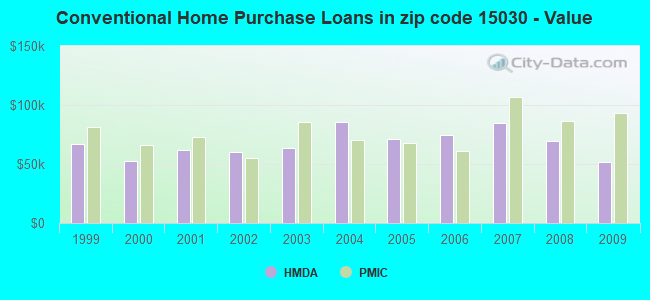
B) Conventional Home Purchase Loans
C) Refinancings
D) Home Improvement Loans
F) Non-occupant Loans on < 5 Family Dwellings (A B C & D)
Number
Average Value
Number
Average Value
Number
Average Value
Number
Average Value
Number
Average Value
LOANS ORIGINATED
7
$68,916
8
$52,101
16
$77,726
4
$30,408
4
$44,072
APPLICATIONS APPROVED, NOT ACCEPTED
0
$0
1
$16,400
1
$154,430
3
$6,377
0
$0
APPLICATIONS DENIED
0
$0
1
$10,930
5
$112,334
10
$25,009
4
$36,898
APPLICATIONS WITHDRAWN
1
$194,060
3
$80,173
5
$103,862
0
$0
0
$0
FILES CLOSED FOR INCOMPLETENESS
1
$80,630
0
$0
0
$0
0
$0
0
$0
Aggregated Statistics For Year 2008 (Based on 2 partial tracts)
A) FHA, FSA/RHS & VA Home Purchase Loans
B) Conventional Home Purchase Loans
C) Refinancings
D) Home Improvement Loans
E) Loans on Dwellings For 5+ Families
F) Non-occupant Loans on < 5 Family Dwellings (A B C & D)
Number
Average Value
Number
Average Value
Number
Average Value
Number
Average Value
Number
Average Value
Number
Average Value
LOANS ORIGINATED
7
$81,216
10
$69,560
15
$92,838
3
$27,333
1
$200,890
3
$36,443
APPLICATIONS APPROVED, NOT ACCEPTED
0
$0
0
$0
3
$48,743
1
$13,670
0
$0
0
$0
APPLICATIONS DENIED
0
$0
1
$95,660
22
$69,262
5
$24,598
0
$0
0
$0
APPLICATIONS WITHDRAWN
0
$0
0
$0
7
$85,706
1
$71,060
0
$0
1
$218,660
FILES CLOSED FOR INCOMPLETENESS
0
$0
0
$0
0
$0
0
$0
0
$0
0
$0
Aggregated Statistics For Year 2007 (Based on 2 partial tracts)
A) FHA, FSA/RHS & VA Home Purchase Loans
B) Conventional Home Purchase Loans
C) Refinancings
D) Home Improvement Loans
F) Non-occupant Loans on < 5 Family Dwellings (A B C & D)
G) Loans On Manufactured Home Dwelling (A B C & D)
Number
Average Value
Number
Average Value
Number
Average Value
Number
Average Value
Number
Average Value
Number
Average Value
LOANS ORIGINATED
4
$63,548
18
$84,577
29
$57,821
4
$30,408
5
$42,364
0
$0
APPLICATIONS APPROVED, NOT ACCEPTED
0
$0
1
$30,070
1
$153,060
3
$24,143
0
$0
0
$0
APPLICATIONS DENIED
0
$0
3
$81,540
25
$74,890
14
$31,627
0
$0
1
$9,570
APPLICATIONS WITHDRAWN
0
$0
3
$82,907
7
$53,689
1
$6,830
1
$142,130
0
$0
FILES CLOSED FOR INCOMPLETENESS
0
$0
0
$0
3
$56,487
0
$0
0
$0
0
$0
Aggregated Statistics For Year 2006 (Based on 2 partial tracts)
A) FHA, FSA/RHS & VA Home Purchase Loans
B) Conventional Home Purchase Loans
C) Refinancings
D) Home Improvement Loans
F) Non-occupant Loans on < 5 Family Dwellings (A B C & D)
Number
Average Value
Number
Average Value
Number
Average Value
Number
Average Value
Number
Average Value
LOANS ORIGINATED
3
$66,053
38
$74,228
36
$55,423
18
$16,172
11
$45,844
APPLICATIONS APPROVED, NOT ACCEPTED
0
$0
1
$61,500
10
$51,521
0
$0
3
$45,097
APPLICATIONS DENIED
1
$105,230
14
$48,416
41
$62,597
15
$35,531
4
$16,400
APPLICATIONS WITHDRAWN
3
$32,800
4
$57,398
4
$70,038
3
$18,220
0
$0
FILES CLOSED FOR INCOMPLETENESS
0
$0
3
$79,263
4
$70,722
0
$0
0
$0
Aggregated Statistics For Year 2005 (Based on 2 partial tracts)
A) FHA, FSA/RHS & VA Home Purchase Loans
B) Conventional Home Purchase Loans
C) Refinancings
D) Home Improvement Loans
F) Non-occupant Loans on < 5 Family Dwellings (A B C & D)
G) Loans On Manufactured Home Dwelling (A B C & D)
Number
Average Value
Number
Average Value
Number
Average Value
Number
Average Value
Number
Average Value
Number
Average Value
LOANS ORIGINATED
7
$102,886
27
$71,468
34
$70,822
12
$35,190
5
$79,810
0
$0
APPLICATIONS APPROVED, NOT ACCEPTED
0
$0
3
$97,940
11
$61,621
3
$46,010
0
$0
0
$0
APPLICATIONS DENIED
0
$0
4
$36,215
53
$73,951
18
$30,217
7
$24,209
1
$10,930
APPLICATIONS WITHDRAWN
0
$0
7
$52,907
19
$126,518
5
$89,102
0
$0
0
$0
FILES CLOSED FOR INCOMPLETENESS
0
$0
0
$0
1
$327,980
0
$0
0
$0
0
$0
Aggregated Statistics For Year 2004 (Based on 2 partial tracts)
A) FHA, FSA/RHS & VA Home Purchase Loans
B) Conventional Home Purchase Loans
C) Refinancings
D) Home Improvement Loans
F) Non-occupant Loans on < 5 Family Dwellings (A B C & D)
G) Loans On Manufactured Home Dwelling (A B C & D)
Number
Average Value
Number
Average Value
Number
Average Value
Number
Average Value
Number
Average Value
Number
Average Value
LOANS ORIGINATED
5
$113,974
29
$86,002
48
$59,162
16
$25,966
1
$51,930
0
$0
APPLICATIONS APPROVED, NOT ACCEPTED
0
$0
7
$64,034
10
$53,024
5
$21,318
4
$30,748
0
$0
APPLICATIONS DENIED
3
$71,520
10
$31,568
59
$61,844
18
$19,057
10
$26,922
1
$10,930
APPLICATIONS WITHDRAWN
1
$106,590
7
$51,736
25
$67,346
0
$0
0
$0
0
$0
FILES CLOSED FOR INCOMPLETENESS
0
$0
0
$0
15
$76,803
3
$16,853
3
$27,333
0
$0
Aggregated Statistics For Year 2003 (Based on 2 partial tracts)
A) FHA, FSA/RHS & VA Home Purchase Loans
B) Conventional Home Purchase Loans
C) Refinancings
D) Home Improvement Loans
E) Loans on Dwellings For 5+ Families
F) Non-occupant Loans on < 5 Family Dwellings (A B C & D)
Number
Average Value
Number
Average Value
Number
Average Value
Number
Average Value
Number
Average Value
Number
Average Value
LOANS ORIGINATED
5
$66,964
29
$63,476
87
$65,204
16
$45,098
1
$38,260
18
$51,627
APPLICATIONS APPROVED, NOT ACCEPTED
0
$0
3
$48,287
26
$72,693
5
$24,872
0
$0
0
$0
APPLICATIONS DENIED
0
$0
7
$34,750
56
$58,935
11
$19,754
0
$0
12
$31,887
APPLICATIONS WITHDRAWN
0
$0
4
$85,412
15
$60,313
0
$0
0
$0
3
$39,630
FILES CLOSED FOR INCOMPLETENESS
0
$0
0
$0
4
$63,205
0
$0
0
$0
0
$0
Aggregated Statistics For Year 2002 (Based on 2 partial tracts)
A) FHA, FSA/RHS & VA Home Purchase Loans
B) Conventional Home Purchase Loans
C) Refinancings
D) Home Improvement Loans
F) Non-occupant Loans on < 5 Family Dwellings (A B C & D)
Number
Average Value
Number
Average Value
Number
Average Value
Number
Average Value
Number
Average Value
LOANS ORIGINATED
7
$69,111
29
$60,130
45
$65,931
10
$19,542
5
$114,248
APPLICATIONS APPROVED, NOT ACCEPTED
3
$40,997
4
$39,972
11
$59,882
5
$15,306
1
$27,330
APPLICATIONS DENIED
1
$57,400
1
$94,300
23
$45,573
3
$8,657
1
$102,500
APPLICATIONS WITHDRAWN
1
$169,460
4
$51,248
23
$61,972
4
$23,232
1
$54,660
FILES CLOSED FOR INCOMPLETENESS
0
$0
0
$0
5
$63,136
0
$0
0
$0
Aggregated Statistics For Year 2001 (Based on 2 partial tracts)
A) FHA, FSA/RHS & VA Home Purchase Loans
B) Conventional Home Purchase Loans
C) Refinancings
D) Home Improvement Loans
F) Non-occupant Loans on < 5 Family Dwellings (A B C & D)
Number
Average Value
Number
Average Value
Number
Average Value
Number
Average Value
Number
Average Value
LOANS ORIGINATED
3
$32,800
29
$61,497
41
$46,331
12
$19,360
3
$53,753
APPLICATIONS APPROVED, NOT ACCEPTED
0
$0
4
$64,573
12
$58,536
5
$45,098
0
$0
APPLICATIONS DENIED
0
$0
0
$0
41
$59,997
8
$16,741
4
$131,535
APPLICATIONS WITHDRAWN
3
$82,450
3
$94,750
19
$46,968
4
$30,065
1
$54,660
FILES CLOSED FOR INCOMPLETENESS
0
$0
0
$0
5
$67,236
0
$0
1
$65,600
Aggregated Statistics For Year 2000 (Based on 2 partial tracts)
A) FHA, FSA/RHS & VA Home Purchase Loans
B) Conventional Home Purchase Loans
C) Refinancings
D) Home Improvement Loans
F) Non-occupant Loans on < 5 Family Dwellings (A B C & D)
Number
Average Value
Number
Average Value
Number
Average Value
Number
Average Value
Number
Average Value
LOANS ORIGINATED
3
$33,710
23
$52,466
37
$39,262
10
$11,206
5
$46,464
APPLICATIONS APPROVED, NOT ACCEPTED
1
$53,300
4
$81,655
16
$40,742
7
$15,033
0
$0
APPLICATIONS DENIED
1
$53,300
5
$62,044
23
$39,691
8
$21,695
3
$37,810
APPLICATIONS WITHDRAWN
0
$0
4
$69,012
10
$59,174
1
$17,770
0
$0
FILES CLOSED FOR INCOMPLETENESS
0
$0
0
$0
4
$41,682
0
$0
0
$0
Aggregated Statistics For Year 1999 (Based on 1 partial tract)
A) FHA, FSA/RHS & VA Home Purchase Loans
B) Conventional Home Purchase Loans
C) Refinancings
D) Home Improvement Loans
F) Non-occupant Loans on < 5 Family Dwellings (A B C & D)


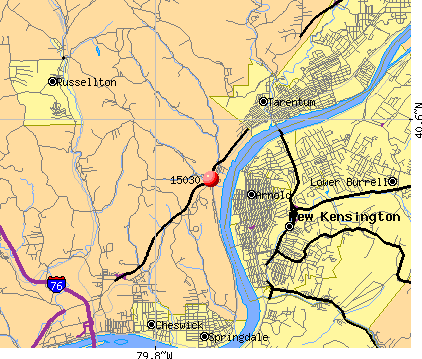 Nearest zip codes: 15084, 15049, 15144, 15075, 15014, 15076.