Estimated zip code population in 2022: 3,948 Zip code population in 2010: 4,142 Zip code population in 2000: 4,648
Houses and condos: 2,053 Renter-occupied apartments: 632
% of renters here:
33%
State:
31%
March 2022 cost of living index in zip code 15144: 92.3 (less than average, U.S. average is 100)
Land area: 2.8 sq. mi. Water area: 0.3 sq. mi.
Population density: 1,431 people per square mile
(low).
OSM Map
General Map
Google Map
MSN Map
OSM Map
General Map
Google Map
MSN Map
OSM Map
General Map
Google Map
MSN Map
OSM Map
General Map
Google Map
MSN Map
Please wait while loading the map...
Real estate property taxes paid for housing units in 2022:
This zip code:
1.6% ($2,423)
Pennsylvania:
1.3% ($3,094)
Median real estate property taxes paid for housing units with mortgages in 2022: $2,921 (1.9%) Median real estate property taxes paid for housing units with no mortgage in 2022: $1,816 (1.4%)
Estimated median house/condo value in 2022: $148,906
15144:
$148,906
Pennsylvania:
$245,500
According to our research of Pennsylvania and other state lists, there were 3 registered sex offenders living in 15144 zip code as of April 27, 2024. The ratio of all residents to sex offenders in zip code 15144 is 1,394 to 1. The ratio of registered sex offenders to all residents in this zip code is lower than the state average.
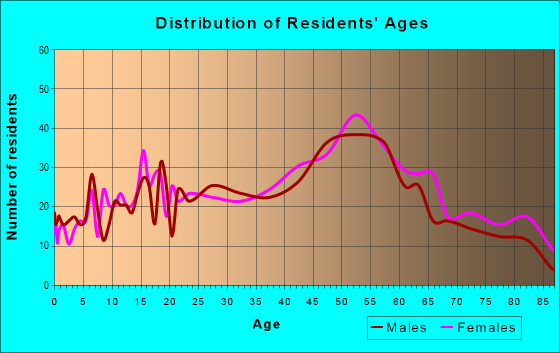
Median resident age:
This zip code:
51.6 years
Pennsylvania median age:
40.9 years
Average household size:
This zip code:
2.0 people
Pennsylvania:
2.4 people
Averages for the 2020 tax year for zip code 15144, filed in 2021:
Average Adjusted Gross Income (AGI) in 2020: $51,573 (Individual Income Tax Returns)
Here:
$51,573
State:
$75,707
Salary/wage: $47,112 (reported on 80.0% of returns)
Here:
$47,112
State:
$62,806
(% of AGI for various income ranges: 968.8% for AGIs below $25k, 3405.0% for AGIs $25k-50k, 6067.7% for AGIs $50k-75k, 8976.7% for AGIs $75k-100k, 15505.3% for AGIs $100k-200k)
Taxable interest for individuals: $646 (reported on 25.1% of returns)
This zip code:
$646
Pennsylvania:
$1,633
(% of AGI for various income ranges: 17.7% for AGIs below $25k, 14.6% for AGIs $25k-50k, 15.0% for AGIs $50k-75k, 34.4% for AGIs $75k-100k, 52.9% for AGIs $100k-200k)
Ordinary dividends: $1,933 (reported on 16.7% of returns)
Here:
$1,933
State:
$7,382
(% of AGI for various income ranges: 12.9% for AGIs below $25k, 37.8% for AGIs $25k-50k, 35.3% for AGIs $50k-75k, 85.0% for AGIs $75k-100k, 118.2% for AGIs $100k-200k)
Net capital gain/loss in AGI: +$3,223 (reported on 12.1% of returns)
Here:
+$3,223
State:
+$23,522
(% of AGI for various income ranges: 11.2% for AGIs below $25k, 18.7% for AGIs $25k-50k, 28.7% for AGIs $50k-75k, 84.4% for AGIs $75k-100k, 270.6% for AGIs $100k-200k)
Profit/loss from business: +$11,340 (reported on 9.3% of returns)
Here:
+$11,340
State:
+$16,274
(% of AGI for various income ranges: 62.3% for AGIs below $25k, 105.9% for AGIs $25k-50k, 196.7% for AGIs $50k-75k, 144.4% for AGIs $75k-100k, 371.8% for AGIs $100k-200k)
Taxable individual retirement arrangement distribution: $14,458 (reported on 11.2% of returns)
15144:
$14,458
Pennsylvania:
$18,583
(% of AGI for various income ranges: 88.5% for AGIs below $25k, 122.0% for AGIs $25k-50k, 168.0% for AGIs $50k-75k, 406.7% for AGIs $75k-100k, 734.1% for AGIs $100k-200k)
Total itemized deductions: $25,975 (reported on 1.9% of returns)
Here:
$25,975
State:
$34,850
(% of AGI for various income ranges: 577.2% for AGIs $75k-100k)
Charity contributions: $4,550 (reported on 0.9% of returns)
Here:
$4,550
State:
$12,392
(% of AGI for various income ranges: 30.3% for AGIs $50k-75k)
Taxes paid: $6,925 (reported on 1.9% of returns)
15144:
$6,925
State:
$8,200
(% of AGI for various income ranges: 153.9% for AGIs $75k-100k)
Earned income credit: $1,829 (reported on 11.2% of returns)
Here:
$1,829
State:
$2,100
(% of AGI for various income ranges: 54.6% for AGIs below $25k, 38.5% for AGIs $25k-50k)
Percentage of individuals using paid preparers for their 2020 taxes: 88.8%
Here:
89%
State:
92%
(% for various income ranges: 86.8% for AGIs below $25k, 91.4% for AGIs $25k-50k, 89.5% for AGIs $50k-75k, 88.5% for AGIs $75k-100k, 95.7% for AGIs $100k-200k, 0.0% for AGIs over 200k)
Averages for the 2012 tax year for zip code 15144, filed in 2013:
Average Adjusted Gross Income (AGI) in 2012: $41,803 (Individual Income Tax Returns)
Here:
$41,803
State:
$61,346
Salary/wage: $39,943 (reported on 82.8% of returns)
Here:
$39,943
State:
$51,902
(% of AGI for various income ranges: 66.2% for AGIs below $25k, 80.8% for AGIs $25k-50k, 81.8% for AGIs $50k-75k, 84.6% for AGIs $75k-100k, 76.9% for AGIs $100k-200k)
Taxable interest for individuals: $778 (reported on 28.2% of returns)
This zip code:
$778
Pennsylvania:
$1,588
(% of AGI for various income ranges: 1.0% for AGIs below $25k, 0.8% for AGIs $25k-50k, 0.5% for AGIs $50k-75k, 0.2% for AGIs $75k-100k, 0.3% for AGIs $100k-200k)
Ordinary dividends: $1,737 (reported on 18.1% of returns)
Here:
$1,737
State:
$5,827
(% of AGI for various income ranges: 1.4% for AGIs below $25k, 0.8% for AGIs $25k-50k, 0.5% for AGIs $50k-75k, 0.8% for AGIs $75k-100k, 0.6% for AGIs $100k-200k)
Net capital gain/loss in AGI: +$813 (reported on 10.1% of returns)
Here:
+$813
State:
+$14,495
(% of AGI for various income ranges: 0.2% for AGIs $50k-75k, 0.6% for AGIs $100k-200k)
Profit/loss from business: +$12,367 (reported on 7.9% of returns)
Here:
+$12,367
State:
+$16,268
(% of AGI for various income ranges: 5.5% for AGIs below $25k, 1.2% for AGIs $25k-50k, 3.1% for AGIs $50k-75k, 1.1% for AGIs $75k-100k, 2.2% for AGIs $100k-200k)
Taxable individual retirement arrangement distribution: $11,352 (reported on 11.9% of returns)
15144:
$11,352
Pennsylvania:
$14,550
(% of AGI for various income ranges: 5.6% for AGIs below $25k, 2.5% for AGIs $25k-50k, 2.0% for AGIs $50k-75k, 2.6% for AGIs $75k-100k, 4.4% for AGIs $100k-200k)
Total itemized deductions: $14,083 (18% of AGI, reported on 18.5% of returns)
Here:
$14,083
State:
$23,538
Here:
18.3% of AGI
State:
18.4% of AGI
(% of AGI for various income ranges: 3.2% for AGIs below $25k, 4.9% for AGIs $25k-50k, 5.4% for AGIs $50k-75k, 7.2% for AGIs $75k-100k, 9.1% for AGIs $100k-200k)
Charity contributions: $2,073 (reported on 14.5% of returns)
Here:
$2,073
State:
$4,025
(% of AGI for various income ranges: 0.2% for AGIs below $25k, 0.5% for AGIs $25k-50k, 0.6% for AGIs $50k-75k, 0.7% for AGIs $75k-100k, 1.2% for AGIs $100k-200k)
Taxes paid: $6,226 (reported on 18.5% of returns)
15144:
$6,226
State:
$9,982
(% of AGI for various income ranges: 0.9% for AGIs below $25k, 1.8% for AGIs $25k-50k, 2.2% for AGIs $50k-75k, 3.3% for AGIs $75k-100k, 4.9% for AGIs $100k-200k)
Earned income credit: $1,685 (reported on 11.9% of returns)
Here:
$1,685
State:
$2,106
(% of AGI for various income ranges: 2.9% for AGIs below $25k, 0.6% for AGIs $25k-50k)
Percentage of individuals using paid preparers for their 2012 taxes: 42.3%
Here:
42%
State:
53%
(% for various income ranges: 37.6% for AGIs below $25k, 41.0% for AGIs $25k-50k, 45.9% for AGIs $50k-75k, 55.0% for AGIs $75k-100k, 50.0% for AGIs $100k-200k)
Averages for the 2004 tax year for zip code 15144, filed in 2005:
Average Adjusted Gross Income (AGI) in 2004: $33,856 (Individual Income Tax Returns)
Here:
$33,856
State:
$48,049
Salary/wage: $33,696 (reported on 81.7% of returns)
Here:
$33,696
State:
$42,646
(% of AGI for various income ranges: 70.9% for AGIs below $10k, 70.8% for AGIs $10k-25k, 81.1% for AGIs $25k-50k, 87.7% for AGIs $50k-75k, 84.5% for AGIs $75k-100k, 79.1% for AGIs over 100k)
Taxable interest for individuals: $1,183 (reported on 44.5% of returns)
This zip code:
$1,183
Pennsylvania:
$1,657
(% of AGI for various income ranges: 5.2% for AGIs below $10k, 2.7% for AGIs $10k-25k, 1.4% for AGIs $25k-50k, 1.1% for AGIs $50k-75k, 1.3% for AGIs $75k-100k, 1.0% for AGIs over 100k)
Taxable dividends: $1,236 (reported on 24.3% of returns)
Here:
$1,236
State:
$3,566
(% of AGI for various income ranges: 3.0% for AGIs below $10k, 1.6% for AGIs $10k-25k, 0.7% for AGIs $25k-50k, 0.6% for AGIs $50k-75k, 0.8% for AGIs $75k-100k, 0.8% for AGIs over 100k)
Net capital gain/loss: +$828 (reported on 14.0% of returns)
Here:
+$828
State:
+$9,716
(% of AGI for various income ranges: -1.5% for AGIs below $10k, 0.5% for AGIs $10k-25k, 0.3% for AGIs $25k-50k, 0.1% for AGIs $50k-75k, 0.2% for AGIs $75k-100k, 1.2% for AGIs over 100k)
Profit/loss from business: +$8,301 (reported on 7.8% of returns)
Here:
+$8,301
State:
+$14,267
(% of AGI for various income ranges: 4.9% for AGIs below $10k, 4.1% for AGIs $10k-25k, 1.6% for AGIs $25k-50k, 1.6% for AGIs $50k-75k, 2.3% for AGIs $75k-100k)
IRA payment deduction: $2,535 (reported on 1.9% of returns)
15144:
$2,535
Pennsylvania:
$2,903
Total itemized deductions: $12,512 (20% of AGI, reported on 20.6% of returns)
Here:
$12,512
State:
$18,804
Here:
19.9% of AGI
State:
19.5% of AGI
(% of AGI for various income ranges: 5.3% for AGIs $10k-25k, 6.0% for AGIs $25k-50k, 9.1% for AGIs $50k-75k, 9.4% for AGIs $75k-100k, 10.6% for AGIs over 100k)
Charity contributions deductions: $1,694 (3% of AGI, reported on 18.5% of returns)
Here:
$1,694
State:
$3,337
Here:
2.6% of AGI
State:
3.3% of AGI
(% of AGI for various income ranges: 0.4% for AGIs $10k-25k, 0.7% for AGIs $25k-50k, 1.1% for AGIs $50k-75k, 1.2% for AGIs $75k-100k, 1.8% for AGIs over 100k)
Total tax: $3,963 (reported on 74.8% of returns)
15144:
$3,963
State:
$8,008
(% of AGI for various income ranges: 1.6% for AGIs below $10k, 4.6% for AGIs $10k-25k, 7.2% for AGIs $25k-50k, 8.9% for AGIs $50k-75k, 10.9% for AGIs $75k-100k, 15.4% for AGIs over 100k)
Earned income credit: $1,401 (reported on 11.4% of returns)
Here:
$1,401
State:
$1,643
Percentage of individuals using paid preparers for their 2004 taxes: 47.9%
Here:
48%
State:
56%
(% for various income ranges: 42.2% for AGIs below $10k, 47.3% for AGIs $10k-25k, 50.2% for AGIs $25k-50k, 54.6% for AGIs $50k-75k, 46.0% for AGIs $75k-100k, 44.2% for AGIs over 100k)
Household received Food Stamps/SNAP in the past 12 months: 261 Household did not receive Food Stamps/SNAP in the past 12 months: 1,660
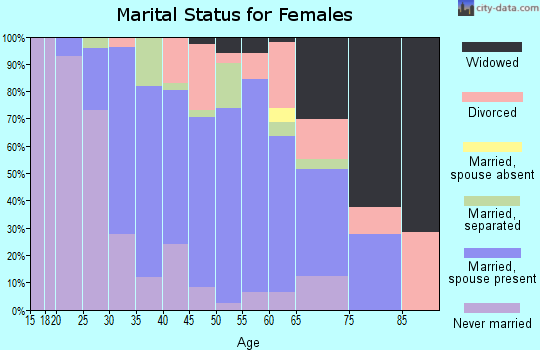
Women who had a birth in the past 12 months: 20 (21 now married, 0 unmarried) Women who did not have a birth in the past 12 months: 598 (259 now married, 338 unmarried)
Housing units in zip code 15144 with a mortgage: 704 (123 second mortgage, 89 both second mortgage and home equity loan) Houses without a mortgage: 32
Median monthly owner costs for units with a mortgage: $1,385 Median monthly owner costs for units without a mortgage: $514
Residents with income below the poverty level in 2022:
This zip code:
6.3%
Whole state:
11.8%
Residents with income below 50% of the poverty level in 2022:
This zip code:
2.5%
Whole state:
6.1%
Median number of rooms in houses and condos:
Here:
6.4
State:
6.8
Median number of rooms in apartments:
Here:
4.0
State:
4.3
Notable locations in this zip code not listed on our city pages
Notable locations in zip code 15144: Angels Ark Childcare Center (A), Springdale Borough Hall (B), Springdale Free Public Library (C), Springdale Police Department (D), Springdale Volunteer Fire Department Station 274 (E). Display/hide their locations on the map
In group quarters: 5 (-1 institutionalized population)
Size of family households: 720 2-persons, 178 3-persons, 127 4-persons, 69 5-persons, 20 6-persons
Size of nonfamily households: 700 1-person, 104 2-persons, 10 3-persons
427 married couples with children.
132 single-parent households (20 men, 112 women).
95.8% of residents of 15144 zip code speak English at home.
2.4% of residents speak Spanish at home (64% very well, 21% well, 14% not well).
0.9% of residents speak other Indo-European language at home (97% very well, 3% well).
0.6% of residents speak other language at home (100% very well).
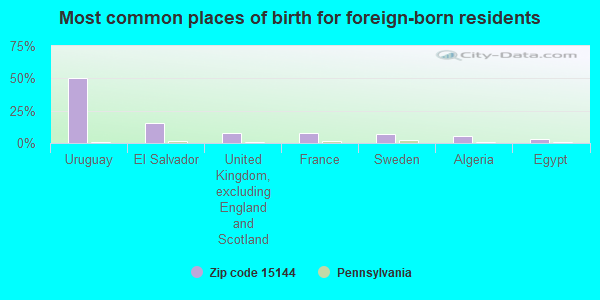
Foreign born population: 127 (3.2%) (50.6% of them are naturalized citizens)
This zip code:
3.2%
Whole state:
7.5%
50%Uruguay
16%El Salvador
8%United Kingdom, excluding England and Scotland
8%France
7%Sweden
6%Algeria
3%Egypt
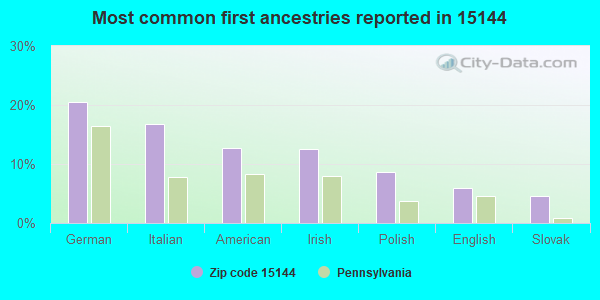
20%German
17%Italian
13%American
12%Irish
9%Polish
6%English
5%Slovak
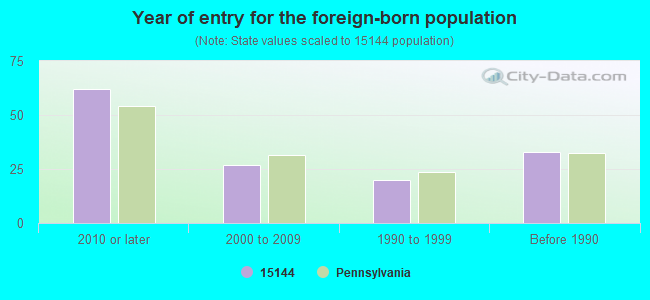
Year of entry for the foreign-born population
622010 or later
272000 to 2009
201990 to 1999
33Before 1990
Facilities with environmental interests located in this zip code:
ALLEGHENY ENERGY SUPPLY UNITS 3 4 5 (BUTLER STREET in SPRINGDALE, PA)
AIR MAJOR (AIRS/AFS) AIR PROGRAM (Clean Air Markets Division Business System) (Integrated Compliance Information System) - ICIS-03-1986-0711, FORMAL ENFORCEMENT ACTION COMPLIANCE ACTIVITY (Tracking inspections of insecticide, fungicide, and rodenticide, and toxic substances) CRITERIA AND HAZARDOUS AIR POLLUTANT INVENTORY (Inventory of air pollution sources) STATE MASTER (Pennsylvania database) - PCS-PA0002925, National Pollutant Discharge Elimination System Permit, PCS-PA0091740, RCRIS-PAR000043133, HAZARDOUS WASTE PROGRAM, RCRIS-PAR000506287, PWSID-5020807, DRINKING WATER PROGRAM STATE MASTER (Pennsylvania database) - PCS-PA0219134, National Pollutant Discharge Elimination System Permit National Pollutant Discharge Elimination System NON-MAJOR (Tracking pollutant discharge elimination systems) - permit National Pollutant Discharge Elimination System NON-MAJOR (Tracking pollutant discharge elimination systems) - permit National Pollutant Discharge Elimination System NON-MAJOR (Tracking pollutant discharge elimination systems) - permit National Pollutant Discharge Elimination System NON-MAJOR (Tracking pollutant discharge elimination systems) - permit Conditionally Exempt Small Quantity Generators, less than 100 kg/month of hazardous waste (Resource Conservation and Recovery Act (tracking hazardous waste)) - notification USED OIL PROGRAM (Resource Conservation and Recovery Act (tracking hazardous waste)) Conditionally Exempt Small Quantity Generators, less than 100 kg/month of hazardous waste (Resource Conservation and Recovery Act (tracking hazardous waste)) - notification Small Quantity Generators, between 100 kg and 1000 kg of hazardous waste/month (Resource Conservation and Recovery Act (tracking hazardous waste)) - notification Business SIC classification: ELECTRIC SERVICES; REFUSE SYSTEMS Business NAICS classification: FOSSIL FUEL ELECTRIC POWER GENERATION.; FOSSIL FUEL ELECTRIC POWER GENERATION.; FOSSIL FUEL ELECTRIC POWER GENERATION.; FOSSIL FUEL ELECTRIC POWER GENERATION. Organizations: ALLEGHENY ENERGY SUPPLY CO., LLC (CONTACT/OPERATOR)
, ALLEGHENY ENERGY SUPPLY CO (CONTACT/OWNER)
, ALLEGHENY ENERGY UNIT 1 & UNIT 2 (CONTACT/OWNER)
, ALLEGHENY ENERGY SUPPLY CO., LLC (CONTACT/OWNER)
, ALLEGHENY ENERGY SUPPLY CO LLC (CONTACT/OWNER)
, ALLEGHENY ENERGY SUPPLY COMPANY, LLC (OWNER/OPERATOR)
, ALLEGHENY ENERGY SUPPLY CO LLC (OWNER/OPERATOR)
Alternative names: ALLEGHENY ENERGY SPRINGDALE POWER STA, ALLEGHENY ENERGY SUPPLY CO LLC, ALLEGHENY ENERGY SUPPLY LLC, ALLEGHENY ENERGY SUPPLY UNITS 3 4 & 5, ALLEGHENY ENERGY UNIT 1 AND, ALLEGHENY ENERGY UNIT 1 & UNIT, ALLEGHENY ENERGY UNIT 1 & UNIT 2, ALLEGHENY ENERGY UNITS 3-4-5, ALLEGHENY ENERGY UNITS 3, 4 & 5, CHAPMAN CORP AT ALGHNY ENERGY UNIT 3 4 5, SPRINGDALE, SPRINGDALE PS ALLEGHENY ENERGY, WEST PENN POWER COMPANY, X
Housing units lacking complete plumbing facilities: 1.6% Housing units lacking complete kitchen facilities: 2.6%
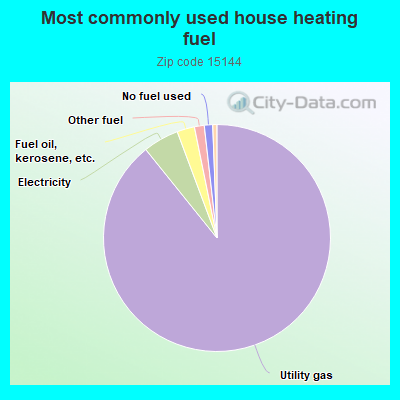
89.4%Utility gas
5.1%Electricity
2.5%Fuel oil, kerosene, etc.
1.4%Other fuel
1.2%No fuel used
0.6%Bottled, tank, or LP gas
Population in 1990: 4,858.
Place of birth for U.S.-born residents:
This state: 3,351
Northeast: 122
Midwest: 87
South: 152
West: 70
70% of the 15144 zip code residents lived in the same house 5 years ago. Out of people who lived in different houses, 69% lived in this county. Out of people who lived in different counties, 50% lived in Pennsylvania.
93% of the 15144 zip code residents lived in the same house 1 year ago. Out of people who lived in different houses, 67% moved from this county. Out of people who lived in different houses, 19% moved from different county within same state. Out of people who lived in different houses, 13% moved from different state.
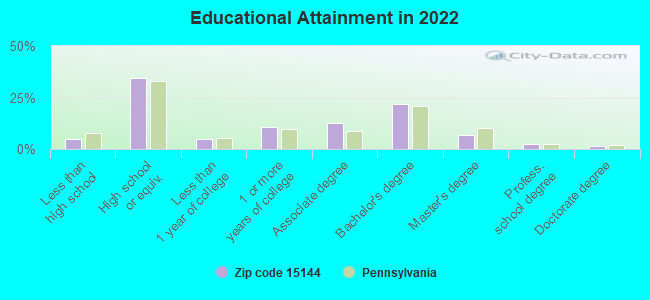
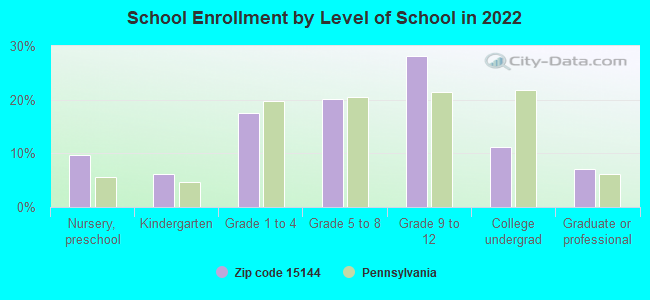
Private vs. public school enrollment:
Students in private schools in grades 1 to 8 (elementary and middle school): 46
Here:
17.1%
Pennsylvania:
15.7%
Students in private schools in grades 9 to 12 (high school): 17
Here:
8.9%
Pennsylvania:
13.4%
Students in private undergraduate colleges: 16
Here:
20.2%
Pennsylvania:
39.8%
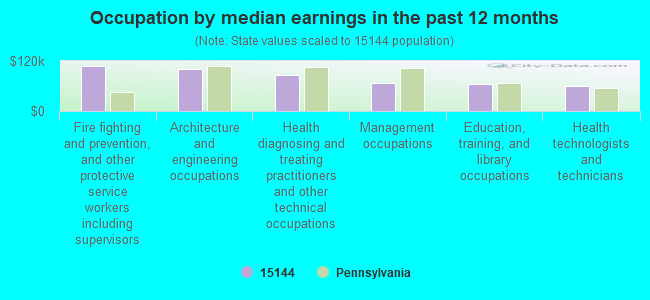
Occupation by median earnings in the past 12 months ($)
108,467Health diagnosing and treating practitioners and other technical occupations
101,352Fire fighting and prevention, and other protective service workers including supervisors
77,062Architecture and engineering occupations
68,899Management occupations
67,160Health technologists and technicians
56,878Business and financial operations occupations
Top industries in this zip code by the number of employees in 2005:
Professional, Scientific, and Technical Services: Research and Development in the Physical, Engineering, and Life Sciences (100-249 employees: 1 establishment)
Construction: Commercial and Institutional Building Construction (50-99: 1)
Other Services (except Public Administration): Beauty Salons (10-19: 1, 5-9: 2, 1-4: 1)
Other Services (except Public Administration): Religious Organizations (5-9: 2, 1-4: 2)
People in group quarters in 2000:
11 people in other noninstitutional group quarters
5 people in other group homes
Fatal accident statistics in 2014:
Fatal accident count: 1
Vehicles involved in fatal accidents: 2
Fatal accidents caused by drunken drivers: 0
Fatalities: 1
Persons involved in fatal accidents: 3
Pedestrians involved in fatal accidents: 0
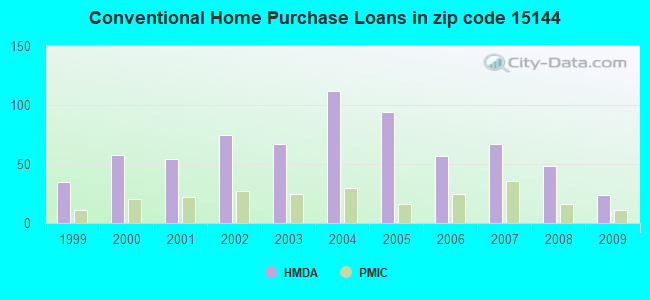
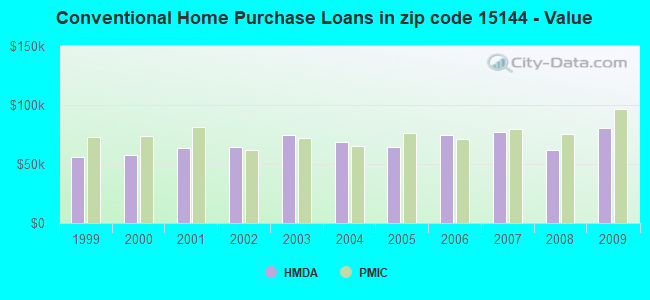
Home Mortgage Disclosure Act Aggregated Statistics For Year 2009 (Based on 2 full and 4 partial tracts)
A) FHA, FSA/RHS & VA Home Purchase Loans
B) Conventional Home Purchase Loans
C) Refinancings
D) Home Improvement Loans
F) Non-occupant Loans on < 5 Family Dwellings (A B C & D)
G) Loans On Manufactured Home Dwelling (A B C & D)
Number
Average Value
Number
Average Value
Number
Average Value
Number
Average Value
Number
Average Value
Number
Average Value
LOANS ORIGINATED
55
$82,841
24
$80,819
84
$83,891
24
$39,300
5
$62,824
2
$47,470
APPLICATIONS APPROVED, NOT ACCEPTED
2
$79,000
2
$44,000
17
$93,575
4
$10,092
0
$0
0
$0
APPLICATIONS DENIED
4
$54,000
4
$83,575
54
$90,110
12
$20,506
4
$45,000
3
$22,603
APPLICATIONS WITHDRAWN
3
$71,833
8
$55,204
29
$89,558
0
$0
2
$25,815
0
$0
FILES CLOSED FOR INCOMPLETENESS
0
$0
2
$31,645
9
$79,100
0
$0
0
$0
0
$0
Aggregated Statistics For Year 2008 (Based on 2 full and 4 partial tracts)
A) FHA, FSA/RHS & VA Home Purchase Loans
B) Conventional Home Purchase Loans
C) Refinancings
D) Home Improvement Loans
F) Non-occupant Loans on < 5 Family Dwellings (A B C & D)
G) Loans On Manufactured Home Dwelling (A B C & D)
Number
Average Value
Number
Average Value
Number
Average Value
Number
Average Value
Number
Average Value
Number
Average Value
LOANS ORIGINATED
30
$103,395
48
$62,103
65
$69,743
31
$36,135
12
$82,072
2
$23,360
APPLICATIONS APPROVED, NOT ACCEPTED
0
$0
2
$57,265
15
$87,523
6
$41,265
2
$54,000
0
$0
APPLICATIONS DENIED
2
$103,000
21
$86,169
80
$92,243
27
$62,638
5
$49,966
0
$0
APPLICATIONS WITHDRAWN
2
$49,730
7
$46,621
22
$84,861
5
$97,362
2
$47,000
0
$0
FILES CLOSED FOR INCOMPLETENESS
0
$0
0
$0
8
$91,250
2
$18,835
2
$76,000
0
$0
Aggregated Statistics For Year 2007 (Based on 2 full and 4 partial tracts)
A) FHA, FSA/RHS & VA Home Purchase Loans
B) Conventional Home Purchase Loans
C) Refinancings
D) Home Improvement Loans
E) Loans on Dwellings For 5+ Families
F) Non-occupant Loans on < 5 Family Dwellings (A B C & D)
Number
Average Value
Number
Average Value
Number
Average Value
Number
Average Value
Number
Average Value
Number
Average Value
LOANS ORIGINATED
8
$82,559
67
$77,085
71
$77,685
42
$27,439
0
$0
17
$69,789
APPLICATIONS APPROVED, NOT ACCEPTED
0
$0
7
$85,284
42
$74,149
3
$36,197
0
$0
2
$114,000
APPLICATIONS DENIED
2
$48,595
11
$86,453
140
$77,383
43
$54,557
2
$130,600
6
$68,438
APPLICATIONS WITHDRAWN
0
$0
3
$58,720
51
$97,478
4
$39,148
0
$0
4
$46,780
FILES CLOSED FOR INCOMPLETENESS
0
$0
0
$0
7
$86,737
2
$98,710
0
$0
0
$0
Aggregated Statistics For Year 2006 (Based on 2 full and 4 partial tracts)
A) FHA, FSA/RHS & VA Home Purchase Loans
B) Conventional Home Purchase Loans
C) Refinancings
D) Home Improvement Loans
E) Loans on Dwellings For 5+ Families
F) Non-occupant Loans on < 5 Family Dwellings (A B C & D)
G) Loans On Manufactured Home Dwelling (A B C & D)
Number
Average Value
Number
Average Value
Number
Average Value
Number
Average Value
Number
Average Value
Number
Average Value
Number
Average Value
LOANS ORIGINATED
9
$86,223
57
$74,655
126
$70,148
30
$26,058
2
$113,895
14
$53,763
3
$25,620
APPLICATIONS APPROVED, NOT ACCEPTED
0
$0
4
$84,500
42
$78,110
15
$23,496
0
$0
0
$0
2
$60,280
APPLICATIONS DENIED
0
$0
5
$52,142
145
$84,714
52
$46,357
0
$0
14
$57,653
2
$37,675
APPLICATIONS WITHDRAWN
0
$0
7
$70,266
54
$75,667
6
$13,588
0
$0
6
$65,502
0
$0
FILES CLOSED FOR INCOMPLETENESS
0
$0
0
$0
13
$89,547
2
$128,000
0
$0
2
$128,000
0
$0
Aggregated Statistics For Year 2005 (Based on 2 full and 4 partial tracts)
A) FHA, FSA/RHS & VA Home Purchase Loans
B) Conventional Home Purchase Loans
C) Refinancings
D) Home Improvement Loans
F) Non-occupant Loans on < 5 Family Dwellings (A B C & D)
G) Loans On Manufactured Home Dwelling (A B C & D)
Number
Average Value
Number
Average Value
Number
Average Value
Number
Average Value
Number
Average Value
Number
Average Value
LOANS ORIGINATED
9
$87,414
94
$64,083
163
$67,742
48
$41,275
26
$63,114
2
$12,810
APPLICATIONS APPROVED, NOT ACCEPTED
0
$0
9
$63,874
39
$70,668
9
$20,976
5
$67,424
0
$0
APPLICATIONS DENIED
6
$69,167
15
$32,519
166
$70,080
38
$28,835
17
$38,088
4
$17,878
APPLICATIONS WITHDRAWN
2
$78,000
15
$74,515
86
$79,536
11
$107,418
9
$57,482
0
$0
FILES CLOSED FOR INCOMPLETENESS
0
$0
5
$79,270
13
$79,755
0
$0
0
$0
0
$0
Aggregated Statistics For Year 2004 (Based on 2 full and 4 partial tracts)
A) FHA, FSA/RHS & VA Home Purchase Loans
B) Conventional Home Purchase Loans
C) Refinancings
D) Home Improvement Loans
F) Non-occupant Loans on < 5 Family Dwellings (A B C & D)
G) Loans On Manufactured Home Dwelling (A B C & D)
Number
Average Value
Number
Average Value
Number
Average Value
Number
Average Value
Number
Average Value
Number
Average Value
LOANS ORIGINATED
28
$79,012
112
$68,817
244
$67,965
47
$27,440
25
$51,412
2
$11,300
APPLICATIONS APPROVED, NOT ACCEPTED
6
$73,495
20
$81,336
49
$60,588
18
$27,156
6
$46,358
0
$0
APPLICATIONS DENIED
2
$74,595
15
$55,315
136
$74,213
18
$16,653
7
$933
5
$36,600
APPLICATIONS WITHDRAWN
4
$81,148
12
$102,533
79
$79,332
9
$27,310
2
$100,000
0
$0
FILES CLOSED FOR INCOMPLETENESS
0
$0
2
$26,575
20
$73,030
0
$0
0
$0
0
$0
Aggregated Statistics For Year 2003 (Based on 2 full and 4 partial tracts)
A) FHA, FSA/RHS & VA Home Purchase Loans
B) Conventional Home Purchase Loans
C) Refinancings
D) Home Improvement Loans
E) Loans on Dwellings For 5+ Families
F) Non-occupant Loans on < 5 Family Dwellings (A B C & D)
Number
Average Value
Number
Average Value
Number
Average Value
Number
Average Value
Number
Average Value
Number
Average Value
LOANS ORIGINATED
21
$76,940
67
$74,758
383
$65,223
48
$32,212
2
$53,150
23
$62,410
APPLICATIONS APPROVED, NOT ACCEPTED
0
$0
15
$74,806
95
$75,770
22
$27,130
0
$0
5
$83,916
APPLICATIONS DENIED
0
$0
27
$54,437
202
$75,605
36
$26,996
0
$0
19
$42,004
APPLICATIONS WITHDRAWN
0
$0
11
$99,123
79
$75,630
4
$10,378
0
$0
6
$35,383
FILES CLOSED FOR INCOMPLETENESS
0
$0
4
$56,000
9
$48,694
4
$60,000
0
$0
2
$39,000
Aggregated Statistics For Year 2002 (Based on 2 full and 4 partial tracts)
A) FHA, FSA/RHS & VA Home Purchase Loans
B) Conventional Home Purchase Loans
C) Refinancings
D) Home Improvement Loans
F) Non-occupant Loans on < 5 Family Dwellings (A B C & D)
Number
Average Value
Number
Average Value
Number
Average Value
Number
Average Value
Number
Average Value
LOANS ORIGINATED
32
$67,437
75
$64,767
243
$61,188
39
$18,188
24
$58,240
APPLICATIONS APPROVED, NOT ACCEPTED
2
$41,760
11
$69,876
76
$63,995
13
$28,709
2
$40,000
APPLICATIONS DENIED
0
$0
12
$49,086
152
$66,420
19
$27,913
2
$75,000
APPLICATIONS WITHDRAWN
0
$0
14
$53,626
74
$77,916
4
$32,255
9
$47,691
FILES CLOSED FOR INCOMPLETENESS
0
$0
7
$62,467
9
$54,771
0
$0
2
$18,225
Aggregated Statistics For Year 2001 (Based on 2 full and 4 partial tracts)
A) FHA, FSA/RHS & VA Home Purchase Loans
B) Conventional Home Purchase Loans
C) Refinancings
D) Home Improvement Loans
F) Non-occupant Loans on < 5 Family Dwellings (A B C & D)
Number
Average Value
Number
Average Value
Number
Average Value
Number
Average Value
Number
Average Value
LOANS ORIGINATED
34
$73,703
54
$63,582
260
$52,406
79
$23,436
14
$42,127
APPLICATIONS APPROVED, NOT ACCEPTED
0
$0
17
$50,434
60
$54,978
16
$19,802
3
$37,830
APPLICATIONS DENIED
2
$27,125
15
$53,916
150
$54,824
32
$26,263
9
$34,269
APPLICATIONS WITHDRAWN
2
$37,205
7
$51,633
60
$61,970
9
$33,193
0
$0
FILES CLOSED FOR INCOMPLETENESS
0
$0
0
$0
18
$63,772
0
$0
0
$0
Aggregated Statistics For Year 2000 (Based on 2 full and 4 partial tracts)
A) FHA, FSA/RHS & VA Home Purchase Loans
B) Conventional Home Purchase Loans
C) Refinancings
D) Home Improvement Loans
F) Non-occupant Loans on < 5 Family Dwellings (A B C & D)
Number
Average Value
Number
Average Value
Number
Average Value
Number
Average Value
Number
Average Value
LOANS ORIGINATED
35
$65,284
58
$57,529
142
$51,702
46
$19,688
11
$38,982
APPLICATIONS APPROVED, NOT ACCEPTED
2
$41,760
5
$73,812
35
$51,507
10
$9,615
0
$0
APPLICATIONS DENIED
2
$35,685
9
$56,713
90
$55,553
17
$14,533
4
$18,028
APPLICATIONS WITHDRAWN
2
$61,000
10
$58,030
45
$56,233
13
$22,735
2
$132,000
FILES CLOSED FOR INCOMPLETENESS
0
$0
6
$74,212
12
$56,145
2
$10,000
0
$0
Aggregated Statistics For Year 1999 (Based on 1 full and 2 partial tracts)
A) FHA, FSA/RHS & VA Home Purchase Loans
B) Conventional Home Purchase Loans
C) Refinancings
D) Home Improvement Loans
F) Non-occupant Loans on < 5 Family Dwellings (A B C & D)


 Nearest zip codes: 15049, 15030, 15068, 15075, 15139, 15014.