Estimated zip code population in 2022: 6,285 Zip code population in 2010: 6,262 Zip code population in 2000: 7,672
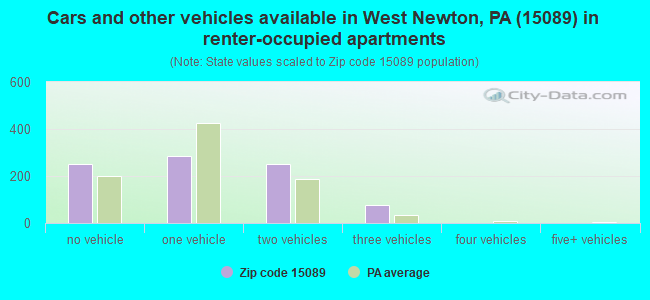
Houses and condos: 3,221 Renter-occupied apartments: 865
% of renters here:
29%
State:
31%
March 2022 cost of living index in zip code 15089: 89.5 (less than average, U.S. average is 100)
Land area: 19.1 sq. mi. Water area: 0.4 sq. mi.
Population density: 328 people per square mile
(very low).
OSM Map
General Map
Google Map
MSN Map
OSM Map
General Map
Google Map
MSN Map
OSM Map
General Map
Google Map
MSN Map
OSM Map
General Map
Google Map
MSN Map
Please wait while loading the map...
Real estate property taxes paid for housing units in 2022:
This zip code:
1.2% ($2,086)
Pennsylvania:
1.3% ($3,094)
Median real estate property taxes paid for housing units with mortgages in 2022: $2,151 (1.1%) Median real estate property taxes paid for housing units with no mortgage in 2022: $1,995 (1.2%)
Business Search- 14 Million verified businesses
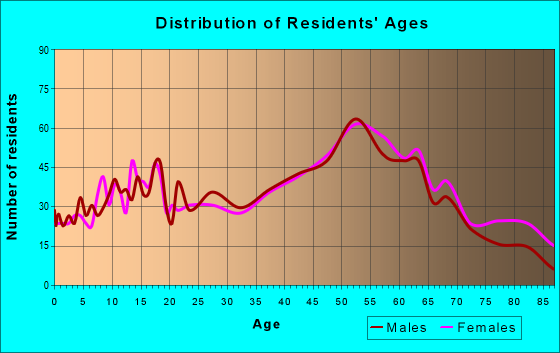
Males: 3,225
(51.3%)
Females: 3,060
(48.7%)
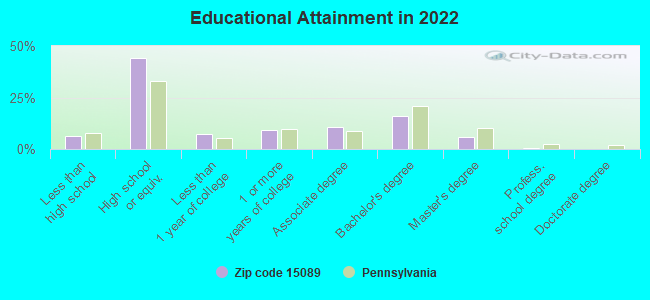
For population 25 years and over in 15089:
High school or higher: 93.6%
Bachelor's degree or higher: 22.3%
Graduate or professional degree: 6.1%
Unemployed: 6.9%
Mean travel time to work (commute): 29.4 minutes
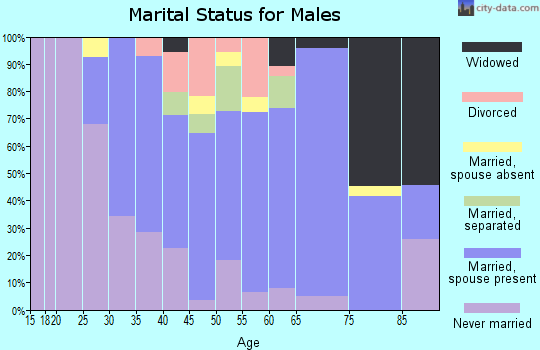
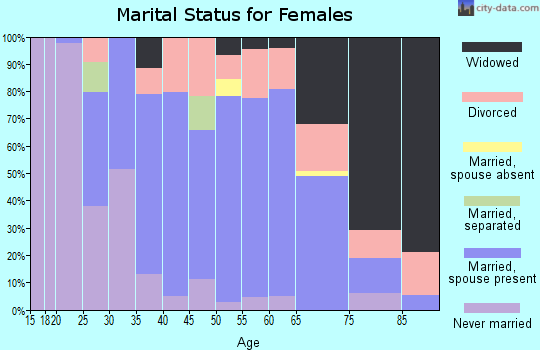
For population 15 years and over in 15089:
Never married: 26.2%
Now married: 52.2%
Separated: 0.6%
Widowed: 9.7%
Divorced: 11.4%
Zip code 15089 compared to state average:
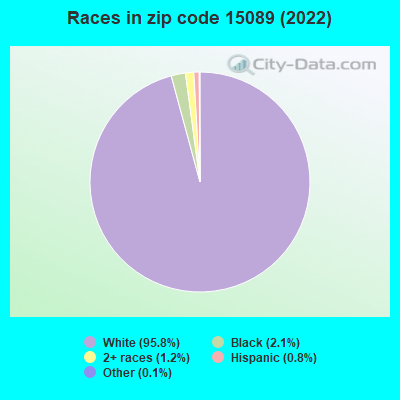
Black race population percentage significantly below state average.
Hispanic race population percentage significantly below state average.
Median age significantly above state average.
Foreign-born population percentage significantly below state average.
Length of stay since moving in significantly above state average.
Estimated median house/condo value in 2022: $177,776
15089:
$177,776
Pennsylvania:
$245,500
According to our research of Pennsylvania and other state lists, there were 6 registered sex offenders living in 15089 zip code as of April 27, 2024. The ratio of all residents to sex offenders in zip code 15089 is 1,040 to 1. The ratio of registered sex offenders to all residents in this zip code is lower than the state average.
Median resident age:
This zip code:
50.1 years
Pennsylvania median age:
40.9 years
Average household size:
This zip code:
2.1 people
Pennsylvania:
2.4 people
Averages for the 2020 tax year for zip code 15089, filed in 2021:
Average Adjusted Gross Income (AGI) in 2020: $57,699 (Individual Income Tax Returns)
Here:
$57,699
State:
$75,707
Salary/wage: $51,839 (reported on 79.0% of returns)
Here:
$51,839
State:
$62,806
(% of AGI for various income ranges: 1004.8% for AGIs below $25k, 3206.6% for AGIs $25k-50k, 5671.4% for AGIs $50k-75k, 8395.6% for AGIs $75k-100k, 15004.2% for AGIs $100k-200k)
Taxable interest for individuals: $877 (reported on 29.3% of returns)
This zip code:
$877
Pennsylvania:
$1,633
(% of AGI for various income ranges: 16.7% for AGIs below $25k, 15.2% for AGIs $25k-50k, 32.7% for AGIs $50k-75k, 66.0% for AGIs $75k-100k, 87.7% for AGIs $100k-200k)
Ordinary dividends: $2,305 (reported on 18.8% of returns)
Here:
$2,305
State:
$7,382
(% of AGI for various income ranges: 19.1% for AGIs below $25k, 29.1% for AGIs $25k-50k, 45.9% for AGIs $50k-75k, 51.6% for AGIs $75k-100k, 147.4% for AGIs $100k-200k)
Net capital gain/loss in AGI: +$6,700 (reported on 13.4% of returns)
Here:
+$6,700
State:
+$23,522
(% of AGI for various income ranges: 17.2% for AGIs below $25k, 25.2% for AGIs $25k-50k, 59.5% for AGIs $50k-75k, 97.6% for AGIs $75k-100k, 294.5% for AGIs $100k-200k)
Profit/loss from business: +$13,681 (reported on 9.9% of returns)
Here:
+$13,681
State:
+$16,274
(% of AGI for various income ranges: 61.9% for AGIs below $25k, 89.8% for AGIs $25k-50k, 209.2% for AGIs $50k-75k, 121.6% for AGIs $75k-100k, 701.0% for AGIs $100k-200k)
Taxable individual retirement arrangement distribution: $11,916 (reported on 11.8% of returns)
15089:
$11,916
Pennsylvania:
$18,583
(% of AGI for various income ranges: 91.2% for AGIs below $25k, 98.0% for AGIs $25k-50k, 211.6% for AGIs $50k-75k, 338.8% for AGIs $75k-100k, 497.1% for AGIs $100k-200k)
Total itemized deductions: $26,957 (reported on 2.2% of returns)
Here:
$26,957
State:
$34,850
(% of AGI for various income ranges: 161.6% for AGIs $50k-75k, 415.8% for AGIs $100k-200k)
Charity contributions: $8,540 (reported on 1.6% of returns)
Here:
$8,540
State:
$12,392
(% of AGI for various income ranges: 137.7% for AGIs $100k-200k)
Taxes paid: $7,386 (reported on 2.2% of returns)
15089:
$7,386
State:
$8,200
(% of AGI for various income ranges: 37.8% for AGIs $50k-75k, 121.6% for AGIs $100k-200k)
Earned income credit: $2,027 (reported on 10.5% of returns)
Here:
$2,027
State:
$2,100
(% of AGI for various income ranges: 58.8% for AGIs below $25k, 43.0% for AGIs $25k-50k)
Percentage of individuals using paid preparers for their 2020 taxes: 91.4%
Here:
91%
State:
92%
(% for various income ranges: 88.9% for AGIs below $25k, 92.5% for AGIs $25k-50k, 93.8% for AGIs $50k-75k, 91.4% for AGIs $75k-100k, 91.3% for AGIs $100k-200k, 100.0% for AGIs over 200k)
Averages for the 2012 tax year for zip code 15089, filed in 2013:
Average Adjusted Gross Income (AGI) in 2012: $47,255 (Individual Income Tax Returns)
Here:
$47,255
State:
$61,346
Salary/wage: $42,757 (reported on 81.9% of returns)
Here:
$42,757
State:
$51,902
(% of AGI for various income ranges: 66.4% for AGIs below $25k, 76.1% for AGIs $25k-50k, 76.2% for AGIs $50k-75k, 77.5% for AGIs $75k-100k, 77.6% for AGIs $100k-200k, 53.2% for AGIs over 200k)
Taxable interest for individuals: $775 (reported on 32.7% of returns)
This zip code:
$775
Pennsylvania:
$1,588
(% of AGI for various income ranges: 1.6% for AGIs below $25k, 0.6% for AGIs $25k-50k, 0.5% for AGIs $50k-75k, 0.3% for AGIs $75k-100k, 0.3% for AGIs $100k-200k, 0.2% for AGIs over 200k)
Ordinary dividends: $1,833 (reported on 19.9% of returns)
Here:
$1,833
State:
$5,827
(% of AGI for various income ranges: 1.2% for AGIs below $25k, 0.6% for AGIs $25k-50k, 0.8% for AGIs $50k-75k, 0.5% for AGIs $75k-100k, 1.1% for AGIs $100k-200k)
Net capital gain/loss in AGI: +$456 (reported on 10.6% of returns)
Here:
+$456
State:
+$14,495
(% of AGI for various income ranges: 0.1% for AGIs $25k-50k, 0.2% for AGIs $50k-75k, 0.1% for AGIs $75k-100k, 0.2% for AGIs $100k-200k)
Profit/loss from business: +$10,929 (reported on 10.6% of returns)
Here:
+$10,929
State:
+$16,268
(% of AGI for various income ranges: 4.1% for AGIs below $25k, 2.2% for AGIs $25k-50k, 1.4% for AGIs $50k-75k, 2.3% for AGIs $75k-100k, 3.6% for AGIs $100k-200k)
Taxable individual retirement arrangement distribution: $9,775 (reported on 11.2% of returns)
15089:
$9,775
Pennsylvania:
$14,550
(% of AGI for various income ranges: 3.9% for AGIs below $25k, 2.4% for AGIs $25k-50k, 2.1% for AGIs $50k-75k, 1.4% for AGIs $75k-100k, 3.3% for AGIs $100k-200k)
Total itemized deductions: $17,136 (18% of AGI, reported on 18.4% of returns)
Here:
$17,136
State:
$23,538
Here:
18.2% of AGI
State:
18.4% of AGI
(% of AGI for various income ranges: 3.7% for AGIs below $25k, 4.7% for AGIs $25k-50k, 5.7% for AGIs $50k-75k, 7.4% for AGIs $75k-100k, 9.4% for AGIs $100k-200k, 6.7% for AGIs over 200k)
Charity contributions: $2,577 (reported on 15.0% of returns)
Here:
$2,577
State:
$4,025
(% of AGI for various income ranges: 0.3% for AGIs below $25k, 0.6% for AGIs $25k-50k, 0.7% for AGIs $50k-75k, 0.8% for AGIs $75k-100k, 1.2% for AGIs $100k-200k, 1.3% for AGIs over 200k)
Taxes paid: $6,362 (reported on 18.1% of returns)
15089:
$6,362
State:
$9,982
(% of AGI for various income ranges: 0.7% for AGIs below $25k, 1.2% for AGIs $25k-50k, 1.7% for AGIs $50k-75k, 2.5% for AGIs $75k-100k, 4.0% for AGIs $100k-200k, 4.0% for AGIs over 200k)
Earned income credit: $1,805 (reported on 13.4% of returns)
Here:
$1,805
State:
$2,106
(% of AGI for various income ranges: 3.6% for AGIs below $25k, 0.9% for AGIs $25k-50k)
Percentage of individuals using paid preparers for their 2012 taxes: 51.7%
Here:
52%
State:
53%
(% for various income ranges: 48.8% for AGIs below $25k, 50.6% for AGIs $25k-50k, 53.1% for AGIs $50k-75k, 57.6% for AGIs $75k-100k, 56.7% for AGIs $100k-200k, 66.7% for AGIs over 200k)
Averages for the 2004 tax year for zip code 15089, filed in 2005:
Average Adjusted Gross Income (AGI) in 2004: $35,615 (Individual Income Tax Returns)
Here:
$35,615
State:
$48,049
Salary/wage: $34,296 (reported on 82.7% of returns)
Here:
$34,296
State:
$42,646
(% of AGI for various income ranges: 81.7% for AGIs below $10k, 70.4% for AGIs $10k-25k, 77.6% for AGIs $25k-50k, 85.5% for AGIs $50k-75k, 86.3% for AGIs $75k-100k, 72.6% for AGIs over 100k)
Taxable interest for individuals: $1,218 (reported on 46.7% of returns)
This zip code:
$1,218
Pennsylvania:
$1,657
(% of AGI for various income ranges: 5.4% for AGIs below $10k, 3.6% for AGIs $10k-25k, 1.6% for AGIs $25k-50k, 1.1% for AGIs $50k-75k, 0.6% for AGIs $75k-100k, 1.3% for AGIs over 100k)
Taxable dividends: $1,329 (reported on 23.2% of returns)
Here:
$1,329
State:
$3,566
(% of AGI for various income ranges: 3.1% for AGIs below $10k, 1.4% for AGIs $10k-25k, 0.6% for AGIs $25k-50k, 0.9% for AGIs $50k-75k, 0.6% for AGIs $75k-100k, 0.7% for AGIs over 100k)
Net capital gain/loss: +$1,546 (reported on 14.8% of returns)
Here:
+$1,546
State:
+$9,716
(% of AGI for various income ranges: -2.1% for AGIs below $10k, 0.2% for AGIs $10k-25k, 0.3% for AGIs $25k-50k, 0.2% for AGIs $50k-75k, 1.1% for AGIs $75k-100k, 2.3% for AGIs over 100k)
Profit/loss from business: +$10,091 (reported on 11.8% of returns)
Here:
+$10,091
State:
+$14,267
(% of AGI for various income ranges: 5.5% for AGIs below $10k, 4.2% for AGIs $10k-25k, 2.8% for AGIs $25k-50k, 2.0% for AGIs $50k-75k, 1.9% for AGIs $75k-100k, 7.3% for AGIs over 100k)
IRA payment deduction: $2,408 (reported on 3.0% of returns)
15089:
$2,408
Pennsylvania:
$2,903
(% of AGI for various income ranges: 0.3% for AGIs $10k-25k, 0.2% for AGIs $25k-50k, 0.2% for AGIs $50k-75k, 0.3% for AGIs $75k-100k)
Total itemized deductions: $13,858 (20% of AGI, reported on 20.1% of returns)
Here:
$13,858
State:
$18,804
Here:
20.0% of AGI
State:
19.5% of AGI
(% of AGI for various income ranges: 4.6% for AGIs $10k-25k, 6.9% for AGIs $25k-50k, 7.3% for AGIs $50k-75k, 10.7% for AGIs $75k-100k, 10.8% for AGIs over 100k)
Charity contributions deductions: $2,045 (3% of AGI, reported on 17.2% of returns)
Here:
$2,045
State:
$3,337
Here:
2.8% of AGI
State:
3.3% of AGI
(% of AGI for various income ranges: 0.4% for AGIs $10k-25k, 0.8% for AGIs $25k-50k, 0.9% for AGIs $50k-75k, 1.2% for AGIs $75k-100k, 1.8% for AGIs over 100k)
Total tax: $4,374 (reported on 74.3% of returns)
15089:
$4,374
State:
$8,008
(% of AGI for various income ranges: 2.4% for AGIs below $10k, 4.4% for AGIs $10k-25k, 7.1% for AGIs $25k-50k, 9.1% for AGIs $50k-75k, 10.4% for AGIs $75k-100k, 16.2% for AGIs over 100k)
Earned income credit: $1,465 (reported on 12.2% of returns)
Here:
$1,465
State:
$1,643
Percentage of individuals using paid preparers for their 2004 taxes: 53.9%
Here:
54%
State:
56%
(% for various income ranges: 49.4% for AGIs below $10k, 53.4% for AGIs $10k-25k, 55.4% for AGIs $25k-50k, 54.1% for AGIs $50k-75k, 54.7% for AGIs $75k-100k, 70.1% for AGIs over 100k)
Household received Food Stamps/SNAP in the past 12 months: 549 Household did not receive Food Stamps/SNAP in the past 12 months: 2,425
Women who had a birth in the past 12 months: 142 (45 now married, 85 unmarried) Women who did not have a birth in the past 12 months: 952 (484 now married, 464 unmarried)
Housing units in zip code 15089 with a mortgage: 1,071 (161 second mortgage, 161 both second mortgage and home equity loan) Houses without a mortgage: 83
Median monthly owner costs for units with a mortgage: $1,190 Median monthly owner costs for units without a mortgage: $566
Residents with income below the poverty level in 2022:
This zip code:
14.2%
Whole state:
11.8%
Residents with income below 50% of the poverty level in 2022:
This zip code:
7.9%
Whole state:
6.1%
Median number of rooms in houses and condos:
Here:
6.5
State:
6.8
Median number of rooms in apartments:
Here:
5.0
State:
4.3
Notable locations in this zip code not listed on our city pages
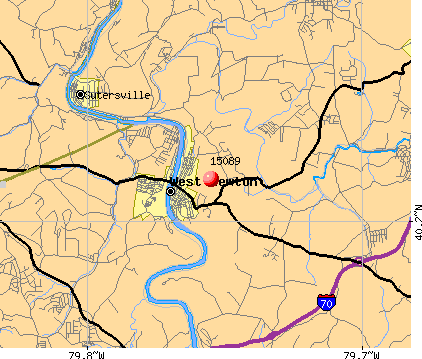
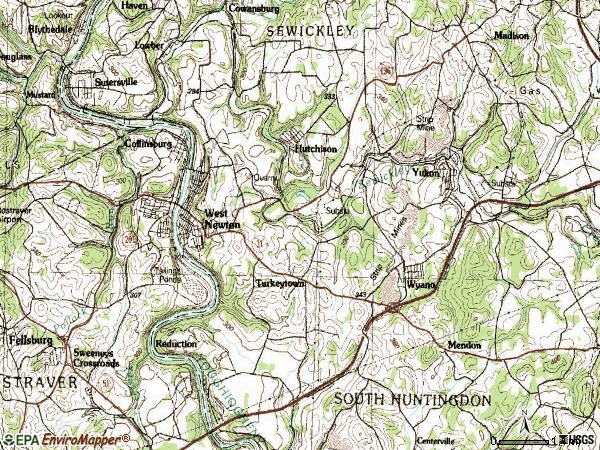
Notable locations in zip code 15089: Sewickley Grange (A), West Newton Borough Hall (B), West Newton Police Department (C), West Newton Volunteer Fire Department (D), Turkeytown Volunteer Fire Department (E), Collinsburg Volunteer Fire Company (F), Sewickley Township Volunteer Fire Company 4 (G). Display/hide their locations on the map
Churches in zip code 15089 include: Holy Family Church (A), Dick Church (B), First Church (C), Sewickley Church (D). Display/hide their locations on the map
Streams, rivers, and creeks: Hunters Run (A), Sewickley Creek (B), Kelly Run (C), Pollock Run (D), Painters Run (E). Display/hide their locations on the map
In group quarters: 10 (-1 institutionalized population)
Size of family households: 955 2-persons, 459 3-persons, 321 4-persons, 58 5-persons, 5 7-or-more-persons
Size of nonfamily households: 940 1-person, 215 2-persons, 14 4-persons
603 married couples with children.
367 single-parent households (249 men, 118 women).
98.0% of residents of 15089 zip code speak English at home.
1.1% of residents speak Spanish at home (100% very well).
0.5% of residents speak other Indo-European language at home (69% very well, 31% not well).
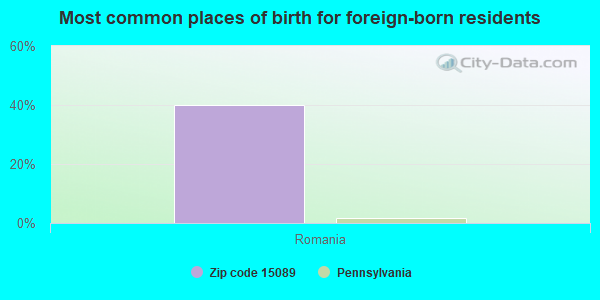
Foreign born population: 30 (0.5%) (100.0% of them are naturalized citizens)
This zip code:
0.5%
Whole state:
7.5%
40%Romania
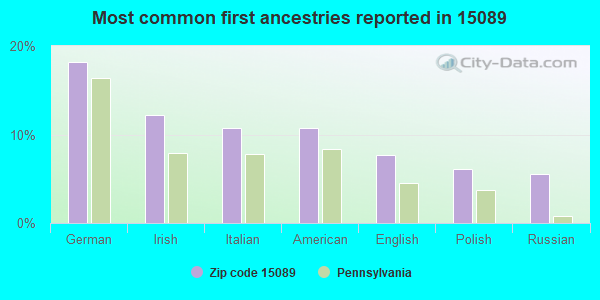
18%German
12%Irish
11%Italian
11%American
8%English
6%Polish
6%Russian
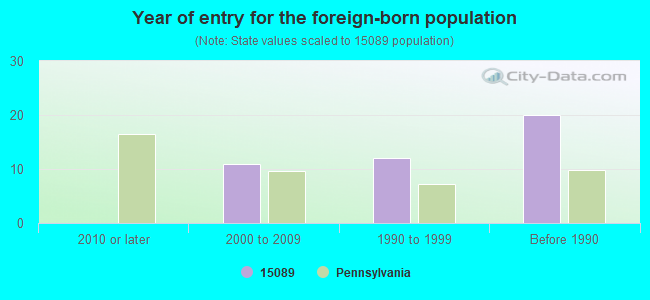
Year of entry for the foreign-born population
02010 or later
112000 to 2009
121990 to 1999
20Before 1990
Facilities with environmental interests located in this zip code:
BCNR CORP/DIV BANNING MINE (RD 2 in WEST NEWTON, PA)
ARTS AUTO BODY (556 SUTERSVILLE RD RT 136 W in WEST NEWTON, PA)
Conditionally Exempt Small Quantity Generators, less than 100 kg/month of hazardous waste (Resource Conservation and Recovery Act (tracking hazardous waste)) - notification Organizations: R & R AUTO RECYCLING (CONTACT/OWNER)
Housing units lacking complete plumbing facilities: 0.4% Housing units lacking complete kitchen facilities: 2.4%
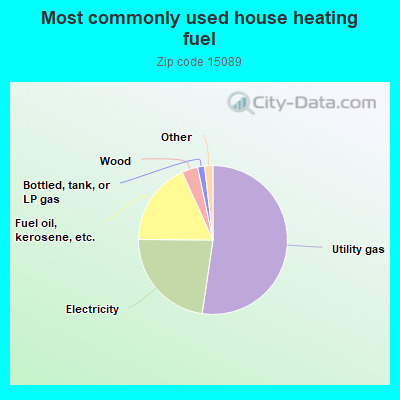
52.4%Utility gas
22.8%Electricity
18.1%Fuel oil, kerosene, etc.
3.5%Wood
1.5%Bottled, tank, or LP gas
0.7%Coal or coke
0.7%No fuel used
0.5%Other fuel
Population in 1990: 7,641. Population change in the 1990s: +31 (+0.4%).
Place of birth for U.S.-born residents:
This state: 5,564
Northeast: 168
Midwest: 74
South: 293
West: 91
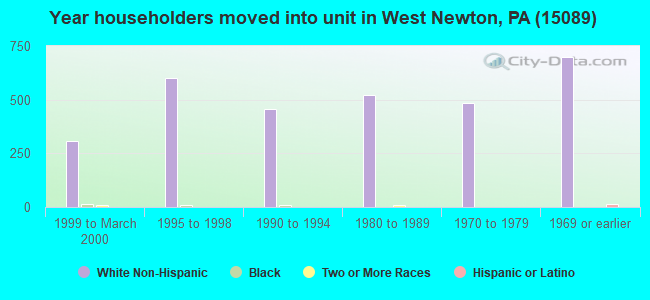
72% of the 15089 zip code residents lived in the same house 5 years ago. Out of people who lived in different houses, 75% lived in this county. Out of people who lived in different counties, 50% lived in Pennsylvania.
96% of the 15089 zip code residents lived in the same house 1 year ago. Out of people who lived in different houses, 33% moved from this county. Out of people who lived in different houses, 59% moved from different county within same state. Out of people who lived in different houses, 8% moved from different state. Out of people who lived in different houses, 7% moved from abroad.
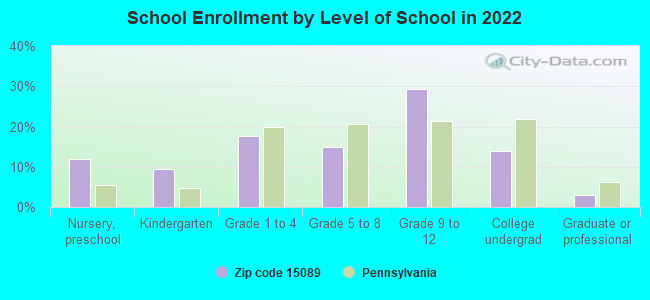
Private vs. public school enrollment:
Students in private schools in grades 1 to 8 (elementary and middle school):
Here:
0.0%
Pennsylvania:
15.7%
Students in private schools in grades 9 to 12 (high school):
Here:
0.0%
Pennsylvania:
13.4%
Students in private undergraduate colleges: 23
Here:
22.9%
Pennsylvania:
39.8%
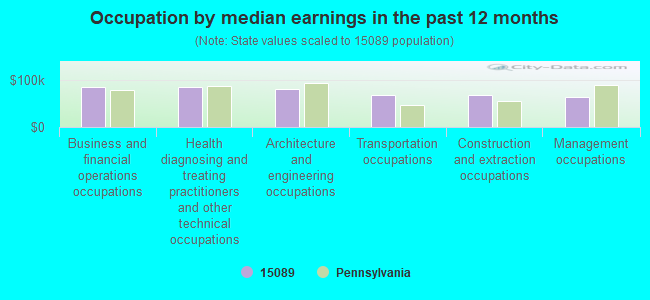
Occupation by median earnings in the past 12 months ($)
84,805Business and financial operations occupations
83,913Health diagnosing and treating practitioners and other technical occupations
80,427Architecture and engineering occupations
68,562Transportation occupations
66,664Construction and extraction occupations
62,620Management occupations
Top industries in this zip code by the number of employees in 2005:
Management of Companies and Enterprises: Corporate, Subsidiary, and Regional Managing Offices (50-99 employees: 2 establishments)
Administrative and Support and Waste Management and Remediation Services: Janitorial Services (50-99: 1, 1-4: 1)
Construction: Commercial and Institutional Building Construction (20-49: 1, 1-4: 1)
Accommodation and Food Services: Food Service Contractors (20-49: 1)
Finance and Insurance: Commercial Banking (10-19: 2)
People in group quarters in 2010:
4 people in group homes intended for adults
People in group quarters in 2000:
27 people in nursing homes
5 people in other noninstitutional group quarters
Fatal accident statistics in 2014:
Fatal accident count: 2
Vehicles involved in fatal accidents: 3
Fatal accidents caused by drunken drivers: 1
Fatalities: 2
Persons involved in fatal accidents: 4
Pedestrians involved in fatal accidents: 1
Fatal accident statistics in 2013:
Fatal accident count: 2
Vehicles involved in fatal accidents: 3
Fatal accidents caused by drunken drivers: 1
Fatalities: 2
Persons involved in fatal accidents: 5
Pedestrians involved in fatal accidents: 0
Home Mortgage Disclosure Act Aggregated Statistics For Year 2009 (Based on 10 partial tracts)
A) FHA, FSA/RHS & VA Home Purchase Loans
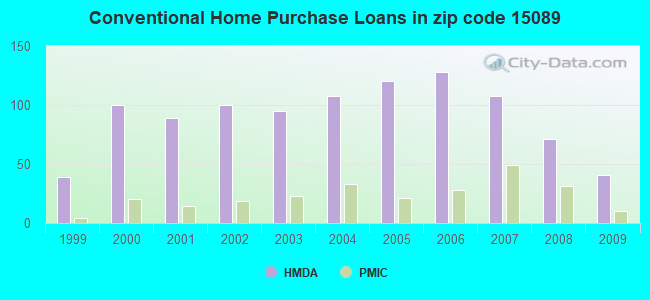
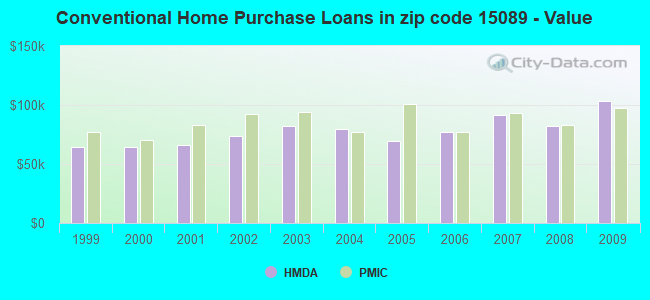
B) Conventional Home Purchase Loans
C) Refinancings
D) Home Improvement Loans
F) Non-occupant Loans on < 5 Family Dwellings (A B C & D)
G) Loans On Manufactured Home Dwelling (A B C & D)
Number
Average Value
Number
Average Value
Number
Average Value
Number
Average Value
Number
Average Value
Number
Average Value
LOANS ORIGINATED
53
$91,759
41
$103,446
133
$106,723
36
$31,263
9
$90,568
6
$73,793
APPLICATIONS APPROVED, NOT ACCEPTED
0
$0
0
$0
20
$92,486
4
$9,658
1
$54,050
0
$0
APPLICATIONS DENIED
1
$92,590
8
$72,761
92
$97,113
29
$20,317
2
$50,920
6
$63,075
APPLICATIONS WITHDRAWN
1
$55,070
8
$86,558
48
$120,089
3
$30,557
2
$62,100
0
$0
FILES CLOSED FOR INCOMPLETENESS
0
$0
0
$0
8
$113,976
0
$0
0
$0
0
$0
Aggregated Statistics For Year 2008 (Based on 10 partial tracts)
A) FHA, FSA/RHS & VA Home Purchase Loans
B) Conventional Home Purchase Loans
C) Refinancings
D) Home Improvement Loans
F) Non-occupant Loans on < 5 Family Dwellings (A B C & D)
G) Loans On Manufactured Home Dwelling (A B C & D)
Number
Average Value
Number
Average Value
Number
Average Value
Number
Average Value
Number
Average Value
Number
Average Value
LOANS ORIGINATED
31
$99,457
71
$82,430
103
$115,264
41
$40,799
18
$67,700
8
$80,402
APPLICATIONS APPROVED, NOT ACCEPTED
0
$0
6
$108,610
17
$99,472
6
$60,112
2
$13,700
5
$57,726
APPLICATIONS DENIED
2
$58,810
18
$79,001
133
$106,942
45
$56,581
7
$86,847
13
$65,838
APPLICATIONS WITHDRAWN
2
$58,870
4
$93,022
29
$142,834
4
$18,515
1
$165,960
0
$0
FILES CLOSED FOR INCOMPLETENESS
0
$0
0
$0
14
$112,235
4
$47,275
0
$0
0
$0
Aggregated Statistics For Year 2007 (Based on 10 partial tracts)
A) FHA, FSA/RHS & VA Home Purchase Loans
B) Conventional Home Purchase Loans
C) Refinancings
D) Home Improvement Loans
E) Loans on Dwellings For 5+ Families
F) Non-occupant Loans on < 5 Family Dwellings (A B C & D)
G) Loans On Manufactured Home Dwelling (A B C & D)
Number
Average Value
Number
Average Value
Number
Average Value
Number
Average Value
Number
Average Value
Number
Average Value
Number
Average Value
LOANS ORIGINATED
16
$80,163
108
$91,633
140
$80,027
73
$36,155
1
$141,950
14
$52,711
11
$60,511
APPLICATIONS APPROVED, NOT ACCEPTED
0
$0
10
$66,887
46
$82,161
13
$65,351
0
$0
7
$60,579
5
$53,904
APPLICATIONS DENIED
4
$77,670
26
$86,862
217
$88,307
47
$39,794
0
$0
19
$67,179
8
$72,389
APPLICATIONS WITHDRAWN
1
$69,350
11
$119,634
61
$101,227
6
$30,937
0
$0
6
$59,038
0
$0
FILES CLOSED FOR INCOMPLETENESS
0
$0
9
$116,859
10
$140,360
3
$42,723
0
$0
1
$56,280
0
$0
Aggregated Statistics For Year 2006 (Based on 10 partial tracts)
A) FHA, FSA/RHS & VA Home Purchase Loans
B) Conventional Home Purchase Loans
C) Refinancings
D) Home Improvement Loans
F) Non-occupant Loans on < 5 Family Dwellings (A B C & D)
G) Loans On Manufactured Home Dwelling (A B C & D)
Number
Average Value
Number
Average Value
Number
Average Value
Number
Average Value
Number
Average Value
Number
Average Value
LOANS ORIGINATED
16
$93,086
128
$77,414
209
$82,239
70
$35,215
25
$58,723
5
$41,432
APPLICATIONS APPROVED, NOT ACCEPTED
3
$45,947
22
$63,725
57
$73,515
7
$36,927
1
$96,910
2
$58,400
APPLICATIONS DENIED
3
$56,013
43
$62,428
238
$88,892
82
$36,488
7
$37,940
10
$56,476
APPLICATIONS WITHDRAWN
0
$0
25
$93,461
105
$88,360
6
$65,308
7
$67,316
3
$60,610
FILES CLOSED FOR INCOMPLETENESS
0
$0
5
$69,792
21
$124,354
2
$144,015
2
$101,285
0
$0
Aggregated Statistics For Year 2005 (Based on 10 partial tracts)
A) FHA, FSA/RHS & VA Home Purchase Loans
B) Conventional Home Purchase Loans
C) Refinancings
D) Home Improvement Loans
F) Non-occupant Loans on < 5 Family Dwellings (A B C & D)
G) Loans On Manufactured Home Dwelling (A B C & D)
Number
Average Value
Number
Average Value
Number
Average Value
Number
Average Value
Number
Average Value
Number
Average Value
LOANS ORIGINATED
7
$98,087
120
$69,910
238
$78,283
78
$37,943
22
$50,658
5
$59,552
APPLICATIONS APPROVED, NOT ACCEPTED
2
$58,445
19
$90,575
64
$73,654
8
$42,755
0
$0
3
$34,083
APPLICATIONS DENIED
0
$0
33
$98,205
300
$87,819
60
$37,956
18
$37,182
7
$83,849
APPLICATIONS WITHDRAWN
0
$0
16
$76,786
107
$93,988
17
$118,676
1
$46,900
0
$0
FILES CLOSED FOR INCOMPLETENESS
0
$0
6
$90,097
25
$90,455
3
$35,003
2
$59,360
0
$0
Aggregated Statistics For Year 2004 (Based on 10 partial tracts)
A) FHA, FSA/RHS & VA Home Purchase Loans
B) Conventional Home Purchase Loans
C) Refinancings
D) Home Improvement Loans
F) Non-occupant Loans on < 5 Family Dwellings (A B C & D)
G) Loans On Manufactured Home Dwelling (A B C & D)
Number
Average Value
Number
Average Value
Number
Average Value
Number
Average Value
Number
Average Value
Number
Average Value
LOANS ORIGINATED
13
$91,972
108
$80,026
301
$79,526
98
$30,789
31
$45,731
19
$55,877
APPLICATIONS APPROVED, NOT ACCEPTED
0
$0
18
$70,733
67
$79,364
28
$40,822
4
$47,582
6
$45,363
APPLICATIONS DENIED
2
$89,895
40
$76,064
294
$76,390
62
$29,138
26
$41,027
18
$52,867
APPLICATIONS WITHDRAWN
1
$109,440
17
$105,288
102
$106,861
15
$57,335
0
$0
6
$73,607
FILES CLOSED FOR INCOMPLETENESS
0
$0
1
$68,520
48
$88,893
3
$31,590
2
$58,445
1
$63,930
Aggregated Statistics For Year 2003 (Based on 10 partial tracts)
A) FHA, FSA/RHS & VA Home Purchase Loans
B) Conventional Home Purchase Loans
C) Refinancings
D) Home Improvement Loans
F) Non-occupant Loans on < 5 Family Dwellings (A B C & D)
Number
Average Value
Number
Average Value
Number
Average Value
Number
Average Value
Number
Average Value
LOANS ORIGINATED
21
$67,934
95
$82,611
533
$77,096
97
$29,962
19
$119,669
APPLICATIONS APPROVED, NOT ACCEPTED
0
$0
19
$84,624
116
$78,043
13
$38,162
7
$57,440
APPLICATIONS DENIED
2
$68,320
20
$77,805
272
$73,766
57
$32,676
11
$71,185
APPLICATIONS WITHDRAWN
1
$92,110
11
$73,353
123
$81,852
13
$27,791
5
$74,622
FILES CLOSED FOR INCOMPLETENESS
0
$0
0
$0
17
$90,795
4
$28,000
0
$0
Aggregated Statistics For Year 2002 (Based on 10 partial tracts)
A) FHA, FSA/RHS & VA Home Purchase Loans
B) Conventional Home Purchase Loans
C) Refinancings
D) Home Improvement Loans
E) Loans on Dwellings For 5+ Families
F) Non-occupant Loans on < 5 Family Dwellings (A B C & D)
Number
Average Value
Number
Average Value
Number
Average Value
Number
Average Value
Number
Average Value
Number
Average Value
LOANS ORIGINATED
23
$64,685
100
$73,499
359
$77,604
90
$27,242
1
$198,860
13
$50,550
APPLICATIONS APPROVED, NOT ACCEPTED
0
$0
19
$43,395
99
$69,902
20
$19,636
0
$0
3
$55,333
APPLICATIONS DENIED
2
$51,140
50
$46,617
236
$71,824
43
$20,333
0
$0
11
$46,671
APPLICATIONS WITHDRAWN
1
$80,670
14
$66,031
161
$75,733
12
$27,292
0
$0
7
$57,140
FILES CLOSED FOR INCOMPLETENESS
0
$0
4
$63,412
29
$108,052
0
$0
0
$0
3
$82,400
Aggregated Statistics For Year 2001 (Based on 10 partial tracts)
A) FHA, FSA/RHS & VA Home Purchase Loans
B) Conventional Home Purchase Loans
C) Refinancings
D) Home Improvement Loans
E) Loans on Dwellings For 5+ Families
F) Non-occupant Loans on < 5 Family Dwellings (A B C & D)
Number
Average Value
Number
Average Value
Number
Average Value
Number
Average Value
Number
Average Value
Number
Average Value
LOANS ORIGINATED
24
$63,080
89
$66,046
361
$62,088
101
$22,113
1
$429,540
16
$50,313
APPLICATIONS APPROVED, NOT ACCEPTED
2
$62,100
11
$40,741
112
$65,303
19
$30,184
0
$0
7
$44,877
APPLICATIONS DENIED
2
$63,010
39
$44,379
277
$59,909
74
$27,238
0
$0
7
$40,609
APPLICATIONS WITHDRAWN
5
$98,548
3
$66,403
141
$73,293
21
$27,101
0
$0
0
$0
FILES CLOSED FOR INCOMPLETENESS
0
$0
0
$0
23
$89,402
0
$0
0
$0
1
$138,700
Aggregated Statistics For Year 2000 (Based on 10 partial tracts)
A) FHA, FSA/RHS & VA Home Purchase Loans
B) Conventional Home Purchase Loans
C) Refinancings
D) Home Improvement Loans
E) Loans on Dwellings For 5+ Families
F) Non-occupant Loans on < 5 Family Dwellings (A B C & D)
Number
Average Value
Number
Average Value
Number
Average Value
Number
Average Value
Number
Average Value
Number
Average Value
LOANS ORIGINATED
34
$56,793
100
$64,638
186
$52,946
86
$22,953
1
$22,310
16
$39,656
APPLICATIONS APPROVED, NOT ACCEPTED
0
$0
13
$65,206
75
$47,188
30
$16,566
0
$0
0
$0
APPLICATIONS DENIED
4
$67,895
84
$43,817
172
$62,495
70
$16,340
0
$0
12
$26,795
APPLICATIONS WITHDRAWN
0
$0
8
$96,164
68
$51,488
12
$18,129
0
$0
1
$59,670
FILES CLOSED FOR INCOMPLETENESS
2
$93,145
3
$31,947
23
$76,772
2
$18,760
0
$0
2
$54,790
Aggregated Statistics For Year 1999 (Based on 5 partial tracts)
A) FHA, FSA/RHS & VA Home Purchase Loans
B) Conventional Home Purchase Loans
C) Refinancings
D) Home Improvement Loans
F) Non-occupant Loans on < 5 Family Dwellings (A B C & D)
2004 - 2018 National Fire Incident Reporting System (NFIRS) incidents
According to the data from the years 2004 - 2018 the average number of fires per year is 29. The highest number of fire incidents - 55 took place in 2006, and the least - 3 in 2004. The data has an increasing trend.
When looking into fire subcategories, the most incidents belonged to: Structure Fires (54.2%), and Outside Fires (18.5%).
Fire incident types reported to NFIRS in Zip Code 15089
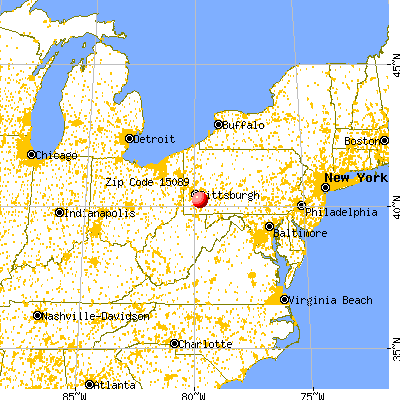


 Nearest zip codes: 15640, 15660, 15083, 15637, 15698, 15695.
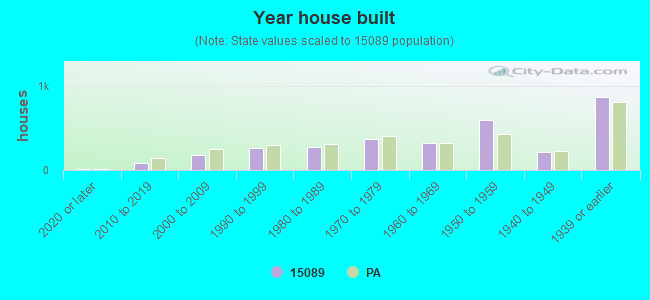


 According to the data from the years 2004 - 2018 the average number of fires per year is 29. The highest number of fire incidents - 55 took place in 2006, and the least - 3 in 2004. The data has an increasing trend.
 When looking into fire subcategories, the most incidents belonged to: Structure Fires (54.2%), and Outside Fires (18.5%).