Estimated zip code population in 2022: 985 Zip code population in 2010: 952 Zip code population in 2000: 801
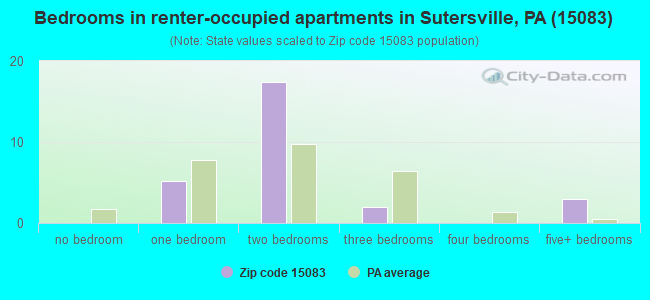
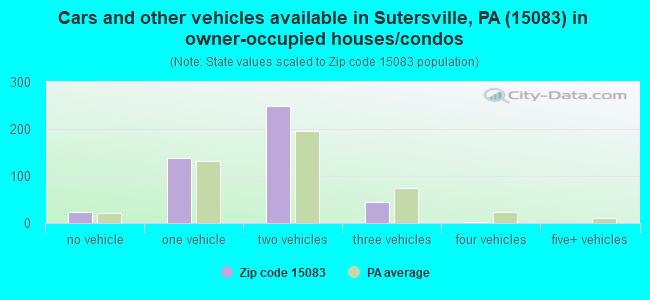
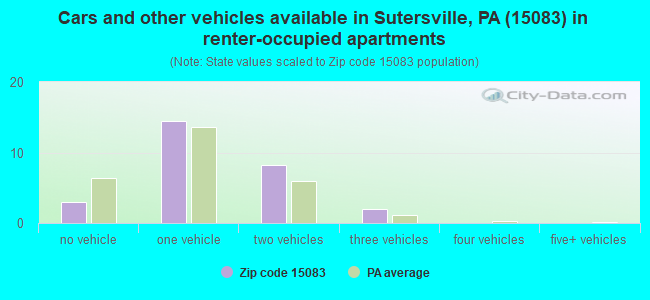
Houses and condos: 515 Renter-occupied apartments: 27
% of renters here:
6%
State:
31%
March 2022 cost of living index in zip code 15083: 89.0 (less than average, U.S. average is 100)
Land area: 3.7 sq. mi. Water area: 0.2 sq. mi.
Population density: 269 people per square mile
(very low).
OSM Map
General Map
Google Map
MSN Map
OSM Map
General Map
Google Map
MSN Map
OSM Map
General Map
Google Map
MSN Map
OSM Map
General Map
Google Map
MSN Map
Please wait while loading the map...
Real estate property taxes paid for housing units in 2022:
This zip code:
1.1% ($1,817)
Pennsylvania:
1.3% ($3,094)
Median real estate property taxes paid for housing units with mortgages in 2022: $2,750 (1.6%) Median real estate property taxes paid for housing units with no mortgage in 2022: $1,446 (1.3%)
Business Search- 14 Million verified businesses
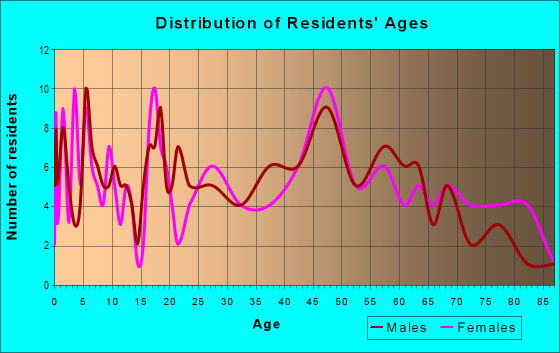
Males: 471
(47.8%)
Females: 514
(52.2%)
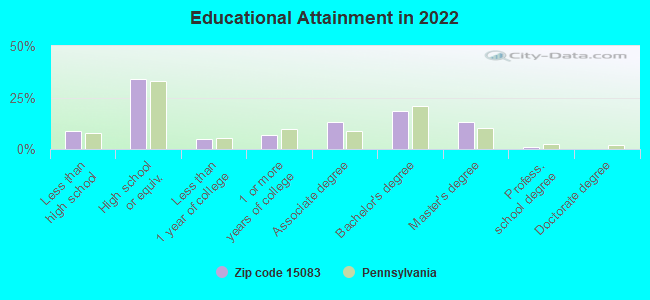
For population 25 years and over in 15083:
High school or higher: 88.7%
Bachelor's degree or higher: 31.7%
Graduate or professional degree: 13.7%
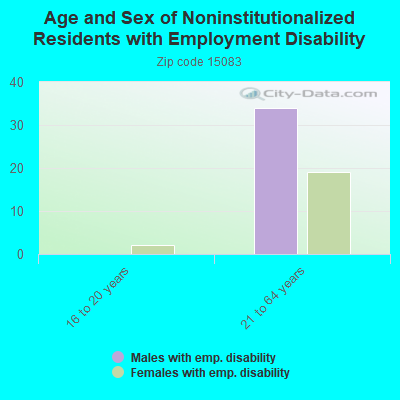
Unemployed: 1.8%
Mean travel time to work (commute): 34.7 minutes
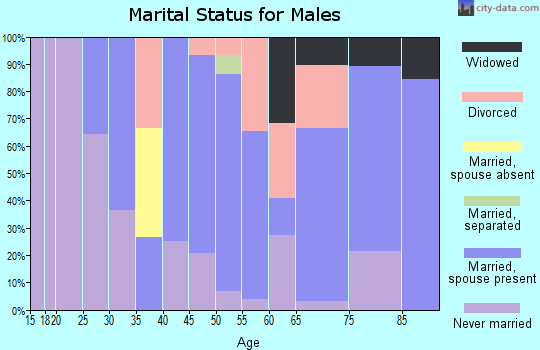
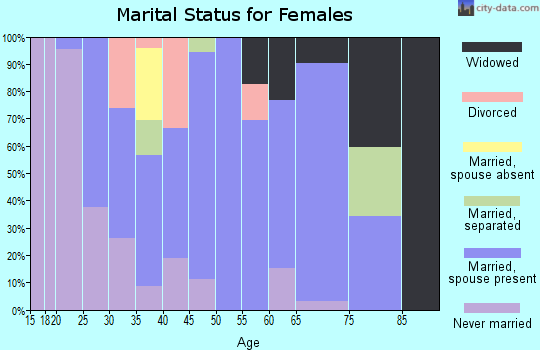
For population 15 years and over in 15083:
Never married: 26.4%
Now married: 44.4%
Separated: 0.2%
Widowed: 22.2%
Divorced: 6.8%
Zip code 15083 compared to state average:
Median house value below state average.
Unemployed percentage below state average.
Black race population percentage significantly below state average.
Hispanic race population percentage significantly below state average.
Median age significantly above state average.
Foreign-born population percentage significantly below state average.
Renting percentage significantly below state average.
Length of stay since moving in significantly above state average.
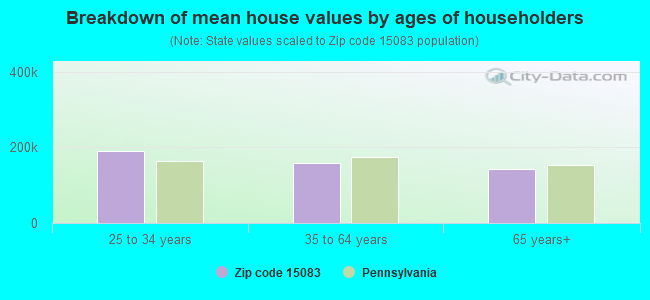
Estimated median house/condo value in 2022: $158,566
15083:
$158,566
Pennsylvania:
$245,500
According to our research of Pennsylvania and other state lists, there was 1 registered sex offender living in 15083 zip code as of April 27, 2024. The ratio of all residents to sex offenders in zip code 15083 is 862 to 1. The ratio of registered sex offenders to all residents in this zip code is lower than the state average.
Median resident age:
This zip code:
57.4 years
Pennsylvania median age:
40.9 years
Average household size:
This zip code:
2.0 people
Pennsylvania:
2.4 people
Averages for the 2020 tax year for zip code 15083, filed in 2021:
Average Adjusted Gross Income (AGI) in 2020: $53,720 (Individual Income Tax Returns)
Here:
$53,720
State:
$75,707
Salary/wage: $51,476 (reported on 77.6% of returns)
Here:
$51,476
State:
$62,806
(% of AGI for various income ranges: 1047.5% for AGIs below $25k, 3247.3% for AGIs $25k-50k, 6834.0% for AGIs $50k-75k, 9017.5% for AGIs $75k-100k, 20317.5% for AGIs $100k-200k)
Taxable interest for individuals: $564 (reported on 28.6% of returns)
This zip code:
$564
Pennsylvania:
$1,633
(% of AGI for various income ranges: 7.5% for AGIs below $25k, 8.2% for AGIs $25k-50k, 16.0% for AGIs $50k-75k, 140.0% for AGIs $100k-200k)
Ordinary dividends: $2,200 (reported on 14.3% of returns)
Here:
$2,200
State:
$7,382
(% of AGI for various income ranges: 23.8% for AGIs below $25k, 48.2% for AGIs $25k-50k, 205.0% for AGIs $100k-200k)
Net capital gain/loss in AGI: +$1,967 (reported on 12.2% of returns)
Here:
+$1,967
State:
+$23,522
(% of AGI for various income ranges: 40.0% for AGIs below $25k, 215.0% for AGIs $75k-100k)
Profit/loss from business: +$6,460 (reported on 10.2% of returns)
Here:
+$6,460
State:
+$16,274
(% of AGI for various income ranges: 293.6% for AGIs $25k-50k)
Taxable individual retirement arrangement distribution: $10,740 (reported on 10.2% of returns)
15083:
$10,740
Pennsylvania:
$18,583
(% of AGI for various income ranges: 225.0% for AGIs below $25k, 714.0% for AGIs $50k-75k)
Earned income credit: $1,840 (reported on 10.2% of returns)
Here:
$1,840
State:
$2,100
(% of AGI for various income ranges: 115.0% for AGIs below $25k)
Percentage of individuals using paid preparers for their 2020 taxes: 89.8%
Here:
90%
State:
92%
(% for various income ranges: 86.7% for AGIs below $25k, 92.9% for AGIs $25k-50k, 75.0% for AGIs $50k-75k, 100.0% for AGIs $75k-100k, 100.0% for AGIs $100k-200k)
Averages for the 2012 tax year for zip code 15083, filed in 2013:
Average Adjusted Gross Income (AGI) in 2012: $45,938 (Individual Income Tax Returns)
Here:
$45,938
State:
$61,346
Salary/wage: $43,745 (reported on 79.2% of returns)
Here:
$43,745
State:
$51,902
(% of AGI for various income ranges: 56.3% for AGIs below $25k, 76.1% for AGIs $25k-50k, 76.4% for AGIs $50k-75k, 75.5% for AGIs $75k-100k, 81.5% for AGIs $100k-200k)
Taxable interest for individuals: $514 (reported on 29.2% of returns)
This zip code:
$514
Pennsylvania:
$1,588
(% of AGI for various income ranges: 1.2% for AGIs below $25k, 0.4% for AGIs $25k-50k, 0.3% for AGIs $75k-100k, 0.2% for AGIs $100k-200k)
Ordinary dividends: $1,422 (reported on 18.8% of returns)
Here:
$1,422
State:
$5,827
(% of AGI for various income ranges: 0.6% for AGIs below $25k, 1.0% for AGIs $25k-50k, 1.5% for AGIs $75k-100k)
Profit/loss from business: +$6,240 (reported on 10.4% of returns)
Here:
+$6,240
State:
+$16,268
Taxable individual retirement arrangement distribution: $8,275 (reported on 16.7% of returns)
15083:
$8,275
Pennsylvania:
$14,550
Total itemized deductions: $18,625 (19% of AGI, reported on 16.7% of returns)
Here:
$18,625
State:
$23,538
Here:
18.5% of AGI
State:
18.4% of AGI
(% of AGI for various income ranges: 8.0% for AGIs $25k-50k, 11.0% for AGIs $75k-100k, 11.1% for AGIs $100k-200k)
Charity contributions: $2,717 (reported on 12.5% of returns)
Here:
$2,717
State:
$4,025
Taxes paid: $6,550 (reported on 16.7% of returns)
15083:
$6,550
State:
$9,982
(% of AGI for various income ranges: 2.1% for AGIs $25k-50k, 3.8% for AGIs $75k-100k, 4.5% for AGIs $100k-200k)
Earned income credit: $2,217 (reported on 12.5% of returns)
Here:
$2,217
State:
$2,106
(% of AGI for various income ranges: 5.7% for AGIs below $25k)
Percentage of individuals using paid preparers for their 2012 taxes: 47.9%
Here:
48%
State:
53%
(% for various income ranges: 47.4% for AGIs below $25k, 46.2% for AGIs $25k-50k, 50.0% for AGIs $50k-75k, 40.0% for AGIs $75k-100k, 66.7% for AGIs $100k-200k)
Averages for the 2004 tax year for zip code 15083, filed in 2005:
Average Adjusted Gross Income (AGI) in 2004: $36,288 (Individual Income Tax Returns)
Here:
$36,288
State:
$48,049
Salary/wage: $32,838 (reported on 80.3% of returns)
Here:
$32,838
State:
$42,646
(% of AGI for various income ranges: 69.9% for AGIs below $10k, 60.9% for AGIs $10k-25k, 77.3% for AGIs $25k-50k, 84.9% for AGIs $50k-75k, 84.9% for AGIs $75k-100k, 40.2% for AGIs over 100k)
Taxable interest for individuals: $927 (reported on 46.6% of returns)
This zip code:
$927
Pennsylvania:
$1,657
(% of AGI for various income ranges: 5.5% for AGIs below $10k, 3.8% for AGIs $10k-25k, 1.4% for AGIs $25k-50k, 0.4% for AGIs $50k-75k, 0.1% for AGIs $75k-100k, 0.4% for AGIs over 100k)
Taxable dividends: $1,225 (reported on 23.7% of returns)
Here:
$1,225
State:
$3,566
(% of AGI for various income ranges: 3.9% for AGIs below $10k, 1.0% for AGIs $10k-25k, 1.2% for AGIs $25k-50k, 0.5% for AGIs $50k-75k, 0.7% for AGIs $75k-100k)
Profit/loss from business: +$7,532 (reported on 10.0% of returns)
Here:
+$7,532
State:
+$14,267
IRA payment deduction: $1,900 (reported on 2.1% of returns)
15083:
$1,900
Pennsylvania:
$2,903
Total itemized deductions: $14,909 (19% of AGI, reported on 16.5% of returns)
Here:
$14,909
State:
$18,804
Here:
19.3% of AGI
State:
19.5% of AGI
(% of AGI for various income ranges: 4.7% for AGIs $25k-50k, 11.3% for AGIs $50k-75k, 8.5% for AGIs $75k-100k, 8.3% for AGIs over 100k)
Charity contributions deductions: $1,848 (2% of AGI, reported on 14.1% of returns)
Here:
$1,848
State:
$3,337
Here:
2.3% of AGI
State:
3.3% of AGI
(% of AGI for various income ranges: 0.3% for AGIs $25k-50k, 0.9% for AGIs $50k-75k, 0.7% for AGIs $75k-100k, 1.9% for AGIs over 100k)
Total tax: $4,426 (reported on 79.3% of returns)
15083:
$4,426
State:
$8,008
(% of AGI for various income ranges: 1.8% for AGIs below $10k, 4.3% for AGIs $10k-25k, 7.1% for AGIs $25k-50k, 8.2% for AGIs $50k-75k, 10.6% for AGIs $75k-100k, 22.4% for AGIs over 100k)
Earned income credit: $1,269 (reported on 11.1% of returns)
Here:
$1,269
State:
$1,643
Percentage of individuals using paid preparers for their 2004 taxes: 55.3%
Here:
55%
State:
56%
(% for various income ranges: 50.0% for AGIs below $10k, 58.4% for AGIs $10k-25k, 55.9% for AGIs $25k-50k, 56.5% for AGIs $50k-75k, 79.3% for AGIs $75k-100k)
Size of family households: 173 2-persons, 85 3-persons, 23 4-persons, 15 5-persons, 2 7-or-more-persons
Size of nonfamily households: 154 1-person, 29 2-persons, 2 3-persons
75 married couples with children.
34 single-parent households (31 men, 3 women).
99.4% of residents of 15083 zip code speak English at home.
0.6% of residents speak Spanish at home (67% very well, 33% well).
0.2% of residents speak Asian or Pacific Island language at home (100% very well).
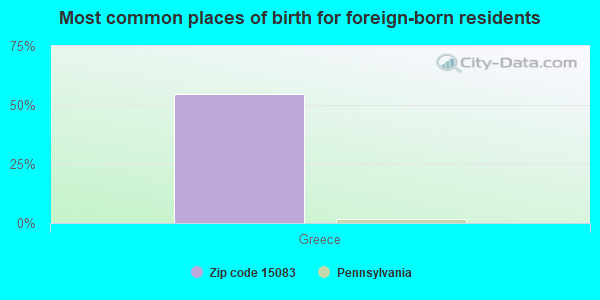
Foreign born population: 11 (1.2%) (73.5% of them are naturalized citizens)
This zip code:
1.2%
Whole state:
7.5%
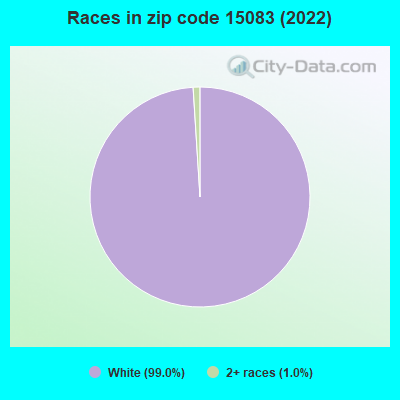
55%Greece
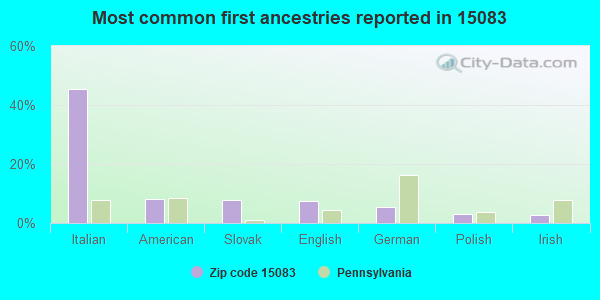
45%Italian
8%American
8%Slovak
7%English
5%German
3%Polish
3%Irish
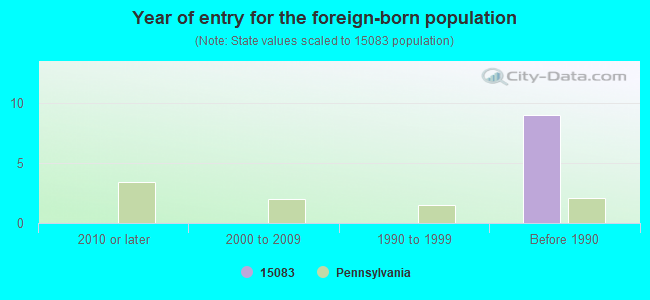
Year of entry for the foreign-born population
02010 or later
02000 to 2009
01990 to 1999
9Before 1990
Housing units lacking complete plumbing facilities: 2.5% Housing units lacking complete kitchen facilities: 4.1%
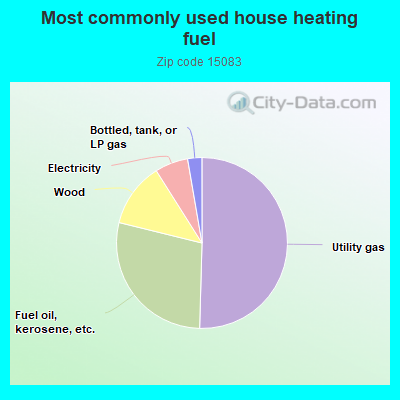
50.6%Utility gas
28.5%Fuel oil, kerosene, etc.
12.2%Wood
6.3%Electricity
2.7%Bottled, tank, or LP gas
Population in 1990: 1,467.
Place of birth for U.S.-born residents:
This state: 760
Northeast: 78
Midwest: 11
South: 14
West: 111
77% of the 15083 zip code residents lived in the same house 5 years ago. Out of people who lived in different houses, 80% lived in this county.
98% of the 15083 zip code residents lived in the same house 1 year ago. Out of people who lived in different houses, 46% moved from this county. Out of people who lived in different houses, 69% moved from different county within same state.
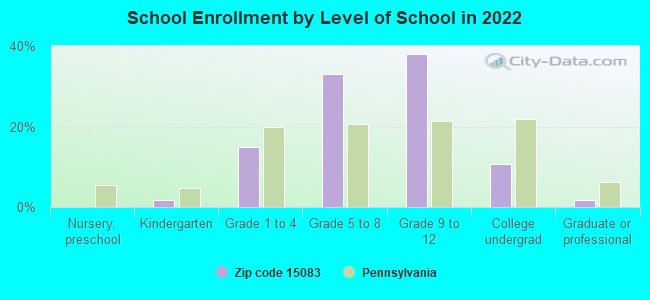
Private vs. public school enrollment:
Students in private schools in grades 1 to 8 (elementary and middle school):
Here:
0.0%
Pennsylvania:
15.7%
Students in private schools in grades 9 to 12 (high school): 17
Here:
37.7%
Pennsylvania:
13.4%
Students in private undergraduate colleges:
Here:
0.0%
Pennsylvania:
39.8%
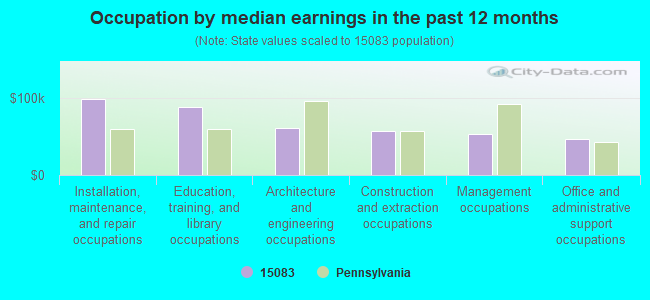
Occupation by median earnings in the past 12 months ($)
99,223Installation, maintenance, and repair occupations
88,718Education, training, and library occupations
61,976Architecture and engineering occupations
56,928Construction and extraction occupations
54,046Management occupations
47,079Office and administrative support occupations
Top industries in this zip code by the number of employees in 2005:
Wholesale Trade: Farm and Garden Machinery and Equipment Merchant Wholesalers (20-49 employees: 1 establishment)
Construction: Framing Contractors (10-19: 1)
Health Care and Social Assistance: Offices of Physicians (except Mental Health Specialists) (10-19: 1)
Accommodation and Food Services: Drinking Places (Alcoholic Beverages) (5-9: 1)
Accommodation and Food Services: Limited-Service Restaurants (1-4: 1)
Accommodation and Food Services: Snack and Nonalcoholic Beverage Bars (1-4: 1)
Home Mortgage Disclosure Act Aggregated Statistics For Year 2009 (Based on 2 partial tracts)
A) FHA, FSA/RHS & VA Home Purchase Loans
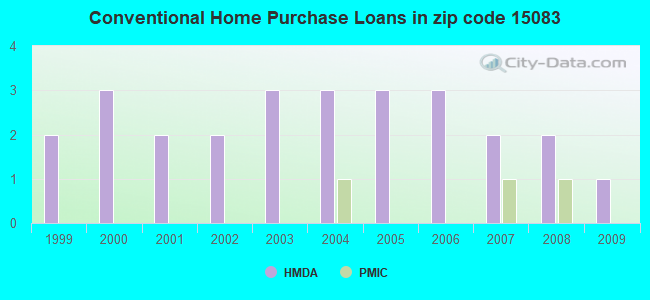
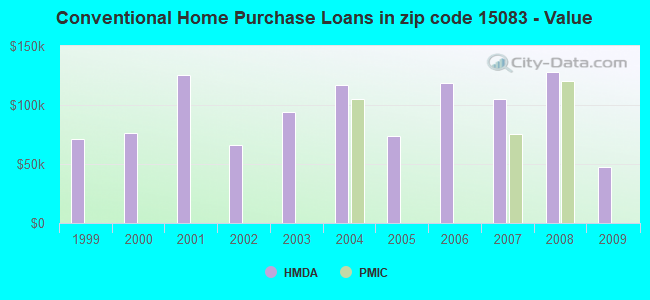
B) Conventional Home Purchase Loans
C) Refinancings
D) Home Improvement Loans
Number
Average Value
Number
Average Value
Number
Average Value
Number
Average Value
LOANS ORIGINATED
1
$93,070
1
$47,740
4
$139,455
1
$68,370
APPLICATIONS APPROVED, NOT ACCEPTED
0
$0
0
$0
1
$99,090
0
$0
APPLICATIONS DENIED
0
$0
0
$0
2
$137,195
1
$26,510
APPLICATIONS WITHDRAWN
0
$0
0
$0
0
$0
0
$0
FILES CLOSED FOR INCOMPLETENESS
0
$0
0
$0
0
$0
0
$0
Aggregated Statistics For Year 2008 (Based on 2 partial tracts)
A) FHA, FSA/RHS & VA Home Purchase Loans
B) Conventional Home Purchase Loans
C) Refinancings
D) Home Improvement Loans
F) Non-occupant Loans on < 5 Family Dwellings (A B C & D)
Number
Average Value
Number
Average Value
Number
Average Value
Number
Average Value
Number
Average Value
LOANS ORIGINATED
1
$93,670
2
$127,785
3
$150,400
2
$56,625
0
$0
APPLICATIONS APPROVED, NOT ACCEPTED
0
$0
0
$0
0
$0
0
$0
0
$0
APPLICATIONS DENIED
0
$0
0
$0
3
$114,857
2
$26,505
1
$29,370
APPLICATIONS WITHDRAWN
0
$0
0
$0
1
$150,000
0
$0
0
$0
FILES CLOSED FOR INCOMPLETENESS
0
$0
0
$0
0
$0
0
$0
0
$0
Aggregated Statistics For Year 2007 (Based on 2 partial tracts)
A) FHA, FSA/RHS & VA Home Purchase Loans
B) Conventional Home Purchase Loans
C) Refinancings
D) Home Improvement Loans
G) Loans On Manufactured Home Dwelling (A B C & D)
Number
Average Value
Number
Average Value
Number
Average Value
Number
Average Value
Number
Average Value
LOANS ORIGINATED
1
$85,540
2
$105,045
4
$100,715
3
$33,483
1
$38,250
APPLICATIONS APPROVED, NOT ACCEPTED
0
$0
1
$60,240
1
$47,890
0
$0
0
$0
APPLICATIONS DENIED
0
$0
0
$0
5
$82,438
1
$21,690
1
$40,810
APPLICATIONS WITHDRAWN
0
$0
0
$0
1
$157,830
0
$0
0
$0
FILES CLOSED FOR INCOMPLETENESS
0
$0
0
$0
0
$0
0
$0
0
$0
Aggregated Statistics For Year 2006 (Based on 2 partial tracts)
B) Conventional Home Purchase Loans
C) Refinancings
D) Home Improvement Loans
F) Non-occupant Loans on < 5 Family Dwellings (A B C & D)
G) Loans On Manufactured Home Dwelling (A B C & D)
Number
Average Value
Number
Average Value
Number
Average Value
Number
Average Value
Number
Average Value
LOANS ORIGINATED
3
$118,823
6
$76,405
2
$15,510
1
$38,100
0
$0
APPLICATIONS APPROVED, NOT ACCEPTED
0
$0
1
$113,700
1
$20,780
0
$0
0
$0
APPLICATIONS DENIED
1
$113,850
6
$91,565
2
$31,025
0
$0
1
$39,460
APPLICATIONS WITHDRAWN
0
$0
2
$92,845
0
$0
0
$0
0
$0
FILES CLOSED FOR INCOMPLETENESS
0
$0
1
$54,670
0
$0
0
$0
0
$0
Aggregated Statistics For Year 2005 (Based on 2 partial tracts)
B) Conventional Home Purchase Loans
C) Refinancings
D) Home Improvement Loans
G) Loans On Manufactured Home Dwelling (A B C & D)
Number
Average Value
Number
Average Value
Number
Average Value
Number
Average Value
LOANS ORIGINATED
3
$74,097
7
$88,209
3
$50,250
0
$0
APPLICATIONS APPROVED, NOT ACCEPTED
0
$0
1
$138,250
0
$0
0
$0
APPLICATIONS DENIED
1
$56,630
5
$73,010
1
$58,730
1
$19,730
APPLICATIONS WITHDRAWN
1
$136,740
3
$105,320
0
$0
0
$0
FILES CLOSED FOR INCOMPLETENESS
0
$0
1
$52,560
0
$0
0
$0
Aggregated Statistics For Year 2004 (Based on 2 partial tracts)
B) Conventional Home Purchase Loans
C) Refinancings
D) Home Improvement Loans
G) Loans On Manufactured Home Dwelling (A B C & D)
Number
Average Value
Number
Average Value
Number
Average Value
Number
Average Value
LOANS ORIGINATED
3
$116,867
8
$89,024
2
$50,525
0
$0
APPLICATIONS APPROVED, NOT ACCEPTED
0
$0
2
$86,745
0
$0
0
$0
APPLICATIONS DENIED
2
$58,660
6
$83,307
1
$37,200
1
$55,870
APPLICATIONS WITHDRAWN
1
$58,880
5
$134,878
0
$0
0
$0
FILES CLOSED FOR INCOMPLETENESS
0
$0
1
$74,550
0
$0
0
$0
Aggregated Statistics For Year 2003 (Based on 2 partial tracts)
B) Conventional Home Purchase Loans
C) Refinancings
D) Home Improvement Loans
F) Non-occupant Loans on < 5 Family Dwellings (A B C & D)
Number
Average Value
Number
Average Value
Number
Average Value
Number
Average Value
LOANS ORIGINATED
3
$93,873
13
$96,500
2
$62,350
0
$0
APPLICATIONS APPROVED, NOT ACCEPTED
1
$85,390
3
$140,410
0
$0
0
$0
APPLICATIONS DENIED
1
$90,960
6
$137,222
2
$12,050
1
$15,810
APPLICATIONS WITHDRAWN
0
$0
5
$102,016
0
$0
0
$0
FILES CLOSED FOR INCOMPLETENESS
0
$0
1
$91,560
0
$0
0
$0
Aggregated Statistics For Year 2002 (Based on 2 partial tracts)
B) Conventional Home Purchase Loans
C) Refinancings
D) Home Improvement Loans
Number
Average Value
Number
Average Value
Number
Average Value
LOANS ORIGINATED
2
$66,265
10
$79,682
2
$28,765
APPLICATIONS APPROVED, NOT ACCEPTED
0
$0
2
$72,965
0
$0
APPLICATIONS DENIED
1
$23,040
6
$71,837
0
$0
APPLICATIONS WITHDRAWN
0
$0
3
$77,460
0
$0
FILES CLOSED FOR INCOMPLETENESS
0
$0
1
$77,410
0
$0
Aggregated Statistics For Year 2001 (Based on 2 partial tracts)
A) FHA, FSA/RHS & VA Home Purchase Loans
B) Conventional Home Purchase Loans
C) Refinancings
D) Home Improvement Loans
F) Non-occupant Loans on < 5 Family Dwellings (A B C & D)
Number
Average Value
Number
Average Value
Number
Average Value
Number
Average Value
Number
Average Value
LOANS ORIGINATED
1
$48,340
2
$125,225
7
$61,831
2
$18,900
1
$37,950
APPLICATIONS APPROVED, NOT ACCEPTED
0
$0
0
$0
2
$63,480
0
$0
0
$0
APPLICATIONS DENIED
0
$0
1
$37,500
5
$71,474
2
$10,165
0
$0
APPLICATIONS WITHDRAWN
0
$0
0
$0
3
$61,547
0
$0
0
$0
FILES CLOSED FOR INCOMPLETENESS
0
$0
0
$0
0
$0
0
$0
0
$0
Aggregated Statistics For Year 2000 (Based on 2 partial tracts)
B) Conventional Home Purchase Loans
C) Refinancings
D) Home Improvement Loans
Number
Average Value
Number
Average Value
Number
Average Value
LOANS ORIGINATED
3
$76,303
5
$67,620
2
$21,385
APPLICATIONS APPROVED, NOT ACCEPTED
0
$0
0
$0
0
$0
APPLICATIONS DENIED
1
$20,030
3
$59,287
1
$19,580
APPLICATIONS WITHDRAWN
0
$0
1
$50,600
0
$0
FILES CLOSED FOR INCOMPLETENESS
0
$0
0
$0
0
$0
Aggregated Statistics For Year 1999 (Based on 1 partial tract)
Detailed PMIC statistics for the following Tracts:8051.00
2004 - 2018 National Fire Incident Reporting System (NFIRS) incidents
Based on the data from the years 2004 - 2018 the average number of fires per year is 13. The highest number of fires - 40 took place in 2011, and the least - 3 in 2012. The data has an increasing trend.
When looking into fire subcategories, the most reports belonged to: Structure Fires (54.3%), and Other (24.6%).
Fire incident types reported to NFIRS in Zip Code 15083


 Nearest zip codes: 15018, 15660, 15028, 15089, 15135, 15047.
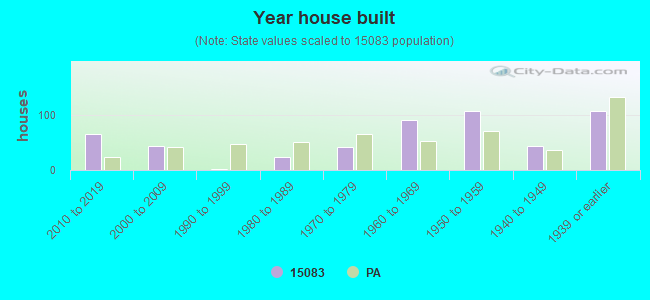


 Based on the data from the years 2004 - 2018 the average number of fires per year is 13. The highest number of fires - 40 took place in 2011, and the least - 3 in 2012. The data has an increasing trend.
 When looking into fire subcategories, the most reports belonged to: Structure Fires (54.3%), and Other (24.6%).