Estimated zip code population in 2022: 12,999 Zip code population in 2010: 12,713 Zip code population in 2000: 14,326
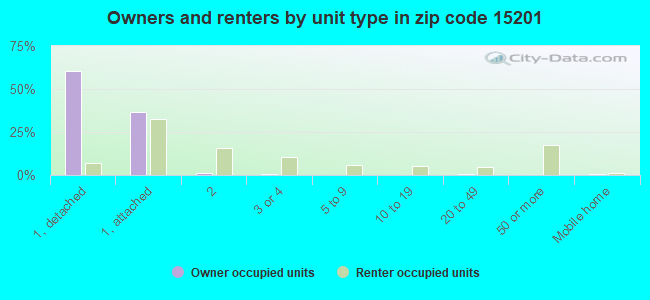
Houses and condos: 7,745 Renter-occupied apartments: 3,179
% of renters here:
46%
State:
31%
March 2022 cost of living index in zip code 15201: 95.5 (near average, U.S. average is 100)
Land area: 2.5 sq. mi. Water area: 0.3 sq. mi.
Population density: 5,242 people per square mile
(average).
OSM Map
General Map
Google Map
MSN Map
OSM Map
General Map
Google Map
MSN Map
OSM Map
General Map
Google Map
MSN Map
OSM Map
General Map
Google Map
MSN Map
Please wait while loading the map...
Real estate property taxes paid for housing units in 2022:
This zip code:
0.7% ($1,789)
Pennsylvania:
1.3% ($3,094)
Median real estate property taxes paid for housing units with mortgages in 2022: $1,948 (0.7%) Median real estate property taxes paid for housing units with no mortgage in 2022: $1,374 (0.7%)
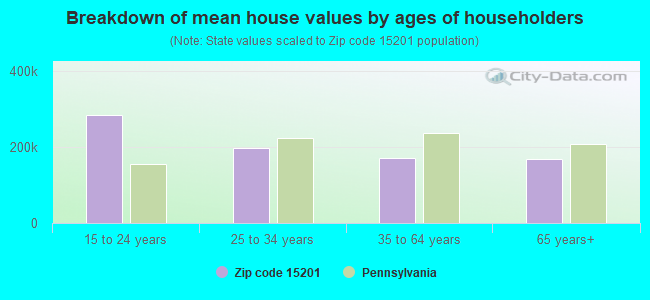
Estimated median house/condo value in 2022: $254,508
15201:
$254,508
Pennsylvania:
$245,500
According to our research of Pennsylvania and other state lists, there were 17 registered sex offenders living in 15201 zip code as of April 27, 2024. The ratio of all residents to sex offenders in zip code 15201 is 764 to 1. The ratio of registered sex offenders to all residents in this zip code is lower than the state average.
Median resident age:
This zip code:
35.7 years
Pennsylvania median age:
40.9 years
Average household size:
This zip code:
1.9 people
Pennsylvania:
2.4 people
Averages for the 2020 tax year for zip code 15201, filed in 2021:
Average Adjusted Gross Income (AGI) in 2020: $76,046 (Individual Income Tax Returns)
Here:
$76,046
State:
$75,707
Salary/wage: $72,712 (reported on 86.3% of returns)
Here:
$72,712
State:
$62,806
(% of AGI for various income ranges: 1058.8% for AGIs below $25k, 3746.9% for AGIs $25k-50k, 6902.9% for AGIs $50k-75k, 10376.4% for AGIs $75k-100k, 19410.0% for AGIs $100k-200k, 90901.9% for AGIs over 200k)
Taxable interest for individuals: $718 (reported on 32.4% of returns)
This zip code:
$718
Pennsylvania:
$1,633
(% of AGI for various income ranges: 14.1% for AGIs below $25k, 11.9% for AGIs $25k-50k, 26.6% for AGIs $50k-75k, 33.7% for AGIs $75k-100k, 77.3% for AGIs $100k-200k, 265.0% for AGIs over 200k)
Ordinary dividends: $3,364 (reported on 25.6% of returns)
Here:
$3,364
State:
$7,382
(% of AGI for various income ranges: 24.8% for AGIs below $25k, 30.8% for AGIs $25k-50k, 48.0% for AGIs $50k-75k, 113.4% for AGIs $75k-100k, 292.0% for AGIs $100k-200k, 1742.5% for AGIs over 200k)
Net capital gain/loss in AGI: +$8,936 (reported on 22.6% of returns)
Here:
+$8,936
State:
+$23,522
(% of AGI for various income ranges: 19.8% for AGIs below $25k, 24.6% for AGIs $25k-50k, 100.0% for AGIs $50k-75k, 158.5% for AGIs $75k-100k, 629.1% for AGIs $100k-200k, 5558.8% for AGIs over 200k)
Profit/loss from business: +$12,673 (reported on 13.5% of returns)
Here:
+$12,673
State:
+$16,274
(% of AGI for various income ranges: 91.1% for AGIs below $25k, 119.6% for AGIs $25k-50k, 119.0% for AGIs $50k-75k, 222.5% for AGIs $75k-100k, 720.0% for AGIs $100k-200k, 1768.8% for AGIs over 200k)
Taxable individual retirement arrangement distribution: $14,006 (reported on 6.5% of returns)
15201:
$14,006
Pennsylvania:
$18,583
(% of AGI for various income ranges: 57.7% for AGIs below $25k, 58.5% for AGIs $25k-50k, 72.9% for AGIs $50k-75k, 151.4% for AGIs $75k-100k, 339.8% for AGIs $100k-200k, 937.5% for AGIs over 200k)
Self-employed (Keogh) retirement plans: $23,150 (reported on 0.5% of returns)
15201:
$23,150
Pennsylvania:
$25,407
(% of AGI for various income ranges: 19.6% for AGIs $25k-50k, 380.0% for AGIs over 200k)
Total itemized deductions: $26,210 (reported on 7.8% of returns)
Here:
$26,210
State:
$34,850
(% of AGI for various income ranges: 54.2% for AGIs $25k-50k, 114.3% for AGIs $50k-75k, 339.7% for AGIs $75k-100k, 716.7% for AGIs $100k-200k, 4453.1% for AGIs over 200k)
Charity contributions: $7,109 (reported on 5.6% of returns)
Here:
$7,109
State:
$12,392
(% of AGI for various income ranges: 17.7% for AGIs $50k-75k, 55.1% for AGIs $75k-100k, 115.5% for AGIs $100k-200k, 1155.0% for AGIs over 200k)
Taxes paid: $8,290 (reported on 7.8% of returns)
15201:
$8,290
State:
$8,200
(% of AGI for various income ranges: 9.3% for AGIs $25k-50k, 34.3% for AGIs $50k-75k, 128.1% for AGIs $75k-100k, 279.2% for AGIs $100k-200k, 1216.2% for AGIs over 200k)
Earned income credit: $1,362 (reported on 7.7% of returns)
Here:
$1,362
State:
$2,100
(% of AGI for various income ranges: 37.1% for AGIs below $25k, 21.1% for AGIs $25k-50k)
Percentage of individuals using paid preparers for their 2020 taxes: 92.9%
Here:
93%
State:
92%
(% for various income ranges: 89.8% for AGIs below $25k, 93.1% for AGIs $25k-50k, 93.6% for AGIs $50k-75k, 94.0% for AGIs $75k-100k, 94.5% for AGIs $100k-200k, 96.0% for AGIs over 200k)
Averages for the 2012 tax year for zip code 15201, filed in 2013:
Average Adjusted Gross Income (AGI) in 2012: $40,968 (Individual Income Tax Returns)
Here:
$40,968
State:
$61,346
Salary/wage: $38,412 (reported on 86.0% of returns)
Here:
$38,412
State:
$51,902
(% of AGI for various income ranges: 77.2% for AGIs below $25k, 86.5% for AGIs $25k-50k, 81.9% for AGIs $50k-75k, 82.4% for AGIs $75k-100k, 80.6% for AGIs $100k-200k, 61.2% for AGIs over 200k)
Taxable interest for individuals: $802 (reported on 26.4% of returns)
This zip code:
$802
Pennsylvania:
$1,588
(% of AGI for various income ranges: 0.9% for AGIs below $25k, 0.3% for AGIs $25k-50k, 0.5% for AGIs $50k-75k, 0.3% for AGIs $75k-100k, 0.8% for AGIs $100k-200k, 0.2% for AGIs over 200k)
Ordinary dividends: $2,356 (reported on 16.1% of returns)
Here:
$2,356
State:
$5,827
(% of AGI for various income ranges: 1.2% for AGIs below $25k, 0.8% for AGIs $25k-50k, 0.9% for AGIs $50k-75k, 0.7% for AGIs $75k-100k, 0.9% for AGIs $100k-200k, 1.6% for AGIs over 200k)
Net capital gain/loss in AGI: +$3,533 (reported on 9.8% of returns)
Here:
+$3,533
State:
+$14,495
(% of AGI for various income ranges: 0.2% for AGIs $25k-50k, 0.3% for AGIs $50k-75k, 0.3% for AGIs $75k-100k, 1.2% for AGIs $100k-200k, 5.9% for AGIs over 200k)
Profit/loss from business: +$9,801 (reported on 11.5% of returns)
Here:
+$9,801
State:
+$16,268
(% of AGI for various income ranges: 4.6% for AGIs below $25k, 2.3% for AGIs $25k-50k, 2.3% for AGIs $50k-75k, 1.8% for AGIs $75k-100k, 4.7% for AGIs $100k-200k)
Taxable individual retirement arrangement distribution: $8,829 (reported on 6.9% of returns)
15201:
$8,829
Pennsylvania:
$14,550
(% of AGI for various income ranges: 2.3% for AGIs below $25k, 1.1% for AGIs $25k-50k, 1.4% for AGIs $50k-75k, 1.2% for AGIs $75k-100k, 2.5% for AGIs $100k-200k)
Self-employment retirement plans: $14,467 (reported on 0.4% of returns)
15201:
$14,467
Pennsylvania:
$20,922
Total itemized deductions: $15,468 (18% of AGI, reported on 18.5% of returns)
Here:
$15,468
State:
$23,538
Here:
18.3% of AGI
State:
18.4% of AGI
(% of AGI for various income ranges: 3.4% for AGIs below $25k, 4.3% for AGIs $25k-50k, 7.3% for AGIs $50k-75k, 8.8% for AGIs $75k-100k, 10.4% for AGIs $100k-200k, 10.3% for AGIs over 200k)
Charity contributions: $2,852 (reported on 14.0% of returns)
Here:
$2,852
State:
$4,025
(% of AGI for various income ranges: 0.3% for AGIs below $25k, 0.5% for AGIs $25k-50k, 1.0% for AGIs $50k-75k, 1.2% for AGIs $75k-100k, 1.7% for AGIs $100k-200k, 1.7% for AGIs over 200k)
Taxes paid: $6,570 (reported on 18.4% of returns)
15201:
$6,570
State:
$9,982
(% of AGI for various income ranges: 0.9% for AGIs below $25k, 1.4% for AGIs $25k-50k, 2.8% for AGIs $50k-75k, 3.9% for AGIs $75k-100k, 5.1% for AGIs $100k-200k, 5.8% for AGIs over 200k)
Earned income credit: $1,727 (reported on 16.3% of returns)
Here:
$1,727
State:
$2,106
(% of AGI for various income ranges: 4.1% for AGIs below $25k, 0.5% for AGIs $25k-50k)
Percentage of individuals using paid preparers for their 2012 taxes: 37.3%
Here:
37%
State:
53%
(% for various income ranges: 35.9% for AGIs below $25k, 32.7% for AGIs $25k-50k, 41.8% for AGIs $50k-75k, 44.9% for AGIs $75k-100k, 47.4% for AGIs $100k-200k, 71.4% for AGIs over 200k)
Averages for the 2004 tax year for zip code 15201, filed in 2005:
Average Adjusted Gross Income (AGI) in 2004: $30,104 (Individual Income Tax Returns)
Here:
$30,104
State:
$48,049
Salary/wage: $29,645 (reported on 83.4% of returns)
Here:
$29,645
State:
$42,646
(% of AGI for various income ranges: 83.5% for AGIs below $10k, 77.5% for AGIs $10k-25k, 84.2% for AGIs $25k-50k, 82.6% for AGIs $50k-75k, 84.6% for AGIs $75k-100k, 78.9% for AGIs over 100k)
Taxable interest for individuals: $1,444 (reported on 38.0% of returns)
This zip code:
$1,444
Pennsylvania:
$1,657
(% of AGI for various income ranges: 4.9% for AGIs below $10k, 2.5% for AGIs $10k-25k, 1.6% for AGIs $25k-50k, 1.4% for AGIs $50k-75k, 0.9% for AGIs $75k-100k, 2.4% for AGIs over 100k)
Taxable dividends: $1,759 (reported on 17.1% of returns)
Here:
$1,759
State:
$3,566
(% of AGI for various income ranges: 2.5% for AGIs below $10k, 1.1% for AGIs $10k-25k, 1.0% for AGIs $25k-50k, 0.8% for AGIs $50k-75k, 0.7% for AGIs $75k-100k, 1.2% for AGIs over 100k)
Net capital gain/loss: +$2,041 (reported on 11.1% of returns)
Here:
+$2,041
State:
+$9,716
(% of AGI for various income ranges: -1.5% for AGIs below $10k, 0.2% for AGIs $10k-25k, 0.3% for AGIs $25k-50k, 0.4% for AGIs $50k-75k, 0.9% for AGIs $75k-100k, 4.3% for AGIs over 100k)
Profit/loss from business: +$6,456 (reported on 8.8% of returns)
Here:
+$6,456
State:
+$14,267
(% of AGI for various income ranges: 6.6% for AGIs below $10k, 2.8% for AGIs $10k-25k, 1.0% for AGIs $25k-50k, 1.7% for AGIs $50k-75k, 1.8% for AGIs $75k-100k, 2.1% for AGIs over 100k)
IRA payment deduction: $2,295 (reported on 2.0% of returns)
15201:
$2,295
Pennsylvania:
$2,903
Total itemized deductions: $13,361 (22% of AGI, reported on 19.2% of returns)
Here:
$13,361
State:
$18,804
Here:
21.8% of AGI
State:
19.5% of AGI
(% of AGI for various income ranges: 3.5% for AGIs below $10k, 3.7% for AGIs $10k-25k, 6.8% for AGIs $25k-50k, 10.6% for AGIs $50k-75k, 13.1% for AGIs $75k-100k, 13.2% for AGIs over 100k)
Charity contributions deductions: $2,410 (4% of AGI, reported on 16.8% of returns)
Here:
$2,410
State:
$3,337
Here:
3.8% of AGI
State:
3.3% of AGI
(% of AGI for various income ranges: 0.3% for AGIs below $10k, 0.4% for AGIs $10k-25k, 1.0% for AGIs $25k-50k, 1.7% for AGIs $50k-75k, 2.0% for AGIs $75k-100k, 2.8% for AGIs over 100k)
Total tax: $3,821 (reported on 69.8% of returns)
15201:
$3,821
State:
$8,008
(% of AGI for various income ranges: 1.9% for AGIs below $10k, 4.0% for AGIs $10k-25k, 7.5% for AGIs $25k-50k, 10.5% for AGIs $50k-75k, 11.1% for AGIs $75k-100k, 16.8% for AGIs over 100k)
Earned income credit: $1,643 (reported on 19.6% of returns)
Here:
$1,643
State:
$1,643
Percentage of individuals using paid preparers for their 2004 taxes: 48.6%
Here:
49%
State:
56%
(% for various income ranges: 45.3% for AGIs below $10k, 49.8% for AGIs $10k-25k, 47.2% for AGIs $25k-50k, 53.4% for AGIs $50k-75k, 50.5% for AGIs $75k-100k, 56.5% for AGIs over 100k)
Likely homosexual households (counted as self-reported same-sex unmarried-partner households)
Lesbian couples: 0.7% of all households
Gay men: 0.7% of all households
Household received Food Stamps/SNAP in the past 12 months: 518 Household did not receive Food Stamps/SNAP in the past 12 months: 6,394
Women who had a birth in the past 12 months: 65 (38 now married, 25 unmarried) Women who did not have a birth in the past 12 months: 3,871 (945 now married, 2,946 unmarried)
Housing units in zip code 15201 with a mortgage: 2,331 (242 second mortgage, 15 home equity loan, 193 both second mortgage and home equity loan) Houses without a mortgage: 157
Median monthly owner costs for units with a mortgage: $1,452 Median monthly owner costs for units without a mortgage: $471
Residents with income below the poverty level in 2022:
This zip code:
12.6%
Whole state:
11.8%
Residents with income below 50% of the poverty level in 2022:
This zip code:
6.8%
Whole state:
6.1%
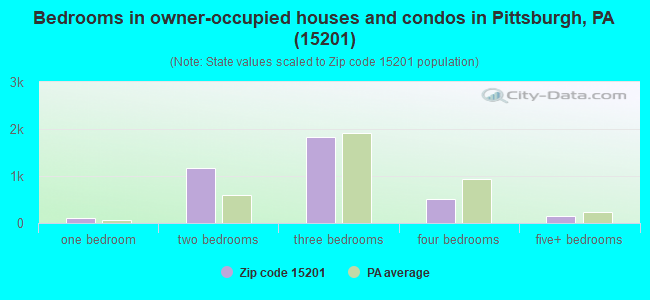
Median number of rooms in houses and condos:
Here:
6.2
State:
6.8
Median number of rooms in apartments:
Here:
4.1
State:
4.3
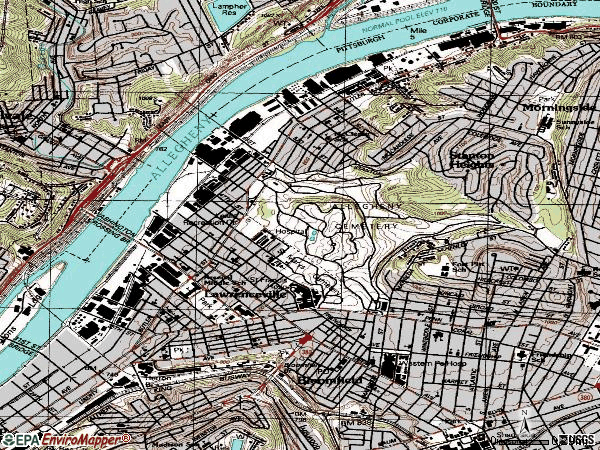
Notable locations in this zip code not listed on our city pages
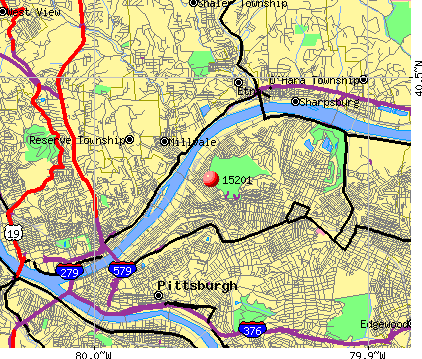
Notable locations in zip code 15201: Arsenal Middle School Library (A), Pittsburgh Bureau of Fire Station 7 (B), Lawrenceville Branch Carnegie Free Library of Pittsburgh (C), Boys Club of Western Pennsylvania (D), Capuchin Friars Development Center (E), Capuchin Provincial Office (F), Church Women United of the Pittsburgh Area (G), Pittsburgh Ballet Theatre (H), Spring Garden Elementary School Library (I), Washington Polytechnic Academy (J), Washington Polytechnic Academy Library (K), Whales Tale Lawrenceville Center (L), Pittsburgh Brewing Company (M), Butler Street Station (N). Display/hide their locations on the map
Churches in zip code 15201 include: Stanton Heights United Methodist Church (A), Religious Center Church of God in Christ (B), Refuge Church of God (C), Park Assembly of God Church (D), New Bethel Baptist Church (E), First Primitive Methodist Church (F), Christian Associates of Southwest Pennsylvania (G). Display/hide their locations on the map
619 married couples with children.
296 single-parent households (20 men, 276 women).
91.6% of residents of 15201 zip code speak English at home.
2.8% of residents speak Spanish at home (96% very well, 4% well).
2.3% of residents speak other Indo-European language at home (89% very well, 11% well).
1.4% of residents speak Asian or Pacific Island language at home (66% very well, 34% well).
1.5% of residents speak other language at home (100% very well).
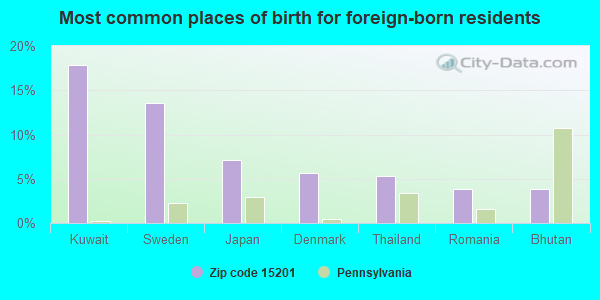
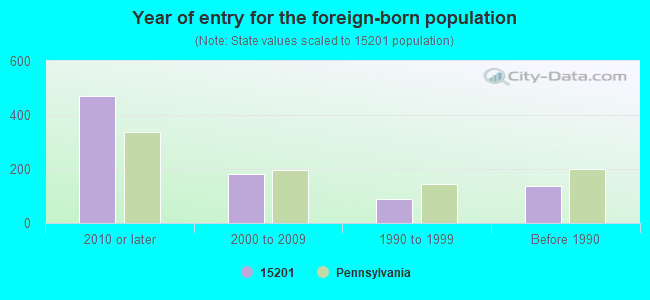
Foreign born population: 723 (5.6%) (40.1% of them are naturalized citizens)
Facilities with environmental interests located in this zip code:
BARBER SPRING CO (ONE MCCANDLESS AVE in PITTSBURGH, PA)
AIR MINOR (AIRS/AFS) CRITERIA AND HAZARDOUS AIR POLLUTANT INVENTORY (Inventory of air pollution sources) STATE MASTER (Pennsylvania database) - PCS-PAR206151, National Pollutant Discharge Elimination System Permit National Pollutant Discharge Elimination System NON-MAJOR (Tracking pollutant discharge elimination systems) - permit Conditionally Exempt Small Quantity Generators, less than 100 kg/month of hazardous waste (Resource Conservation and Recovery Act (tracking hazardous waste)) TRI REPORTER (Tracking of toxic chemicals releasing facilities) Business SIC classification: STEEL SPRINGS, EXCEPT WIRE Business NAICS classification: SPRING (HEAVY GAUGE) MANUFACTURING.; SPRING (HEAVY GAUGE) MANUFACTURING. Organizations: OPERNAME (CONTACT/OPERATOR)
, CRUCIBLE INC (CONTACT/OWNER)
, BP REAL ESTATE HOLDING CO (CONTACT/OWNER)
Alternative names: BARBER SPRING COMPANY, PITTSBURGH SPRING DIV, STD CAR TRUCK
43RD STREET CONCRETE (ONE 43RD STREET in PITTSBURGH, PA)
AIR MINOR (AIRS/AFS) STATE MASTER (Pennsylvania database) - PCS-PAR216130, National Pollutant Discharge Elimination System Permit National Pollutant Discharge Elimination System NON-MAJOR (Tracking pollutant discharge elimination systems) - permit Small Quantity Generators, between 100 kg and 1000 kg of hazardous waste/month (Resource Conservation and Recovery Act (tracking hazardous waste)) - notification Business SIC classification: READY-MIXED CONCRETE Organizations: YESKE ROBERT (CONTACT/OWNER)
Alternative names: 43RD STREET INC, 43RD STREET INCORPORATION
AIM NATL LEASE (30TH & SMALLMAN STREETS in PITTSBURGH, PA)
STATE MASTER (Pennsylvania database) - RCRIS-PAD101580280, HAZARDOUS WASTE PROGRAM Small Quantity Generators, between 100 kg and 1000 kg of hazardous waste/month (Resource Conservation and Recovery Act (tracking hazardous waste)) - notification Organizations: OPERNAME (CONTACT/OPERATOR)
, FLEMING, THOMAS (CONTACT/OWNER)
ALLEGHENY CEMETERY (4734 BUTLER STREET in PITTSBURGH, PA)
AIR MINOR (AIRS/AFS) (Resource Conservation and Recovery Act (tracking hazardous waste)) Business SIC classification: FUNERAL SERVICE AND CREMATORIES Organizations: OPERNAME (CONTACT/OPERATOR)
ARSENAL MS ( in PITTSBURGH, PA)
(National Center for Education Statistics) - STATE ID-6015 Organizations: PITTSBURGH SD (SCHOOL DISTRICT)
ALLEGHENY COLD STORAGE COMPANY INCORPORATED (16 57TH STREET in PITTSBURGH, PA)
National Pollutant Discharge Elimination System NON-MAJOR (Tracking pollutant discharge elimination systems) - permit Small Quantity Generators, between 100 kg and 1000 kg of hazardous waste/month (Resource Conservation and Recovery Act (tracking hazardous waste)) - notification Business SIC classification: REFRIGERATED WAREHOUSING AND STORAGE Organizations: LARRY SPENCER (CONTACT/OWNER)
BINDEX CORP (3100 LIBERTY AVE in PITTSBURGH, PA)
(Resource Conservation and Recovery Act (tracking hazardous waste)) Business NAICS classification: BLANKBOOK, LOOSELEAF BINDERS, AND DEVICES MANUFACTURING. Organizations: OPERNAME (CONTACT/OPERATOR)
, OWNERNAME (CONTACT/OWNER)
AAA SCRAP (3311 PENN AVE in PITTSBURGH, PA)
AIR MINOR (AIRS/AFS) Business SIC classification: SERVICES
ALLEGHENY COUNTY 40TH ST (40TH & WILLOW STS in PITTSBURGH, PA)
Small Quantity Generators, between 100 kg and 1000 kg of hazardous waste/month (Resource Conservation and Recovery Act (tracking hazardous waste)) - notification Organizations: OPERNAME (CONTACT/OPERATOR)
, ALLEGHENY CNTY OF (CONTACT/OWNER)
ALLIED MILLWORK OF PITTSBURGH (3206 PENN AVENUE in PITTSBURGH, PA)
AIR MINOR (AIRS/AFS) Business SIC classification: MILLWORK
ARCO PRODUCTS CO (32ND & LIBERTY AVE in PITTSBURGH, PA)
(Resource Conservation and Recovery Act (tracking hazardous waste))
ASPHALT PRODUCTS COMPANY (30TH STREET in PITTSBURGH, PA)
COMPLIANCE ACTIVITY (Tracking inspections of insecticide, fungicide, and rodenticide, and toxic substances)
Housing units lacking complete plumbing facilities: 1.9% Housing units lacking complete kitchen facilities: 2.2%
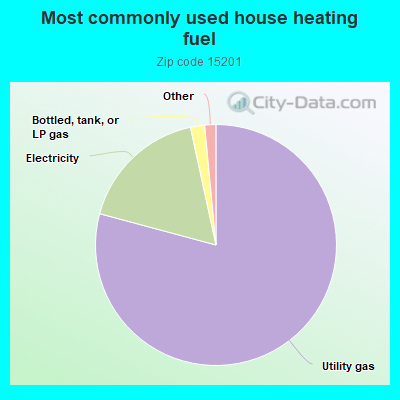
79.2%Utility gas
17.4%Electricity
1.9%Bottled, tank, or LP gas
0.6%No fuel used
0.6%Fuel oil, kerosene, etc.
Population in 1990: 15,278.
Place of birth for U.S.-born residents:
This state: 8,579
Northeast: 1,083
Midwest: 906
South: 1,134
West: 482
66% of the 15201 zip code residents lived in the same house 5 years ago. Out of people who lived in different houses, 82% lived in this county. Out of people who lived in different counties, 50% lived in Pennsylvania.
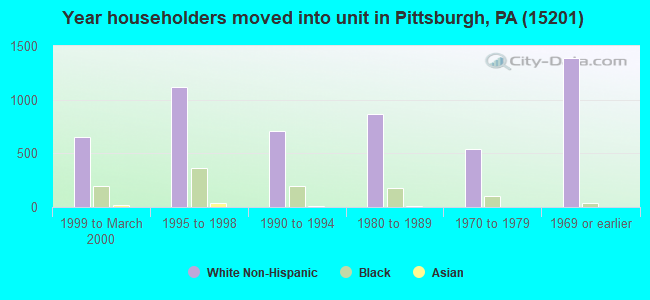
83% of the 15201 zip code residents lived in the same house 1 year ago. Out of people who lived in different houses, 52% moved from this county. Out of people who lived in different houses, 7% moved from different county within same state. Out of people who lived in different houses, 36% moved from different state. Out of people who lived in different houses, 3% moved from abroad.
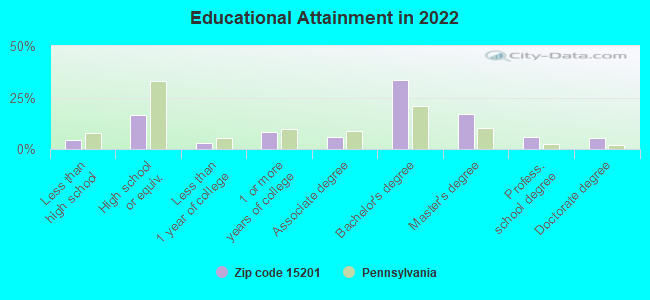
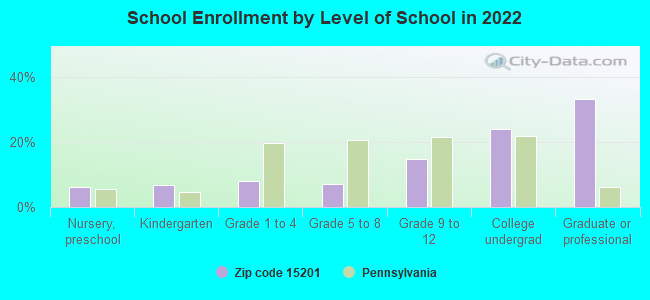
Private vs. public school enrollment:
Students in private schools in grades 1 to 8 (elementary and middle school): 58
Here:
20.0%
Pennsylvania:
15.7%
Students in private schools in grades 9 to 12 (high school): 55
Here:
18.8%
Pennsylvania:
13.4%
Students in private undergraduate colleges: 38
Here:
8.4%
Pennsylvania:
39.8%
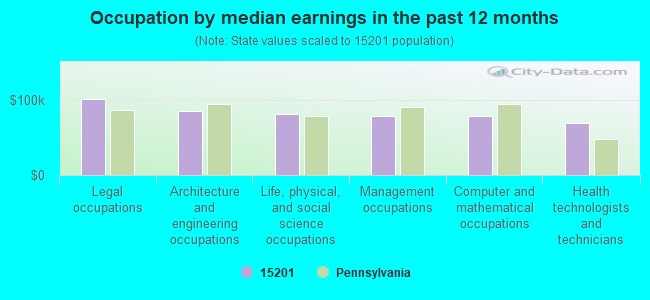
Occupation by median earnings in the past 12 months ($)
101,890Legal occupations
85,217Architecture and engineering occupations
82,227Life, physical, and social science occupations
78,870Management occupations
78,856Computer and mathematical occupations
70,047Health technologists and technicians
Companies with federal contracts located in this zip code (PITTSBURGH, PA):
ROBOTICS FOUNDRY AND DIGITAL G (4514 PLUMMER STREET) : $2,966,844 in 12 contractsfrom 2004 to 2006
Contracts for Engineering -- Advanced Development (R&D) by Navy Signed by year:2000: $0; 2001: $0; 2002: $0; 2003: $0; 2004: $125,000; 2005: $1,433,610; 2006: $1,408,234.
Biggest contracts:
$996,042 with Navy for Engineering -- Advanced Development (R&D). Signed on 2006-02-03. Completion date: 2007-03-27.
$371,135, same as above.Signed on 2005-11-14. Completion date: 2006-11-29.
$274,755, same as above.Signed on 2005-06-07. Completion date: 2006-06-02.
$249,408, same as above.Signed on 2006-05-08. Completion date: 2007-06-26.
INTERLOCKING DECK SYSTEMS INTL (115 41ST ST; small business) : $1,619,304 in 4 contractsfrom 2005 to 2006
$1,888,900 with Army for Bridges, Fixed and Floating. Signed on 2005-09-30. Completion date: 2006-09-30.
$16,404 with Army for Iron and Steel Primary and Semifinished Products. Signed on 2006-02-16. Completion date: 2006-03-31.
$0, same as above.Signed on 2006-03-02. Completion date: 2006-04-21.
-$286,000 with Army for Bridges, Fixed and Floating. Signed on 2006-02-08. Completion date: 2006-09-30.
PITTSBURGH FOUNDRY & MCH CO (20-36TH STREET; small business) : $450,444 in 20 contractsfrom 2002 to 2006
Contracts for Structural Shapes, Bars and Rods, Iron and Steel Primary and Semifinished Products, Valves, Nonpowered, and moreby U.S. Army Corps of Engineers - civil program financing only, Army Signed by year:2000: $0; 2001: $0; 2002: $28,375; 2003: $174,277; 2004: $101,192; 2005: $105,300; 2006: $41,300.
Biggest contracts:
$125,920 with U.S. Army Corps of Engineers - civil program financing only for Structural Shapes. Signed on 2003-07-09. Completion date: 2004-04-05.
$52,650, same as above.Signed on 2005-06-21. Completion date: 2005-12-30.
$52,650 with Army for Structural Shapes. Signed on 2005-06-21. Completion date: 2005-12-30.
$43,960 with U.S. Army Corps of Engineers - civil program financing only for Bars and Rods. Signed on 2003-09-23. Completion date: 2004-03-23.
RE2, INC (32 39TH ST; small business) : $140,334 in 3 contractsfrom 2004 to 2006
$68,235 with Army for Defense Tank - Automotive -- Basic Research (R&D). Signed on 2005-11-17. Completion date: 2006-05-17.
$49,299, same as above.Signed on 2006-06-26. Completion date: 2006-10-26.
$22,800 with Army for Ground Effect Vehicles. Signed on 2004-09-28. Completion date: 2004-10-15.
BARBER SPRING COMPANY (1 MCCANDLESS AVE; small business) : $57,602 in 6 contractsfrom 2003 to 2006
Contracts for Coil, Flat, Leaf, and Wire Springs, Bars and Rods by Army, U.S. Army Corps of Engineers - civil program financing only Signed by year:2000: $0; 2001: $0; 2002: $0; 2003: $12,566; 2004: $6,132; 2005: $35,750; 2006: $3,154.
Biggest contracts:
$35,750 with Army for Coil, Flat, Leaf, and Wire Springs. Signed on 2005-07-18. Completion date: 2005-08-25.
$13,227, same as above.Signed on 2003-04-08. Completion date: 2003-06-10.
$3,154, same as above.Signed on 2006-02-15. Completion date: 2006-03-16.
$3,066 with Army for Bars and Rods. Signed on 2004-01-06. Completion date: 2004-02-06.
PARAGON WHOLESALE FOODS CORP (55 36TH ST; small business) : $22,925 in 12 contractsfrom 2005 to 2006
Contracts for Fruits and Vegetables by Defense Logistics Agency Signed by year:2000: $0; 2001: $0; 2002: $0; 2003: $0; 2004: $0; 2005: $17,603; 2006: $5,322.
Biggest contracts:
$3,366 with Defense Logistics Agency for Fruits and Vegetables. Signed on 2005-07-20. Completion date: 2005-07-20.
$3,287, same as above.Signed on 2005-12-18. Completion date: 2005-12-18.
$3,195, same as above.Signed on 2005-12-16. Completion date: 2005-12-16.
$2,772, same as above.Signed on 2006-06-23. Completion date: 2006-06-23.
PRESSURE CHEMICAL CO (3419 SMALLMAN ST; small business)
$12,100 with Navy for Chemicals. Signed on 2006-05-25. Completion date: 2006-06-30.
Top industries in this zip code by the number of employees in 2005:
2004 - 2018 National Fire Incident Reporting System (NFIRS) incidents
According to the data from the years 2004 - 2018 the average number of fire incidents per year is 26. The highest number of fires - 54 took place in 2006, and the least - 0 in 2012. The data has a rising trend.
When looking into fire subcategories, the most incidents belonged to: Outside Fires (40.6%), and Structure Fires (39.3%).
Fire incident types reported to NFIRS in Zip Code 15201


 Nearest zip codes: 15224, 15232, 15260, 15213, 15223, 15209.


 According to the data from the years 2004 - 2018 the average number of fire incidents per year is 26. The highest number of fires - 54 took place in 2006, and the least - 0 in 2012. The data has a rising trend.
 When looking into fire subcategories, the most incidents belonged to: Outside Fires (40.6%), and Structure Fires (39.3%).