Estimated zip code population in 2022: 26,752 Zip code population in 2010: 27,220 Zip code population in 2000: 26,425
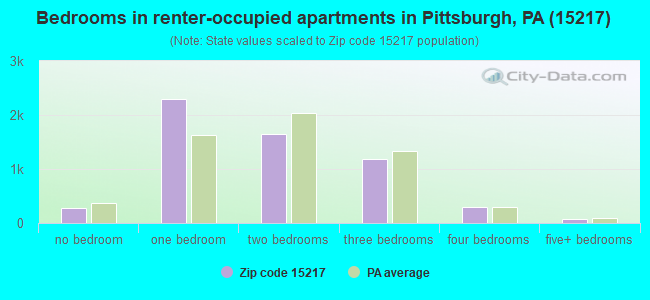
Houses and condos: 12,754 Renter-occupied apartments: 5,754
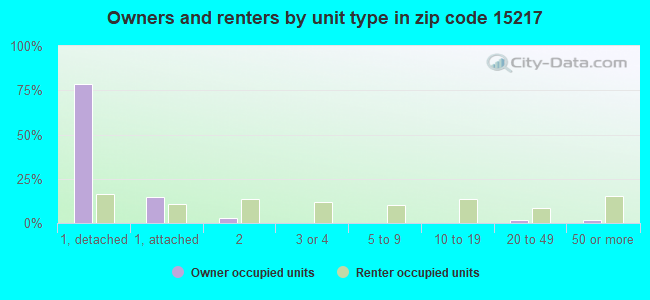
% of renters here:
48%
State:
31%
March 2022 cost of living index in zip code 15217: 97.5 (near average, U.S. average is 100)
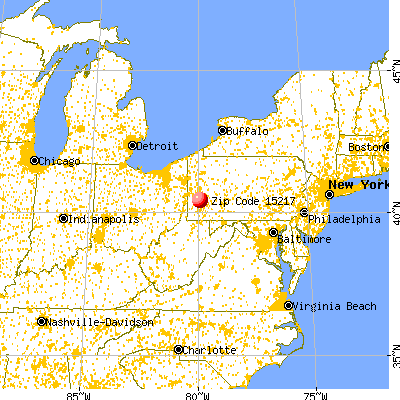
Land area: 3.8 sq. mi. Water area: 0.0 sq. mi.
Population density: 7,028 people per square mile
(high).
OSM Map
General Map
Google Map
MSN Map
OSM Map
General Map
Google Map
MSN Map
OSM Map
General Map
Google Map
MSN Map
OSM Map
General Map
Google Map
MSN Map
Please wait while loading the map...
Real estate property taxes paid for housing units in 2022:
This zip code:
1.1% ($4,645)
Pennsylvania:
1.3% ($3,094)
Median real estate property taxes paid for housing units with mortgages in 2022: $4,701 (1.0%) Median real estate property taxes paid for housing units with no mortgage in 2022: $4,553 (1.2%)
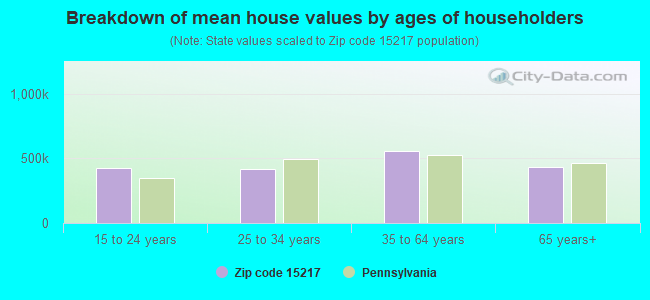
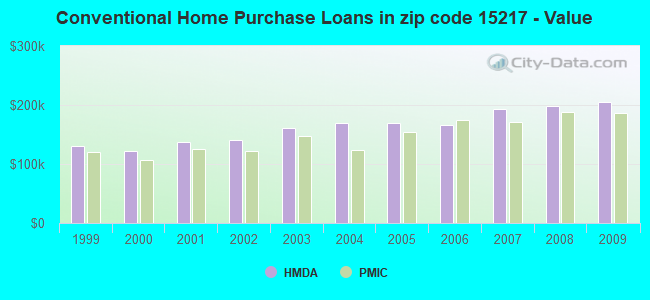
Estimated median house/condo value in 2022: $437,928
15217:
$437,928
Pennsylvania:
$245,500
According to our research of Pennsylvania and other state lists, there were 10 registered sex offenders living in 15217 zip code as of April 27, 2024. The ratio of all residents to sex offenders in zip code 15217 is 2,851 to 1. The ratio of registered sex offenders to all residents in this zip code is much lower than the state average.
Median resident age:
This zip code:
37.6 years
Pennsylvania median age:
40.9 years
Average household size:
This zip code:
2.2 people
Pennsylvania:
2.4 people
Averages for the 2020 tax year for zip code 15217, filed in 2021:
Average Adjusted Gross Income (AGI) in 2020: $150,580 (Individual Income Tax Returns)
Here:
$150,580
State:
$75,707
Salary/wage: $106,189 (reported on 79.1% of returns)
Here:
$106,189
State:
$62,806
(% of AGI for various income ranges: 1155.6% for AGIs below $25k, 3757.0% for AGIs $25k-50k, 6747.1% for AGIs $50k-75k, 9737.3% for AGIs $75k-100k, 19114.3% for AGIs $100k-200k, 117743.0% for AGIs over 200k)
Taxable interest for individuals: $3,110 (reported on 48.9% of returns)
This zip code:
$3,110
Pennsylvania:
$1,633
(% of AGI for various income ranges: 33.5% for AGIs below $25k, 36.9% for AGIs $25k-50k, 69.8% for AGIs $50k-75k, 171.6% for AGIs $75k-100k, 254.5% for AGIs $100k-200k, 2471.9% for AGIs over 200k)
Ordinary dividends: $23,410 (reported on 43.7% of returns)
Here:
$23,410
State:
$7,382
(% of AGI for various income ranges: 113.6% for AGIs below $25k, 119.4% for AGIs $25k-50k, 294.5% for AGIs $50k-75k, 576.8% for AGIs $75k-100k, 1210.3% for AGIs $100k-200k, 19405.7% for AGIs over 200k)
Net capital gain/loss in AGI: +$56,252 (reported on 39.7% of returns)
Here:
+$56,252
State:
+$23,522
(% of AGI for various income ranges: 70.5% for AGIs below $25k, 148.3% for AGIs $25k-50k, 249.8% for AGIs $50k-75k, 487.9% for AGIs $75k-100k, 1199.0% for AGIs $100k-200k, 47742.5% for AGIs over 200k)
Profit/loss from business: +$29,024 (reported on 19.8% of returns)
Here:
+$29,024
State:
+$16,274
(% of AGI for various income ranges: 137.8% for AGIs below $25k, 170.2% for AGIs $25k-50k, 378.5% for AGIs $50k-75k, 518.7% for AGIs $75k-100k, 1400.9% for AGIs $100k-200k, 8283.6% for AGIs over 200k)
Taxable individual retirement arrangement distribution: $34,483 (reported on 12.0% of returns)
15217:
$34,483
Pennsylvania:
$18,583
(% of AGI for various income ranges: 76.6% for AGIs below $25k, 106.8% for AGIs $25k-50k, 296.5% for AGIs $50k-75k, 587.7% for AGIs $75k-100k, 1368.9% for AGIs $100k-200k, 5173.2% for AGIs over 200k)
Self-employed (Keogh) retirement plans: $23,454 (reported on 2.3% of returns)
15217:
$23,454
Pennsylvania:
$25,407
(% of AGI for various income ranges: 33.1% for AGIs $50k-75k, 93.3% for AGIs $100k-200k, 999.8% for AGIs over 200k)
Total itemized deductions: $61,262 (reported on 13.3% of returns)
Here:
$61,262
State:
$34,850
(% of AGI for various income ranges: 87.4% for AGIs below $25k, 103.5% for AGIs $25k-50k, 213.8% for AGIs $50k-75k, 654.7% for AGIs $75k-100k, 1118.3% for AGIs $100k-200k, 14911.1% for AGIs over 200k)
Charity contributions: $41,735 (reported on 11.5% of returns)
Here:
$41,735
State:
$12,392
(% of AGI for various income ranges: 5.1% for AGIs below $25k, 16.1% for AGIs $25k-50k, 32.9% for AGIs $50k-75k, 121.8% for AGIs $75k-100k, 322.0% for AGIs $100k-200k, 10221.9% for AGIs over 200k)
Taxes paid: $8,980 (reported on 13.3% of returns)
15217:
$8,980
State:
$8,200
(% of AGI for various income ranges: 13.5% for AGIs below $25k, 23.6% for AGIs $25k-50k, 58.7% for AGIs $50k-75k, 183.9% for AGIs $75k-100k, 348.7% for AGIs $100k-200k, 1653.0% for AGIs over 200k)
Earned income credit: $1,285 (reported on 5.9% of returns)
Here:
$1,285
State:
$2,100
(% of AGI for various income ranges: 30.3% for AGIs below $25k, 21.3% for AGIs $25k-50k)
Percentage of individuals using paid preparers for their 2020 taxes: 89.6%
Here:
90%
State:
92%
(% for various income ranges: 87.4% for AGIs below $25k, 91.5% for AGIs $25k-50k, 88.1% for AGIs $50k-75k, 88.6% for AGIs $75k-100k, 90.6% for AGIs $100k-200k, 91.3% for AGIs over 200k)
Averages for the 2012 tax year for zip code 15217, filed in 2013:
Average Adjusted Gross Income (AGI) in 2012: $125,316 (Individual Income Tax Returns)
Here:
$125,316
State:
$61,346
Salary/wage: $88,592 (reported on 80.6% of returns)
Here:
$88,592
State:
$51,902
(% of AGI for various income ranges: 73.6% for AGIs below $25k, 78.6% for AGIs $25k-50k, 73.6% for AGIs $50k-75k, 69.6% for AGIs $75k-100k, 69.8% for AGIs $100k-200k, 48.1% for AGIs over 200k)
Taxable interest for individuals: $2,254 (reported on 50.5% of returns)
This zip code:
$2,254
Pennsylvania:
$1,588
(% of AGI for various income ranges: 2.3% for AGIs below $25k, 1.1% for AGIs $25k-50k, 0.8% for AGIs $50k-75k, 1.0% for AGIs $75k-100k, 0.8% for AGIs $100k-200k, 0.9% for AGIs over 200k)
Ordinary dividends: $14,086 (reported on 42.7% of returns)
Here:
$14,086
State:
$5,827
(% of AGI for various income ranges: 6.0% for AGIs below $25k, 3.1% for AGIs $25k-50k, 3.3% for AGIs $50k-75k, 4.0% for AGIs $75k-100k, 4.1% for AGIs $100k-200k, 5.3% for AGIs over 200k)
Net capital gain/loss in AGI: +$34,680 (reported on 35.1% of returns)
Here:
+$34,680
State:
+$14,495
(% of AGI for various income ranges: 0.5% for AGIs below $25k, 0.7% for AGIs $25k-50k, 1.6% for AGIs $50k-75k, 1.8% for AGIs $75k-100k, 2.5% for AGIs $100k-200k, 14.3% for AGIs over 200k)
Profit/loss from business: +$27,842 (reported on 19.6% of returns)
Here:
+$27,842
State:
+$16,268
(% of AGI for various income ranges: 7.2% for AGIs below $25k, 4.5% for AGIs $25k-50k, 3.6% for AGIs $50k-75k, 4.5% for AGIs $75k-100k, 5.3% for AGIs $100k-200k, 4.0% for AGIs over 200k)
Taxable individual retirement arrangement distribution: $29,987 (reported on 13.7% of returns)
15217:
$29,987
Pennsylvania:
$14,550
(% of AGI for various income ranges: 3.7% for AGIs below $25k, 3.1% for AGIs $25k-50k, 3.2% for AGIs $50k-75k, 3.6% for AGIs $75k-100k, 4.5% for AGIs $100k-200k, 2.9% for AGIs over 200k)
Self-employment retirement plans: $23,282 (reported on 2.7% of returns)
15217:
$23,282
Pennsylvania:
$20,922
(% of AGI for various income ranges: 0.2% for AGIs $25k-50k, 0.3% for AGIs $75k-100k, 0.5% for AGIs $100k-200k, 0.6% for AGIs over 200k)
Total itemized deductions: $36,770 (14% of AGI, reported on 40.2% of returns)
Here:
$36,770
State:
$23,538
Here:
14.1% of AGI
State:
18.4% of AGI
(% of AGI for various income ranges: 10.4% for AGIs below $25k, 8.4% for AGIs $25k-50k, 11.7% for AGIs $50k-75k, 13.2% for AGIs $75k-100k, 15.1% for AGIs $100k-200k, 11.2% for AGIs over 200k)
Charity contributions: $9,095 (reported on 35.1% of returns)
Here:
$9,095
State:
$4,025
(% of AGI for various income ranges: 0.6% for AGIs below $25k, 0.8% for AGIs $25k-50k, 1.5% for AGIs $50k-75k, 1.7% for AGIs $75k-100k, 2.4% for AGIs $100k-200k, 3.0% for AGIs over 200k)
Taxes paid: $18,633 (reported on 40.1% of returns)
15217:
$18,633
State:
$9,982
(% of AGI for various income ranges: 2.5% for AGIs below $25k, 2.5% for AGIs $25k-50k, 4.6% for AGIs $50k-75k, 5.9% for AGIs $75k-100k, 7.9% for AGIs $100k-200k, 6.1% for AGIs over 200k)
Earned income credit: $1,318 (reported on 7.1% of returns)
Here:
$1,318
State:
$2,106
(% of AGI for various income ranges: 1.9% for AGIs below $25k, 0.4% for AGIs $25k-50k)
Percentage of individuals using paid preparers for their 2012 taxes: 48.0%
Here:
48%
State:
53%
(% for various income ranges: 42.7% for AGIs below $25k, 38.4% for AGIs $25k-50k, 42.2% for AGIs $50k-75k, 50.0% for AGIs $75k-100k, 55.2% for AGIs $100k-200k, 74.2% for AGIs over 200k)
Averages for the 2004 tax year for zip code 15217, filed in 2005:
Average Adjusted Gross Income (AGI) in 2004: $75,859 (Individual Income Tax Returns)
Here:
$75,859
State:
$48,049
Salary/wage: $60,989 (reported on 78.1% of returns)
Here:
$60,989
State:
$42,646
(% of AGI for various income ranges: 130.3% for AGIs below $10k, 75.9% for AGIs $10k-25k, 77.3% for AGIs $25k-50k, 72.6% for AGIs $50k-75k, 69.8% for AGIs $75k-100k, 56.9% for AGIs over 100k)
Taxable interest for individuals: $3,095 (reported on 60.5% of returns)
This zip code:
$3,095
Pennsylvania:
$1,657
(% of AGI for various income ranges: 19.8% for AGIs below $10k, 4.1% for AGIs $10k-25k, 3.1% for AGIs $25k-50k, 2.7% for AGIs $50k-75k, 3.0% for AGIs $75k-100k, 2.0% for AGIs over 100k)
Taxable dividends: $10,113 (reported on 45.7% of returns)
Here:
$10,113
State:
$3,566
(% of AGI for various income ranges: 22.8% for AGIs below $10k, 4.1% for AGIs $10k-25k, 3.3% for AGIs $25k-50k, 4.0% for AGIs $50k-75k, 4.3% for AGIs $75k-100k, 6.9% for AGIs over 100k)
Net capital gain/loss: +$16,341 (reported on 37.8% of returns)
Here:
+$16,341
State:
+$9,716
(% of AGI for various income ranges: -8.8% for AGIs below $10k, 0.5% for AGIs $10k-25k, 0.8% for AGIs $25k-50k, 1.8% for AGIs $50k-75k, 1.8% for AGIs $75k-100k, 11.5% for AGIs over 100k)
Profit/loss from business: +$23,143 (reported on 18.6% of returns)
Here:
+$23,143
State:
+$14,267
(% of AGI for various income ranges: 5.1% for AGIs below $10k, 3.9% for AGIs $10k-25k, 4.9% for AGIs $25k-50k, 5.9% for AGIs $50k-75k, 5.5% for AGIs $75k-100k, 5.9% for AGIs over 100k)
IRA payment deduction: $3,089 (reported on 3.4% of returns)
15217:
$3,089
Pennsylvania:
$2,903
(% of AGI for various income ranges: 0.4% for AGIs below $10k, 0.4% for AGIs $10k-25k, 0.4% for AGIs $25k-50k, 0.3% for AGIs $50k-75k, 0.2% for AGIs $75k-100k, 0.1% for AGIs over 100k)
Self-employed pension: $16,202 (reported on 3.2% of returns)
Here:
$16,202
Pennsylvania:
$14,674
(% of AGI for various income ranges: 0.3% for AGIs $25k-50k, 0.3% for AGIs $50k-75k, 0.5% for AGIs $75k-100k, 0.9% for AGIs over 100k)
Total itemized deductions: $25,599 (17% of AGI, reported on 40.8% of returns)
Here:
$25,599
State:
$18,804
Here:
16.8% of AGI
State:
19.5% of AGI
(% of AGI for various income ranges: 18.2% for AGIs below $10k, 9.8% for AGIs $10k-25k, 11.3% for AGIs $25k-50k, 15.0% for AGIs $50k-75k, 17.6% for AGIs $75k-100k, 13.7% for AGIs over 100k)
Charity contributions deductions: $5,938 (4% of AGI, reported on 35.6% of returns)
Here:
$5,938
State:
$3,337
Here:
3.6% of AGI
State:
3.3% of AGI
(% of AGI for various income ranges: 1.1% for AGIs below $10k, 0.9% for AGIs $10k-25k, 1.4% for AGIs $25k-50k, 2.1% for AGIs $50k-75k, 2.5% for AGIs $75k-100k, 3.2% for AGIs over 100k)
Total tax: $16,494 (reported on 79.0% of returns)
15217:
$16,494
State:
$8,008
(% of AGI for various income ranges: 4.0% for AGIs below $10k, 5.2% for AGIs $10k-25k, 8.5% for AGIs $25k-50k, 10.5% for AGIs $50k-75k, 11.6% for AGIs $75k-100k, 20.9% for AGIs over 100k)
Earned income credit: $1,034 (reported on 6.0% of returns)
Here:
$1,034
State:
$1,643
Percentage of individuals using paid preparers for their 2004 taxes: 48.8%
Here:
49%
State:
56%
(% for various income ranges: 49.1% for AGIs below $10k, 38.2% for AGIs $10k-25k, 41.8% for AGIs $25k-50k, 48.6% for AGIs $50k-75k, 52.3% for AGIs $75k-100k, 66.5% for AGIs over 100k)
Likely homosexual households (counted as self-reported same-sex unmarried-partner households)
Lesbian couples: 0.0% of all households
Gay men: 0.2% of all households
Household received Food Stamps/SNAP in the past 12 months: 1,235 Household did not receive Food Stamps/SNAP in the past 12 months: 10,682
Women who had a birth in the past 12 months: 243 (229 now married, 25 unmarried) Women who did not have a birth in the past 12 months: 6,706 (2,615 now married, 4,092 unmarried)
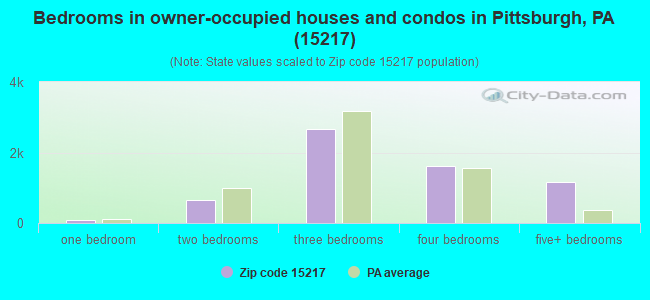
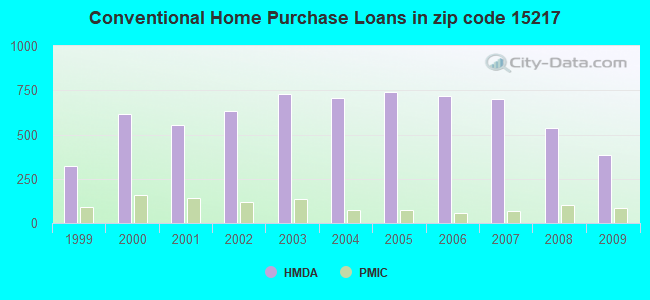
Housing units in zip code 15217 with a mortgage: 3,716 (735 second mortgage, 7 home equity loan, 717 both second mortgage and home equity loan) Houses without a mortgage: 63
Median monthly owner costs for units with a mortgage: $2,401 Median monthly owner costs for units without a mortgage: $871
Residents with income below the poverty level in 2022:
This zip code:
13.9%
Whole state:
11.8%
Residents with income below 50% of the poverty level in 2022:
This zip code:
5.6%
Whole state:
6.1%
Median number of rooms in houses and condos:
Here:
7.3
State:
6.8
Median number of rooms in apartments:
Here:
4.2
State:
4.3
Notable locations in this zip code not listed on our city pages
Notable locations in zip code 15217: Scobell House (A), Boss House (B), Anderson Dining Hall (C), Andrew W Mellon Hall (D), Art and Design Center (E), Eddy Theatre (F), Jennie King Mellon Library (G), Lindsay House (H), Raizman House (I), Woodland Hall (J), Allderdice High School Library (K), American Jewish Committee Building (L), Colfax Elementary School Library (M), Community Day School of Schechter (N), Henderson House (O), Jewish Association of Aging (P), Linden School Library (Q), Carriage House Childrens Center (R), Lubavitch Center (S), McGill House (T). Display/hide their locations on the map
Churches in zip code 15217 include: Shaare Torah Congregation (A), Poale Zedeck Congregation (B), Pittsburgh Mennonite Church (C), New Light Congregation Church (D), Nativity of the Blessed Virgin Mary (E), Mary S Brown Ames Memorial United Methodist Church (F), Congregation Poale Zedeck (G), Church of the Redeemer (H), Browns Hill Bible Chapel (I). Display/hide their locations on the map
4,351 married couples with children.
495 single-parent households (188 men, 307 women).
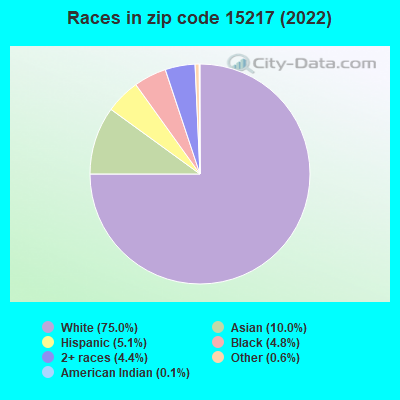
78.5% of residents of 15217 zip code speak English at home.
4.4% of residents speak Spanish at home (77% very well, 13% well, 10% not well).
10.0% of residents speak other Indo-European language at home (71% very well, 16% well, 9% not well, 4% not at all).
6.5% of residents speak Asian or Pacific Island language at home (70% very well, 25% well, 5% not well).
0.8% of residents speak other language at home (78% very well, 17% well, 4% not well, 1% not at all).
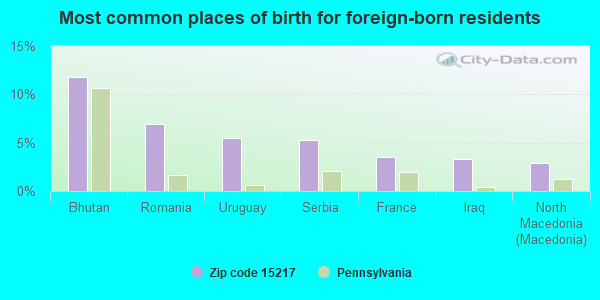
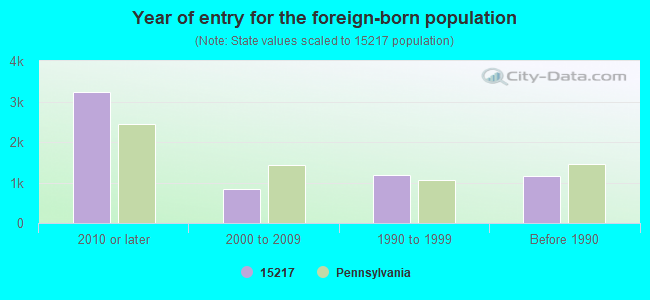
Foreign born population: 5,780 (21.6%) (51.2% of them are naturalized citizens)
Facilities with environmental interests located in this zip code:
ALLDERDICE SCHOOL (2409 SHADY AVE in PITTSBURGH, PA)
AIR MINOR (AIRS/AFS) (National Center for Education Statistics) - STATE ID-0409 CRITERIA AND HAZARDOUS AIR POLLUTANT INVENTORY (Inventory of air pollution sources) Business SIC classification: ELEMENTARY AND SECONDARY SCHOOLS Organizations: PITTSBURGH SD (SCHOOL DISTRICT)
Alternative names: ALLDERDICE HS, PGH PUB SCH ALLERDICE HIGH SCHOOL, PITTSBURGH SD ALLDERDICE HIGH SCHOOL
AUSSENBERG DENTAL LAB (1831 MURRAY AVE in PITTSBURGH, PA)
(Resource Conservation and Recovery Act (tracking hazardous waste)) Business NAICS classification: DENTAL LABORATORIES. Organizations: OPERNAME (CONTACT/OPERATOR)
, OWNERNAME (CONTACT/OWNER)
BELL TELEPHONE CO JOB RECORDS GROUP (5741 POCUSSET ST in PITTSBURGH, PA)
(Resource Conservation and Recovery Act (tracking hazardous waste)) Organizations: OPERNAME (CONTACT/OPERATOR)
, BELL OF PA (CONTACT/OWNER)
BETH SHALOM CONGREGATION (5915 BEACON STREET in PITTSBURGH, PA)
AIR MINOR (AIRS/AFS) Business SIC classification: RELIGIOUS ORGANIZATIONS
Housing units lacking complete plumbing facilities: 0.2% Housing units lacking complete kitchen facilities: 1.6%
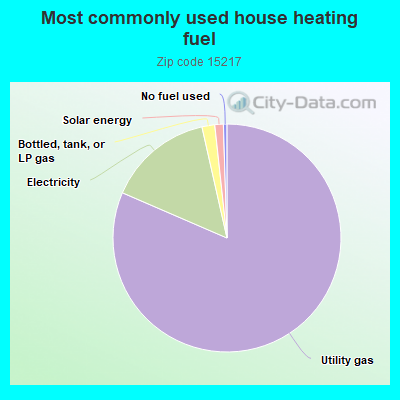
81.1%Utility gas
14.9%Electricity
1.8%Bottled, tank, or LP gas
1.2%Solar energy
0.5%No fuel used
Population in 1990: 27,450.
Place of birth for U.S.-born residents:
This state: 12,558
Northeast: 2,491
Midwest: 2,359
South: 1,892
West: 1,499
56% of the 15217 zip code residents lived in the same house 5 years ago. Out of people who lived in different houses, 60% lived in this county. Out of people who lived in different counties, 50% lived in Pennsylvania.
88% of the 15217 zip code residents lived in the same house 1 year ago. Out of people who lived in different houses, 48% moved from this county. Out of people who lived in different houses, 7% moved from different county within same state. Out of people who lived in different houses, 31% moved from different state. Out of people who lived in different houses, 15% moved from abroad.
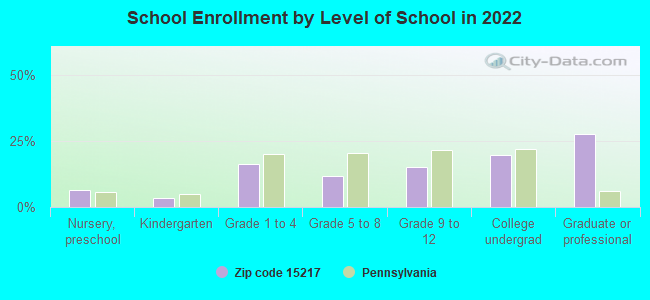
Private vs. public school enrollment:
Students in private schools in grades 1 to 8 (elementary and middle school): 1,336
Here:
59.4%
Pennsylvania:
15.7%
Students in private schools in grades 9 to 12 (high school): 407
Here:
34.3%
Pennsylvania:
13.4%
Students in private undergraduate colleges: 845
Here:
54.4%
Pennsylvania:
39.8%
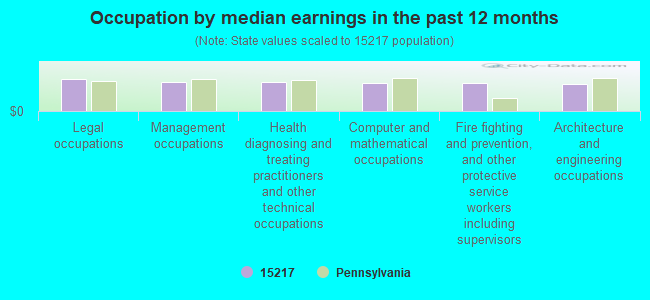
Occupation by median earnings in the past 12 months ($)
100,610Legal occupations
91,158Management occupations
89,723Health diagnosing and treating practitioners and other technical occupations
87,449Computer and mathematical occupations
87,368Fire fighting and prevention, and other protective service workers including supervisors
84,454Architecture and engineering occupations
Companies with federal contracts located in this zip code (PITTSBURGH, PA):
BLADE DIAGNOSTICS CORPORATION (6688 KINSMAN ROAD; small business) : $574,931 in 3 contractsfrom 2005 to 2006
$375,000 with Air Force for Defense Aircraft -- Basic Research (R&D). Signed on 2006-05-02. Completion date: 2008-04-30.
$99,994 with Air Force for Defense Aircraft -- Management and Support (R&D). Signed on 2005-03-22. Completion date: 2005-12-21.
$99,937, same as above.Signed on 2006-04-04. Completion date: 2007-01-05.
VIVISIMO INC (2435 BEECHWOOD BLVD; small business) : $345,084 in 3 contractsfrom 2005 to 2006
$243,495 with Department of Defense for ADP Software. Taking place in DC. Signed on 2005-07-07. Completion date: 2006-07-07.
$78,594 with SOCIAL SECURITY ADMINISTRATION for Other ADP and Telecommunications Services (includes data storage on tapes, compact disks, etc.). Taking place in MD. Signed on 2006-03-24. Completion date: 2007-03-23.
$22,995 with Department of Defense for ADP Software. Signed on 2005-08-08. Completion date: 2006-08-08.
KAMO CONSULTANCY (5629 WOODMONT ST.; small business)
$32,000 with Navy for ADP Systems Analysis Services. Signed on 2000-08-31. Completion date: 2000-10-13.
FOUNDATION INTERNET SERVICES, (5542 RALEIGH ST; small business) : $5,750 in 4 contractsfrom 2003 to 2004
$5,750 with Army for Communications Services. Signed on 2003-01-30. Completion date: 2003-01-24.
$5,000 with Army for Maintenance, Repair and Rebuilding of Equipment -- Automatic Data Processing Equipment (Including Firmware), Software, Supplies and Support Equipment. Signed on 2003-10-21. Completion date: 2004-09-30.
$0, same as above.Signed on 2003-10-21. Completion date: 2004-09-30.
-$5,000, same as above.Signed on 2004-09-22. Completion date: 2004-09-30.
Top industries in this zip code by the number of employees in 2005:
Health Care and Social Assistance: Nursing Care Facilities (250-499 employees: 1 establishment, 100-249 employees: 2 establishments)
2004 - 2018 National Fire Incident Reporting System (NFIRS) incidents
Based on the data from the years 2004 - 2018 the average number of fires per year is 35. The highest number of reported fires - 84 took place in 2009, and the least - 0 in 2012. The data has an increasing trend.
When looking into fire subcategories, the most incidents belonged to: Structure Fires (43.9%), and Outside Fires (37.2%).
Fire incident types reported to NFIRS in Zip Code 15217


 Nearest zip codes: 15232, 15207, 15208, 15218, 15260, 15120.


 Based on the data from the years 2004 - 2018 the average number of fires per year is 35. The highest number of reported fires - 84 took place in 2009, and the least - 0 in 2012. The data has an increasing trend.
 When looking into fire subcategories, the most incidents belonged to: Structure Fires (43.9%), and Outside Fires (37.2%).