Cities: Munhall, PA (48.12%) ,
West Homestead, PA (20.45%) ,
Homestead, PA (13.00%) ,
Pittsburgh, PA (11.98%) ,
Whitaker, PA (6.45%) County: Allegheny County, PA Estimated zip code population in 2022: 18,111
Zip code population in 2010: 18,931
Zip code population in 2000: 20,437
Houses and condos: 9,810
Renter-occupied apartments: 3,337
% of renters here:
39%State:
31%
March 2022 cost of living index in zip code 15120: 92.3
(less than average, U.S. average is 100)
Land area: 4.7
sq. mi.
Water area: 0.3
sq. mi.
Population density: 3,876 people per square mile (average).
OSM Map
General Map
Google Map
MSN Map
OSM Map
General Map
Google Map
MSN Map
OSM Map
General Map
Google Map
MSN Map
OSM Map
General Map
Google Map
MSN Map
Please wait while loading the map...
Real estate property taxes paid for housing units in 2022:
This zip code:
1.7% ($2,046)Pennsylvania:
1.3% ($3,094)
Median real estate property taxes paid for housing units with mortgages in 2022: $2,227 (1.6%)
Median real estate property taxes paid for housing units with no mortgage in 2022: $1,808 (1.8%)
Profiles of local businesses
Business Search - 14 Million verified businesses
Males: 8,569 Females: 9,542
For population 25 years and over in 15120:
High school or higher: 94.5%Bachelor's degree or higher: 26.0%Graduate or professional degree: 10.1%Unemployed: 5.9%Mean travel time to work (commute): 26.0 minutes
For population 15 years and over in 15120:
Never married: 39.8%Now married: 39.4%Separated: 1.1%Widowed: 9.6%Divorced: 10.0%
Zip code 15120 compared to state average:
Median house value below state average. Black race population percentage above state average. Hispanic race population percentage significantly below state average. Foreign-born population percentage significantly below state average. Length of stay since moving in significantly above state average. 13,107 72.4% White 3,893 21.5% Black 593 3.3% Two or more races 359 2.0% Hispanic or Latino 131 0.7% Asian 23 0.1% American Indian 1 0.01% Some other race
Data:
Median household income ($)
Median household income (% change since 2000)
Household income diversity
Ratio of average income to average house value (%)
Ratio of average income to average rent
Median household income ($) - White
Median household income ($) - Black or African American
Median household income ($) - Asian
Median household income ($) - Hispanic or Latino
Median household income ($) - American Indian and Alaska Native
Median household income ($) - Multirace
Median household income ($) - Other Race
Median household income for houses/condos with a mortgage ($)
Median household income for apartments without a mortgage ($)
Races - White alone (%)
Races - White alone (% change since 2000)
Races - Black alone (%)
Races - Black alone (% change since 2000)
Races - American Indian alone (%)
Races - American Indian alone (% change since 2000)
Races - Asian alone (%)
Races - Asian alone (% change since 2000)
Races - Hispanic (%)
Races - Hispanic (% change since 2000)
Races - Native Hawaiian and Other Pacific Islander alone (%)
Races - Native Hawaiian and Other Pacific Islander alone (% change since 2000)
Races - Two or more races (%)
Races - Two or more races (% change since 2000)
Races - Other race alone (%)
Races - Other race alone (% change since 2000)
Racial diversity
Unemployment (%)
Unemployment (% change since 2000)
Unemployment (%) - White
Unemployment (%) - Black or African American
Unemployment (%) - Asian
Unemployment (%) - Hispanic or Latino
Unemployment (%) - American Indian and Alaska Native
Unemployment (%) - Multirace
Unemployment (%) - Other Race
Population density (people per square mile)
Population - Males (%)
Population - Females (%)
Population - Males (%) - White
Population - Males (%) - Black or African American
Population - Males (%) - Asian
Population - Males (%) - Hispanic or Latino
Population - Males (%) - American Indian and Alaska Native
Population - Males (%) - Multirace
Population - Males (%) - Other Race
Population - Females (%) - White
Population - Females (%) - Black or African American
Population - Females (%) - Asian
Population - Females (%) - Hispanic or Latino
Population - Females (%) - American Indian and Alaska Native
Population - Females (%) - Multirace
Population - Females (%) - Other Race
Coronavirus confirmed cases (Apr 27, 2024)
Deaths caused by coronavirus (Apr 27, 2024)
Coronavirus confirmed cases (per 100k population) (Apr 27, 2024)
Deaths caused by coronavirus (per 100k population) (Apr 27, 2024)
Daily increase in number of cases (Apr 27, 2024)
Weekly increase in number of cases (Apr 27, 2024)
Cases doubled (in days) (Apr 27, 2024)
Hospitalized patients (Apr 18, 2022)
Negative test results (Apr 18, 2022)
Total test results (Apr 18, 2022)
COVID Vaccine doses distributed (per 100k population) (Sep 19, 2023)
COVID Vaccine doses administered (per 100k population) (Sep 19, 2023)
COVID Vaccine doses distributed (Sep 19, 2023)
COVID Vaccine doses administered (Sep 19, 2023)
Likely homosexual households (%)
Likely homosexual households (% change since 2000)
Likely homosexual households - Lesbian couples (%)
Likely homosexual households - Lesbian couples (% change since 2000)
Likely homosexual households - Gay men (%)
Likely homosexual households - Gay men (% change since 2000)
Cost of living index
Median gross rent ($)
Median contract rent ($)
Median monthly housing costs ($)
Median house or condo value ($)
Median house or condo value ($ change since 2000)
Mean house or condo value by units in structure - 1, detached ($)
Mean house or condo value by units in structure - 1, attached ($)
Mean house or condo value by units in structure - 2 ($)
Mean house or condo value by units in structure by units in structure - 3 or 4 ($)
Mean house or condo value by units in structure - 5 or more ($)
Mean house or condo value by units in structure - Boat, RV, van, etc. ($)
Mean house or condo value by units in structure - Mobile home ($)
Median house or condo value ($) - White
Median house or condo value ($) - Black or African American
Median house or condo value ($) - Asian
Median house or condo value ($) - Hispanic or Latino
Median house or condo value ($) - American Indian and Alaska Native
Median house or condo value ($) - Multirace
Median house or condo value ($) - Other Race
Median resident age
Resident age diversity
Median resident age - Males
Median resident age - Females
Median resident age - White
Median resident age - Black or African American
Median resident age - Asian
Median resident age - Hispanic or Latino
Median resident age - American Indian and Alaska Native
Median resident age - Multirace
Median resident age - Other Race
Median resident age - Males - White
Median resident age - Males - Black or African American
Median resident age - Males - Asian
Median resident age - Males - Hispanic or Latino
Median resident age - Males - American Indian and Alaska Native
Median resident age - Males - Multirace
Median resident age - Males - Other Race
Median resident age - Females - White
Median resident age - Females - Black or African American
Median resident age - Females - Asian
Median resident age - Females - Hispanic or Latino
Median resident age - Females - American Indian and Alaska Native
Median resident age - Females - Multirace
Median resident age - Females - Other Race
Commute - mean travel time to work (minutes)
Travel time to work - Less than 5 minutes (%)
Travel time to work - Less than 5 minutes (% change since 2000)
Travel time to work - 5 to 9 minutes (%)
Travel time to work - 5 to 9 minutes (% change since 2000)
Travel time to work - 10 to 19 minutes (%)
Travel time to work - 10 to 19 minutes (% change since 2000)
Travel time to work - 20 to 29 minutes (%)
Travel time to work - 20 to 29 minutes (% change since 2000)
Travel time to work - 30 to 39 minutes (%)
Travel time to work - 30 to 39 minutes (% change since 2000)
Travel time to work - 40 to 59 minutes (%)
Travel time to work - 40 to 59 minutes (% change since 2000)
Travel time to work - 60 to 89 minutes (%)
Travel time to work - 60 to 89 minutes (% change since 2000)
Travel time to work - 90 or more minutes (%)
Travel time to work - 90 or more minutes (% change since 2000)
Marital status - Never married (%)
Marital status - Now married (%)
Marital status - Separated (%)
Marital status - Widowed (%)
Marital status - Divorced (%)
Median family income ($)
Median family income (% change since 2000)
Median non-family income ($)
Median non-family income (% change since 2000)
Median per capita income ($)
Median per capita income (% change since 2000)
Median family income ($) - White
Median family income ($) - Black or African American
Median family income ($) - Asian
Median family income ($) - Hispanic or Latino
Median family income ($) - American Indian and Alaska Native
Median family income ($) - Multirace
Median family income ($) - Other Race
Median year house/condo built
Median year apartment built
Year house built - Built 2005 or later (%)
Year house built - Built 2000 to 2004 (%)
Year house built - Built 1990 to 1999 (%)
Year house built - Built 1980 to 1989 (%)
Year house built - Built 1970 to 1979 (%)
Year house built - Built 1960 to 1969 (%)
Year house built - Built 1950 to 1959 (%)
Year house built - Built 1940 to 1949 (%)
Year house built - Built 1939 or earlier (%)
Average household size
Household density (households per square mile)
Average household size - White
Average household size - Black or African American
Average household size - Asian
Average household size - Hispanic or Latino
Average household size - American Indian and Alaska Native
Average household size - Multirace
Average household size - Other Race
Occupied housing units (%)
Vacant housing units (%)
Owner occupied housing units (%)
Renter occupied housing units (%)
Vacancy status - For rent (%)
Vacancy status - For sale only (%)
Vacancy status - Rented or sold, not occupied (%)
Vacancy status - For seasonal, recreational, or occasional use (%)
Vacancy status - For migrant workers (%)
Vacancy status - Other vacant (%)
Residents with income below the poverty level (%)
Residents with income below 50% of the poverty level (%)
Children below poverty level (%)
Poor families by family type - Married-couple family (%)
Poor families by family type - Male, no wife present (%)
Poor families by family type - Female, no husband present (%)
Poverty status for native-born residents (%)
Poverty status for foreign-born residents (%)
Poverty among high school graduates not in families (%)
Poverty among people who did not graduate high school not in families (%)
Residents with income below the poverty level (%) - White
Residents with income below the poverty level (%) - Black or African American
Residents with income below the poverty level (%) - Asian
Residents with income below the poverty level (%) - Hispanic or Latino
Residents with income below the poverty level (%) - American Indian and Alaska Native
Residents with income below the poverty level (%) - Multirace
Residents with income below the poverty level (%) - Other Race
Air pollution - Air Quality Index (AQI)
Air pollution - CO
Air pollution - NO2
Air pollution - SO2
Air pollution - Ozone
Air pollution - PM10
Air pollution - PM25
Air pollution - Pb
Crime - Murders per 100,000 population
Crime - Rapes per 100,000 population
Crime - Robberies per 100,000 population
Crime - Assaults per 100,000 population
Crime - Burglaries per 100,000 population
Crime - Thefts per 100,000 population
Crime - Auto thefts per 100,000 population
Crime - Arson per 100,000 population
Crime - City-data.com crime index
Crime - Violent crime index
Crime - Property crime index
Crime - Murders per 100,000 population (5 year average)
Crime - Rapes per 100,000 population (5 year average)
Crime - Robberies per 100,000 population (5 year average)
Crime - Assaults per 100,000 population (5 year average)
Crime - Burglaries per 100,000 population (5 year average)
Crime - Thefts per 100,000 population (5 year average)
Crime - Auto thefts per 100,000 population (5 year average)
Crime - Arson per 100,000 population (5 year average)
Crime - City-data.com crime index (5 year average)
Crime - Violent crime index (5 year average)
Crime - Property crime index (5 year average)
1996 Presidential Elections Results (%) - Democratic Party (Clinton)
1996 Presidential Elections Results (%) - Republican Party (Dole)
1996 Presidential Elections Results (%) - Other
2000 Presidential Elections Results (%) - Democratic Party (Gore)
2000 Presidential Elections Results (%) - Republican Party (Bush)
2000 Presidential Elections Results (%) - Other
2004 Presidential Elections Results (%) - Democratic Party (Kerry)
2004 Presidential Elections Results (%) - Republican Party (Bush)
2004 Presidential Elections Results (%) - Other
2008 Presidential Elections Results (%) - Democratic Party (Obama)
2008 Presidential Elections Results (%) - Republican Party (McCain)
2008 Presidential Elections Results (%) - Other
2012 Presidential Elections Results (%) - Democratic Party (Obama)
2012 Presidential Elections Results (%) - Republican Party (Romney)
2012 Presidential Elections Results (%) - Other
2016 Presidential Elections Results (%) - Democratic Party (Clinton)
2016 Presidential Elections Results (%) - Republican Party (Trump)
2016 Presidential Elections Results (%) - Other
2020 Presidential Elections Results (%) - Democratic Party (Biden)
2020 Presidential Elections Results (%) - Republican Party (Trump)
2020 Presidential Elections Results (%) - Other
Ancestries Reported - Arab (%)
Ancestries Reported - Czech (%)
Ancestries Reported - Danish (%)
Ancestries Reported - Dutch (%)
Ancestries Reported - English (%)
Ancestries Reported - French (%)
Ancestries Reported - French Canadian (%)
Ancestries Reported - German (%)
Ancestries Reported - Greek (%)
Ancestries Reported - Hungarian (%)
Ancestries Reported - Irish (%)
Ancestries Reported - Italian (%)
Ancestries Reported - Lithuanian (%)
Ancestries Reported - Norwegian (%)
Ancestries Reported - Polish (%)
Ancestries Reported - Portuguese (%)
Ancestries Reported - Russian (%)
Ancestries Reported - Scotch-Irish (%)
Ancestries Reported - Scottish (%)
Ancestries Reported - Slovak (%)
Ancestries Reported - Subsaharan African (%)
Ancestries Reported - Swedish (%)
Ancestries Reported - Swiss (%)
Ancestries Reported - Ukrainian (%)
Ancestries Reported - United States (%)
Ancestries Reported - Welsh (%)
Ancestries Reported - West Indian (%)
Ancestries Reported - Other (%)
Educational Attainment - No schooling completed (%)
Educational Attainment - Less than high school (%)
Educational Attainment - High school or equivalent (%)
Educational Attainment - Less than 1 year of college (%)
Educational Attainment - 1 or more years of college (%)
Educational Attainment - Associate degree (%)
Educational Attainment - Bachelor's degree (%)
Educational Attainment - Master's degree (%)
Educational Attainment - Professional school degree (%)
Educational Attainment - Doctorate degree (%)
School Enrollment - Nursery, preschool (%)
School Enrollment - Kindergarten (%)
School Enrollment - Grade 1 to 4 (%)
School Enrollment - Grade 5 to 8 (%)
School Enrollment - Grade 9 to 12 (%)
School Enrollment - College undergrad (%)
School Enrollment - Graduate or professional (%)
School Enrollment - Not enrolled in school (%)
School enrollment - Public schools (%)
School enrollment - Private schools (%)
School enrollment - Not enrolled (%)
Median number of rooms in houses and condos
Median number of rooms in apartments
Housing units lacking complete plumbing facilities (%)
Housing units lacking complete kitchen facilities (%)
Density of houses
Urban houses (%)
Rural houses (%)
Households with people 60 years and over (%)
Households with people 65 years and over (%)
Households with people 75 years and over (%)
Households with one or more nonrelatives (%)
Households with no nonrelatives (%)
Population in households (%)
Family households (%)
Nonfamily households (%)
Population in families (%)
Family households with own children (%)
Median number of bedrooms in owner occupied houses
Mean number of bedrooms in owner occupied houses
Median number of bedrooms in renter occupied houses
Mean number of bedrooms in renter occupied houses
Median number of vehichles in owner occupied houses
Mean number of vehichles in owner occupied houses
Median number of vehichles in renter occupied houses
Mean number of vehichles in renter occupied houses
Mortgage status - with mortgage (%)
Mortgage status - with second mortgage (%)
Mortgage status - with home equity loan (%)
Mortgage status - with both second mortgage and home equity loan (%)
Mortgage status - without a mortgage (%)
Average family size
Average family size - White
Average family size - Black or African American
Average family size - Asian
Average family size - Hispanic or Latino
Average family size - American Indian and Alaska Native
Average family size - Multirace
Average family size - Other Race
Geographical mobility - Same house 1 year ago (%)
Geographical mobility - Moved within same county (%)
Geographical mobility - Moved from different county within same state (%)
Geographical mobility - Moved from different state (%)
Geographical mobility - Moved from abroad (%)
Place of birth - Born in state of residence (%)
Place of birth - Born in other state (%)
Place of birth - Native, outside of US (%)
Place of birth - Foreign born (%)
Housing units in structures - 1, detached (%)
Housing units in structures - 1, attached (%)
Housing units in structures - 2 (%)
Housing units in structures - 3 or 4 (%)
Housing units in structures - 5 to 9 (%)
Housing units in structures - 10 to 19 (%)
Housing units in structures - 20 to 49 (%)
Housing units in structures - 50 or more (%)
Housing units in structures - Mobile home (%)
Housing units in structures - Boat, RV, van, etc. (%)
House/condo owner moved in on average (years ago)
Renter moved in on average (years ago)
Year householder moved into unit - Moved in 1999 to March 2000 (%)
Year householder moved into unit - Moved in 1995 to 1998 (%)
Year householder moved into unit - Moved in 1990 to 1994 (%)
Year householder moved into unit - Moved in 1980 to 1989 (%)
Year householder moved into unit - Moved in 1970 to 1979 (%)
Year householder moved into unit - Moved in 1969 or earlier (%)
Means of transportation to work - Drove car alone (%)
Means of transportation to work - Carpooled (%)
Means of transportation to work - Public transportation (%)
Means of transportation to work - Bus or trolley bus (%)
Means of transportation to work - Streetcar or trolley car (%)
Means of transportation to work - Subway or elevated (%)
Means of transportation to work - Railroad (%)
Means of transportation to work - Ferryboat (%)
Means of transportation to work - Taxicab (%)
Means of transportation to work - Motorcycle (%)
Means of transportation to work - Bicycle (%)
Means of transportation to work - Walked (%)
Means of transportation to work - Other means (%)
Working at home (%)
Industry diversity
Most Common Industries - Agriculture, forestry, fishing and hunting, and mining (%)
Most Common Industries - Agriculture, forestry, fishing and hunting (%)
Most Common Industries - Mining, quarrying, and oil and gas extraction (%)
Most Common Industries - Construction (%)
Most Common Industries - Manufacturing (%)
Most Common Industries - Wholesale trade (%)
Most Common Industries - Retail trade (%)
Most Common Industries - Transportation and warehousing, and utilities (%)
Most Common Industries - Transportation and warehousing (%)
Most Common Industries - Utilities (%)
Most Common Industries - Information (%)
Most Common Industries - Finance and insurance, and real estate and rental and leasing (%)
Most Common Industries - Finance and insurance (%)
Most Common Industries - Real estate and rental and leasing (%)
Most Common Industries - Professional, scientific, and management, and administrative and waste management services (%)
Most Common Industries - Professional, scientific, and technical services (%)
Most Common Industries - Management of companies and enterprises (%)
Most Common Industries - Administrative and support and waste management services (%)
Most Common Industries - Educational services, and health care and social assistance (%)
Most Common Industries - Educational services (%)
Most Common Industries - Health care and social assistance (%)
Most Common Industries - Arts, entertainment, and recreation, and accommodation and food services (%)
Most Common Industries - Arts, entertainment, and recreation (%)
Most Common Industries - Accommodation and food services (%)
Most Common Industries - Other services, except public administration (%)
Most Common Industries - Public administration (%)
Occupation diversity
Most Common Occupations - Management, business, science, and arts occupations (%)
Most Common Occupations - Management, business, and financial occupations (%)
Most Common Occupations - Management occupations (%)
Most Common Occupations - Business and financial operations occupations (%)
Most Common Occupations - Computer, engineering, and science occupations (%)
Most Common Occupations - Computer and mathematical occupations (%)
Most Common Occupations - Architecture and engineering occupations (%)
Most Common Occupations - Life, physical, and social science occupations (%)
Most Common Occupations - Education, legal, community service, arts, and media occupations (%)
Most Common Occupations - Community and social service occupations (%)
Most Common Occupations - Legal occupations (%)
Most Common Occupations - Education, training, and library occupations (%)
Most Common Occupations - Arts, design, entertainment, sports, and media occupations (%)
Most Common Occupations - Healthcare practitioners and technical occupations (%)
Most Common Occupations - Health diagnosing and treating practitioners and other technical occupations (%)
Most Common Occupations - Health technologists and technicians (%)
Most Common Occupations - Service occupations (%)
Most Common Occupations - Healthcare support occupations (%)
Most Common Occupations - Protective service occupations (%)
Most Common Occupations - Fire fighting and prevention, and other protective service workers including supervisors (%)
Most Common Occupations - Law enforcement workers including supervisors (%)
Most Common Occupations - Food preparation and serving related occupations (%)
Most Common Occupations - Building and grounds cleaning and maintenance occupations (%)
Most Common Occupations - Personal care and service occupations (%)
Most Common Occupations - Sales and office occupations (%)
Most Common Occupations - Sales and related occupations (%)
Most Common Occupations - Office and administrative support occupations (%)
Most Common Occupations - Natural resources, construction, and maintenance occupations (%)
Most Common Occupations - Farming, fishing, and forestry occupations (%)
Most Common Occupations - Construction and extraction occupations (%)
Most Common Occupations - Installation, maintenance, and repair occupations (%)
Most Common Occupations - Production, transportation, and material moving occupations (%)
Most Common Occupations - Production occupations (%)
Most Common Occupations - Transportation occupations (%)
Most Common Occupations - Material moving occupations (%)
People in Group quarters - Institutionalized population (%)
People in Group quarters - Correctional institutions (%)
People in Group quarters - Federal prisons and detention centers (%)
People in Group quarters - Halfway houses (%)
People in Group quarters - Local jails and other confinement facilities (including police lockups) (%)
People in Group quarters - Military disciplinary barracks (%)
People in Group quarters - State prisons (%)
People in Group quarters - Other types of correctional institutions (%)
People in Group quarters - Nursing homes (%)
People in Group quarters - Hospitals/wards, hospices, and schools for the handicapped (%)
People in Group quarters - Hospitals/wards and hospices for chronically ill (%)
People in Group quarters - Hospices or homes for chronically ill (%)
People in Group quarters - Military hospitals or wards for chronically ill (%)
People in Group quarters - Other hospitals or wards for chronically ill (%)
People in Group quarters - Hospitals or wards for drug/alcohol abuse (%)
People in Group quarters - Mental (Psychiatric) hospitals or wards (%)
People in Group quarters - Schools, hospitals, or wards for the mentally retarded (%)
People in Group quarters - Schools, hospitals, or wards for the physically handicapped (%)
People in Group quarters - Institutions for the deaf (%)
People in Group quarters - Institutions for the blind (%)
People in Group quarters - Orthopedic wards and institutions for the physically handicapped (%)
People in Group quarters - Wards in general hospitals for patients who have no usual home elsewhere (%)
People in Group quarters - Wards in military hospitals for patients who have no usual home elsewhere (%)
People in Group quarters - Juvenile institutions (%)
People in Group quarters - Long-term care (%)
People in Group quarters - Homes for abused, dependent, and neglected children (%)
People in Group quarters - Residential treatment centers for emotionally disturbed children (%)
People in Group quarters - Training schools for juvenile delinquents (%)
People in Group quarters - Short-term care, detention or diagnostic centers for delinquent children (%)
People in Group quarters - Type of juvenile institution unknown (%)
People in Group quarters - Noninstitutionalized population (%)
People in Group quarters - College dormitories (includes college quarters off campus) (%)
People in Group quarters - Military quarters (%)
People in Group quarters - On base (%)
People in Group quarters - Barracks, unaccompanied personnel housing (UPH), (Enlisted/Officer), ;and similar group living quarters for military personnel (%)
People in Group quarters - Transient quarters for temporary residents (%)
People in Group quarters - Military ships (%)
People in Group quarters - Group homes (%)
People in Group quarters - Homes or halfway houses for drug/alcohol abuse (%)
People in Group quarters - Homes for the mentally ill (%)
People in Group quarters - Homes for the mentally retarded (%)
People in Group quarters - Homes for the physically handicapped (%)
People in Group quarters - Other group homes (%)
People in Group quarters - Religious group quarters (%)
People in Group quarters - Dormitories (%)
People in Group quarters - Agriculture workers' dormitories on farms (%)
People in Group quarters - Job Corps and vocational training facilities (%)
People in Group quarters - Other workers' dormitories (%)
People in Group quarters - Crews of maritime vessels (%)
People in Group quarters - Other nonhousehold living situations (%)
People in Group quarters - Other noninstitutional group quarters (%)
Residents speaking English at home (%)
Residents speaking English at home - Born in the United States (%)
Residents speaking English at home - Native, born elsewhere (%)
Residents speaking English at home - Foreign born (%)
Residents speaking Spanish at home (%)
Residents speaking Spanish at home - Born in the United States (%)
Residents speaking Spanish at home - Native, born elsewhere (%)
Residents speaking Spanish at home - Foreign born (%)
Residents speaking other language at home (%)
Residents speaking other language at home - Born in the United States (%)
Residents speaking other language at home - Native, born elsewhere (%)
Residents speaking other language at home - Foreign born (%)
Class of Workers - Employee of private company (%)
Class of Workers - Self-employed in own incorporated business (%)
Class of Workers - Private not-for-profit wage and salary workers (%)
Class of Workers - Local government workers (%)
Class of Workers - State government workers (%)
Class of Workers - Federal government workers (%)
Class of Workers - Self-employed workers in own not incorporated business and Unpaid family workers (%)
House heating fuel used in houses and condos - Utility gas (%)
House heating fuel used in houses and condos - Bottled, tank, or LP gas (%)
House heating fuel used in houses and condos - Electricity (%)
House heating fuel used in houses and condos - Fuel oil, kerosene, etc. (%)
House heating fuel used in houses and condos - Coal or coke (%)
House heating fuel used in houses and condos - Wood (%)
House heating fuel used in houses and condos - Solar energy (%)
House heating fuel used in houses and condos - Other fuel (%)
House heating fuel used in houses and condos - No fuel used (%)
House heating fuel used in apartments - Utility gas (%)
House heating fuel used in apartments - Bottled, tank, or LP gas (%)
House heating fuel used in apartments - Electricity (%)
House heating fuel used in apartments - Fuel oil, kerosene, etc. (%)
House heating fuel used in apartments - Coal or coke (%)
House heating fuel used in apartments - Wood (%)
House heating fuel used in apartments - Solar energy (%)
House heating fuel used in apartments - Other fuel (%)
House heating fuel used in apartments - No fuel used (%)
Armed forces status - In Armed Forces (%)
Armed forces status - Civilian (%)
Armed forces status - Civilian - Veteran (%)
Armed forces status - Civilian - Nonveteran (%)
Fatal accidents locations in years 2005-2021
Fatal accidents locations in 2005
Fatal accidents locations in 2006
Fatal accidents locations in 2007
Fatal accidents locations in 2008
Fatal accidents locations in 2009
Fatal accidents locations in 2010
Fatal accidents locations in 2011
Fatal accidents locations in 2012
Fatal accidents locations in 2013
Fatal accidents locations in 2014
Fatal accidents locations in 2015
Fatal accidents locations in 2016
Fatal accidents locations in 2017
Fatal accidents locations in 2018
Fatal accidents locations in 2019
Fatal accidents locations in 2020
Fatal accidents locations in 2021
Alcohol use - People drinking some alcohol every month (%)
Alcohol use - People not drinking at all (%)
Alcohol use - Average days/month drinking alcohol
Alcohol use - Average drinks/week
Alcohol use - Average days/year people drink much
Audiometry - Average condition of hearing (%)
Audiometry - People that can hear a whisper from across a quiet room (%)
Audiometry - People that can hear normal voice from across a quiet room (%)
Audiometry - Ears ringing, roaring, buzzing (%)
Audiometry - Had a job exposure to loud noise (%)
Audiometry - Had off-work exposure to loud noise (%)
Blood Pressure & Cholesterol - Has high blood pressure (%)
Blood Pressure & Cholesterol - Checking blood pressure at home (%)
Blood Pressure & Cholesterol - Frequently checking blood cholesterol (%)
Blood Pressure & Cholesterol - Has high cholesterol level (%)
Consumer Behavior - Money monthly spent on food at supermarket/grocery store
Consumer Behavior - Money monthly spent on food at other stores
Consumer Behavior - Money monthly spent on eating out
Consumer Behavior - Money monthly spent on carryout/delivered foods
Consumer Behavior - Income spent on food at supermarket/grocery store (%)
Consumer Behavior - Income spent on food at other stores (%)
Consumer Behavior - Income spent on eating out (%)
Consumer Behavior - Income spent on carryout/delivered foods (%)
Current Health Status - General health condition (%)
Current Health Status - Blood donors (%)
Current Health Status - Has blood ever tested for HIV virus (%)
Current Health Status - Left-handed people (%)
Dermatology - People using sunscreen (%)
Diabetes - Diabetics (%)
Diabetes - Had a blood test for high blood sugar (%)
Diabetes - People taking insulin (%)
Diet Behavior & Nutrition - Diet health (%)
Diet Behavior & Nutrition - Milk product consumption (# of products/month)
Diet Behavior & Nutrition - Meals not home prepared (#/week)
Diet Behavior & Nutrition - Meals from fast food or pizza place (#/week)
Diet Behavior & Nutrition - Ready-to-eat foods (#/month)
Diet Behavior & Nutrition - Frozen meals/pizza (#/month)
Drug Use - People that ever used marijuana or hashish (%)
Drug Use - Ever used hard drugs (%)
Drug Use - Ever used any form of cocaine (%)
Drug Use - Ever used heroin (%)
Drug Use - Ever used methamphetamine (%)
Health Insurance - People covered by health insurance (%)
Kidney Conditions-Urology - Avg. # of times urinating at night
Medical Conditions - People with asthma (%)
Medical Conditions - People with anemia (%)
Medical Conditions - People with psoriasis (%)
Medical Conditions - People with overweight (%)
Medical Conditions - Elderly people having difficulties in thinking or remembering (%)
Medical Conditions - People who ever received blood transfusion (%)
Medical Conditions - People having trouble seeing even with glass/contacts (%)
Medical Conditions - People with arthritis (%)
Medical Conditions - People with gout (%)
Medical Conditions - People with congestive heart failure (%)
Medical Conditions - People with coronary heart disease (%)
Medical Conditions - People with angina pectoris (%)
Medical Conditions - People who ever had heart attack (%)
Medical Conditions - People who ever had stroke (%)
Medical Conditions - People with emphysema (%)
Medical Conditions - People with thyroid problem (%)
Medical Conditions - People with chronic bronchitis (%)
Medical Conditions - People with any liver condition (%)
Medical Conditions - People who ever had cancer or malignancy (%)
Mental Health - People who have little interest in doing things (%)
Mental Health - People feeling down, depressed, or hopeless (%)
Mental Health - People who have trouble sleeping or sleeping too much (%)
Mental Health - People feeling tired or having little energy (%)
Mental Health - People with poor appetite or overeating (%)
Mental Health - People feeling bad about themself (%)
Mental Health - People who have trouble concentrating on things (%)
Mental Health - People moving or speaking slowly or too fast (%)
Mental Health - People having thoughts they would be better off dead (%)
Oral Health - Average years since last visit a dentist
Oral Health - People embarrassed because of mouth (%)
Oral Health - People with gum disease (%)
Oral Health - General health of teeth and gums (%)
Oral Health - Average days a week using dental floss/device
Oral Health - Average days a week using mouthwash for dental problem
Oral Health - Average number of teeth
Pesticide Use - Households using pesticides to control insects (%)
Pesticide Use - Households using pesticides to kill weeds (%)
Physical Activity - People doing vigorous-intensity work activities (%)
Physical Activity - People doing moderate-intensity work activities (%)
Physical Activity - People walking or bicycling (%)
Physical Activity - People doing vigorous-intensity recreational activities (%)
Physical Activity - People doing moderate-intensity recreational activities (%)
Physical Activity - Average hours a day doing sedentary activities
Physical Activity - Average hours a day watching TV or videos
Physical Activity - Average hours a day using computer
Physical Functioning - People having limitations keeping them from working (%)
Physical Functioning - People limited in amount of work they can do (%)
Physical Functioning - People that need special equipment to walk (%)
Physical Functioning - People experiencing confusion/memory problems (%)
Physical Functioning - People requiring special healthcare equipment (%)
Prescription Medications - Average number of prescription medicines taking
Preventive Aspirin Use - Adults 40+ taking low-dose aspirin (%)
Reproductive Health - Vaginal deliveries (%)
Reproductive Health - Cesarean deliveries (%)
Reproductive Health - Deliveries resulted in a live birth (%)
Reproductive Health - Pregnancies resulted in a delivery (%)
Reproductive Health - Women breastfeeding newborns (%)
Reproductive Health - Women that had a hysterectomy (%)
Reproductive Health - Women that had both ovaries removed (%)
Reproductive Health - Women that have ever taken birth control pills (%)
Reproductive Health - Women taking birth control pills (%)
Reproductive Health - Women that have ever used Depo-Provera or injectables (%)
Reproductive Health - Women that have ever used female hormones (%)
Sexual Behavior - People 18+ that ever had sex (vaginal, anal, or oral) (%)
Sexual Behavior - Males 18+ that ever had vaginal sex with a woman (%)
Sexual Behavior - Males 18+ that ever performed oral sex on a woman (%)
Sexual Behavior - Males 18+ that ever had anal sex with a woman (%)
Sexual Behavior - Males 18+ that ever had any sex with a man (%)
Sexual Behavior - Females 18+ that ever had vaginal sex with a man (%)
Sexual Behavior - Females 18+ that ever performed oral sex on a man (%)
Sexual Behavior - Females 18+ that ever had anal sex with a man (%)
Sexual Behavior - Females 18+ that ever had any kind of sex with a woman (%)
Sexual Behavior - Average age people first had sex
Sexual Behavior - Average number of female sex partners in lifetime (males 18+)
Sexual Behavior - Average number of female vaginal sex partners in lifetime (males 18+)
Sexual Behavior - Average age people first performed oral sex on a woman (18+)
Sexual Behavior - Average number of woman performed oral sex on in lifetime (18+)
Sexual Behavior - Average number of male sex partners in lifetime (males 18+)
Sexual Behavior - Average number of male anal sex partners in lifetime (males 18+)
Sexual Behavior - Average age people first performed oral sex on a man (18+)
Sexual Behavior - Average number of male oral sex partners in lifetime (18+)
Sexual Behavior - People using protection when performing oral sex (%)
Sexual Behavior - Average number of times people have vaginal or anal sex a year
Sexual Behavior - People having sex without condom (%)
Sexual Behavior - Average number of male sex partners in lifetime (females 18+)
Sexual Behavior - Average number of male vaginal sex partners in lifetime (females 18+)
Sexual Behavior - Average number of female sex partners in lifetime (females 18+)
Sexual Behavior - Circumcised males 18+ (%)
Sleep Disorders - Average hours sleeping at night
Sleep Disorders - People that has trouble sleeping (%)
Smoking-Cigarette Use - People smoking cigarettes (%)
Taste & Smell - People 40+ having problems with smell (%)
Taste & Smell - People 40+ having problems with taste (%)
Taste & Smell - People 40+ that ever had wisdom teeth removed (%)
Taste & Smell - People 40+ that ever had tonsils teeth removed (%)
Taste & Smell - People 40+ that ever had a loss of consciousness because of a head injury (%)
Taste & Smell - People 40+ that ever had a broken nose or other serious injury to face or skull (%)
Taste & Smell - People 40+ that ever had two or more sinus infections (%)
Weight - Average height (inches)
Weight - Average weight (pounds)
Weight - Average BMI
Weight - People that are obese (%)
Weight - People that ever were obese (%)
Weight - People trying to lose weight (%)
100%
urban population.
Estimated median house/condo value in 2022: $119,168
15120:
$119,168Pennsylvania:
$245,500
Median resident age: This zip code:
42.5 yearsPennsylvania median age:
40.9 years
Average household size: This zip code:
2.1 peoplePennsylvania:
2.4 people
Averages for the 2020 tax year for zip code 15120, filed in 2021:
Average Adjusted Gross Income (AGI) in 2020: $49,888 (Individual Income Tax Returns) Here:
$49,888State:
$75,707
Salary/wage: $44,935 (reported on 80.5% of returns )Here:
$44,935State:
$62,806
(% of AGI for various income ranges: 927.0% for AGIs below $25k , 3253.6% for AGIs $25k-50k , 6151.5% for AGIs $50k-75k , 9050.3% for AGIs $75k-100k , 16298.3% for AGIs $100k-200k , 55044.0% for AGIs over 200k ) Taxable interest for individuals: $829 (reported on 22.8% of returns )This zip code:
$829Pennsylvania:
$1,633
(% of AGI for various income ranges: 12.2% for AGIs below $25k , 9.8% for AGIs $25k-50k , 15.6% for AGIs $50k-75k , 46.3% for AGIs $75k-100k , 88.1% for AGIs $100k-200k , 606.0% for AGIs over 200k ) Ordinary dividends: $2,961 (reported on 14.9% of returns )(% of AGI for various income ranges: 16.9% for AGIs below $25k , 25.8% for AGIs $25k-50k , 51.1% for AGIs $50k-75k , 100.0% for AGIs $75k-100k , 239.5% for AGIs $100k-200k , 1234.0% for AGIs over 200k ) Net capital gain/loss in AGI: +$6,645 (reported on 10.9% of returns )Here:
+$6,645State:
+$23,522
(% of AGI for various income ranges: 2.8% for AGIs below $25k , 13.7% for AGIs $25k-50k , 59.9% for AGIs $50k-75k , 165.8% for AGIs $75k-100k , 313.7% for AGIs $100k-200k , 6070.0% for AGIs over 200k ) Profit/loss from business: +$10,136 (reported on 10.0% of returns )Here:
+$10,136State:
+$16,274
(% of AGI for various income ranges: 64.4% for AGIs below $25k , 70.0% for AGIs $25k-50k , 138.1% for AGIs $50k-75k , 161.2% for AGIs $75k-100k , 378.1% for AGIs $100k-200k , 3418.0% for AGIs over 200k ) Taxable individual retirement arrangement distribution: $13,843 (reported on 9.9% of returns )15120:
$13,843Pennsylvania:
$18,583
(% of AGI for various income ranges: 72.7% for AGIs below $25k , 89.5% for AGIs $25k-50k , 195.1% for AGIs $50k-75k , 441.3% for AGIs $75k-100k , 554.2% for AGIs $100k-200k , 2200.0% for AGIs over 200k ) Total itemized deductions: $26,721 (reported on 2.0% of returns )Here:
$26,721State:
$34,850
(% of AGI for various income ranges: 34.4% for AGIs $25k-50k , 105.8% for AGIs $50k-75k , 125.5% for AGIs $75k-100k , 206.6% for AGIs $100k-200k , 2326.0% for AGIs over 200k ) Charity contributions: $7,485 (reported on 1.4% of returns )(% of AGI for various income ranges: 19.2% for AGIs $50k-75k , 43.3% for AGIs $75k-100k , 41.0% for AGIs $100k-200k , 536.0% for AGIs over 200k ) Taxes paid: $6,944 (reported on 1.9% of returns )(% of AGI for various income ranges: 5.0% for AGIs $25k-50k , 16.5% for AGIs $50k-75k , 35.8% for AGIs $75k-100k , 78.6% for AGIs $100k-200k , 552.0% for AGIs over 200k ) Earned income credit: $2,025 (reported on 16.0% of returns )(% of AGI for various income ranges: 73.6% for AGIs below $25k , 53.1% for AGIs $25k-50k ) Percentage of individuals using paid preparers for their 2020 taxes: 90.1%(% for various income ranges: 88.1% for AGIs below $25k , 92.3% for AGIs $25k-50k , 90.8% for AGIs $50k-75k , 89.5% for AGIs $75k-100k , 90.4% for AGIs $100k-200k , 85.7% for AGIs over 200k )
Averages for the 2012 tax year for zip code 15120, filed in 2013:
Average Adjusted Gross Income (AGI) in 2012: $41,157 (Individual Income Tax Returns) Here:
$41,157State:
$61,346
Salary/wage: $38,755 (reported on 82.8% of returns )Here:
$38,755State:
$51,902
(% of AGI for various income ranges: 69.9% for AGIs below $25k , 79.9% for AGIs $25k-50k , 79.9% for AGIs $50k-75k , 79.8% for AGIs $75k-100k , 80.6% for AGIs $100k-200k , 64.1% for AGIs over 200k ) Taxable interest for individuals: $900 (reported on 28.6% of returns )This zip code:
$900Pennsylvania:
$1,588
(% of AGI for various income ranges: 1.2% for AGIs below $25k , 0.6% for AGIs $25k-50k , 0.5% for AGIs $50k-75k , 0.4% for AGIs $75k-100k , 0.7% for AGIs $100k-200k , 0.4% for AGIs over 200k ) Ordinary dividends: $2,426 (reported on 16.8% of returns )(% of AGI for various income ranges: 1.2% for AGIs below $25k , 0.8% for AGIs $25k-50k , 0.8% for AGIs $50k-75k , 0.8% for AGIs $75k-100k , 1.2% for AGIs $100k-200k , 2.0% for AGIs over 200k ) Net capital gain/loss in AGI: +$3,148 (reported on 9.4% of returns )Here:
+$3,148State:
+$14,495
(% of AGI for various income ranges: 0.2% for AGIs $25k-50k , 0.4% for AGIs $50k-75k , 0.4% for AGIs $75k-100k , 0.9% for AGIs $100k-200k , 6.5% for AGIs over 200k ) Profit/loss from business: +$10,192 (reported on 9.0% of returns )Here:
+$10,192State:
+$16,268
(% of AGI for various income ranges: 4.9% for AGIs below $25k , 1.7% for AGIs $25k-50k , 1.8% for AGIs $50k-75k , 2.1% for AGIs $75k-100k , 2.2% for AGIs $100k-200k ) Taxable individual retirement arrangement distribution: $9,391 (reported on 11.1% of returns )15120:
$9,391Pennsylvania:
$14,550
(% of AGI for various income ranges: 3.6% for AGIs below $25k , 2.6% for AGIs $25k-50k , 2.4% for AGIs $50k-75k , 2.5% for AGIs $75k-100k , 2.6% for AGIs $100k-200k ) Total itemized deductions: $15,611 (18% of AGI, reported on 16.9% of returns )Here:
$15,611State:
$23,538
Here:
18.5% of AGIState:
18.4% of AGI
(% of AGI for various income ranges: 2.9% for AGIs below $25k , 4.5% for AGIs $25k-50k , 6.3% for AGIs $50k-75k , 7.5% for AGIs $75k-100k , 9.3% for AGIs $100k-200k , 7.8% for AGIs over 200k ) Charity contributions: $2,427 (reported on 14.0% of returns )(% of AGI for various income ranges: 0.3% for AGIs below $25k , 0.5% for AGIs $25k-50k , 0.9% for AGIs $50k-75k , 0.9% for AGIs $75k-100k , 1.2% for AGIs $100k-200k , 1.4% for AGIs over 200k ) Taxes paid: $6,612 (reported on 16.8% of returns )(% of AGI for various income ranges: 0.7% for AGIs below $25k , 1.5% for AGIs $25k-50k , 2.4% for AGIs $50k-75k , 3.1% for AGIs $75k-100k , 4.6% for AGIs $100k-200k , 4.4% for AGIs over 200k ) Earned income credit: $2,144 (reported on 17.8% of returns )(% of AGI for various income ranges: 5.7% for AGIs below $25k , 0.9% for AGIs $25k-50k ) Percentage of individuals using paid preparers for their 2012 taxes: 41.3%(% for various income ranges: 39.4% for AGIs below $25k , 37.2% for AGIs $25k-50k , 46.9% for AGIs $50k-75k , 46.7% for AGIs $75k-100k , 50.0% for AGIs $100k-200k , 66.7% for AGIs over 200k )
Averages for the 2004 tax year for zip code 15120, filed in 2005:
Average Adjusted Gross Income (AGI) in 2004: $33,077 (Individual Income Tax Returns) Here:
$33,077State:
$48,049
Salary/wage: $31,969 (reported on 82.5% of returns )Here:
$31,969State:
$42,646
(% of AGI for various income ranges: 75.1% for AGIs below $10k , 72.0% for AGIs $10k-25k , 81.1% for AGIs $25k-50k , 83.9% for AGIs $50k-75k , 85.5% for AGIs $75k-100k , 73.7% for AGIs over 100k ) Taxable interest for individuals: $1,439 (reported on 43.7% of returns )This zip code:
$1,439Pennsylvania:
$1,657
(% of AGI for various income ranges: 4.1% for AGIs below $10k , 2.8% for AGIs $10k-25k , 1.7% for AGIs $25k-50k , 1.5% for AGIs $50k-75k , 0.9% for AGIs $75k-100k , 2.7% for AGIs over 100k ) Taxable dividends: $1,643 (reported on 21.0% of returns )(% of AGI for various income ranges: 2.3% for AGIs below $10k , 1.3% for AGIs $10k-25k , 0.9% for AGIs $25k-50k , 0.7% for AGIs $50k-75k , 0.7% for AGIs $75k-100k , 1.7% for AGIs over 100k ) Net capital gain/loss: +$1,696 (reported on 13.3% of returns )Here:
+$1,696State:
+$9,716
(% of AGI for various income ranges: -1.1% for AGIs below $10k , 0.2% for AGIs $10k-25k , 0.4% for AGIs $25k-50k , 0.4% for AGIs $50k-75k , 1.2% for AGIs $75k-100k , 2.0% for AGIs over 100k ) Profit/loss from business: +$9,864 (reported on 8.7% of returns )Here:
+$9,864State:
+$14,267
(% of AGI for various income ranges: 3.3% for AGIs below $10k , 3.1% for AGIs $10k-25k , 2.1% for AGIs $25k-50k , 1.8% for AGIs $50k-75k , 1.8% for AGIs $75k-100k , 4.9% for AGIs over 100k ) IRA payment deduction: $2,740 (reported on 2.3% of returns )15120:
$2,740Pennsylvania:
$2,903
(% of AGI for various income ranges: 0.3% for AGIs $10k-25k , 0.3% for AGIs $25k-50k , 0.2% for AGIs $50k-75k , 0.1% for AGIs $75k-100k , 0.1% for AGIs over 100k ) Self-employed pension: $7,240 (reported on 0.3% of returns )Here:
$7,240Pennsylvania:
$14,674
Total itemized deductions: $13,225 (20% of AGI, reported on 18.3% of returns )Here:
$13,225State:
$18,804
Here:
19.9% of AGIState:
19.5% of AGI
(% of AGI for various income ranges: 5.5% for AGIs below $10k , 3.5% for AGIs $10k-25k , 5.7% for AGIs $25k-50k , 8.3% for AGIs $50k-75k , 9.9% for AGIs $75k-100k , 10.4% for AGIs over 100k ) Charity contributions deductions: $2,209 (3% of AGI, reported on 16.5% of returns )Here:
3.2% of AGIState:
3.3% of AGI
(% of AGI for various income ranges: 0.4% for AGIs below $10k , 0.4% for AGIs $10k-25k , 0.7% for AGIs $25k-50k , 1.3% for AGIs $50k-75k , 1.6% for AGIs $75k-100k , 1.8% for AGIs over 100k ) Total tax: $4,201 (reported on 72.3% of returns )(% of AGI for various income ranges: 1.6% for AGIs below $10k , 4.1% for AGIs $10k-25k , 7.5% for AGIs $25k-50k , 9.4% for AGIs $50k-75k , 10.8% for AGIs $75k-100k , 17.0% for AGIs over 100k ) Earned income credit: $1,610 (reported on 15.9% of returns )Percentage of individuals using paid preparers for their 2004 taxes: 45.4%(% for various income ranges: 39.6% for AGIs below $10k , 47.4% for AGIs $10k-25k , 46.4% for AGIs $25k-50k , 46.2% for AGIs $50k-75k , 46.9% for AGIs $75k-100k , 53.3% for AGIs over 100k )
Estimated median household income in 2022: This zip code:
$48,869Pennsylvania:
$71,798
Nearest zip codes: 15207 ,
15218 ,
15122 ,
15217 ,
15104 ,
15034 .
Whitaker Zip Code Map
Percentage of family households: This zip code:
33.6%Pennsylvania:
42.6%
Percentage of households with unmarried partners: This zip code:
5.9%Pennsylvania:
46.5%
Likely homosexual households (counted as self-reported same-sex unmarried-partner households)
Lesbian couples: 0.1% of all households Gay men: 0.2% of all households
Household received Food Stamps/SNAP in the past 12 months: 1,828Household did not receive Food Stamps/SNAP in the past 12 months: 6,748
Women who had a birth in the past 12 months: 466 (283 now married , 172 unmarried) Women who did not have a birth in the past 12 months: 3,661 (1,045 now married , 2,630 unmarried)
Housing units in zip code 15120 with a mortgage: 2,622 (226
second mortgage , 190
both second mortgage and home equity loan )
Houses without a mortgage: 224
Median monthly owner costs for units with a mortgage: $1,100
Median monthly owner costs for units without a mortgage: $481
Residents with income below the poverty level in 2022:
This zip code:
16.2%Whole state:
11.8%
Residents with income below 50% of the poverty level in 2022:
This zip code:
10.7%Whole state:
6.1%
Median number of rooms in houses and condos: Median number of rooms in apartments: Notable locations in this zip code not listed on our city pages
Click to draw/clear zip code borders Notable locations in zip code 15120: (A) , Barrett Elementary School Library (B) , Conleys Creative Child Care Center (C) , East Valley Area Boy Scouts of America (D) , Electric Rainbow Child Development Center (E) , Homestead Borough Hall (F) , Homestead Police Department (G) , Carnegie Library of Homestead (H) , Munhall Police Department (I) , Steel Valley Senior High School Library (J) , West Homestead Borough Hall (K) , West Homestead Police Department (L) , Munhall Volunteer Fire Department 2 Station 201 (M) , Homestead Volunteer Fire Department (N) , West Homestead Volunteer Fire Department Station 292 (O) , Homestead Transfer Station (P) , Whitaker Volunteer Fire Department Station 298 (Q) , Munhall Volunteer Fire Department 4 Station 203 (R) , Munhall Volunteer Fire Department 5 Station 204 (S) , Munhall Volunteer Fire Department 1 Station 200 (T) . Display/hide their locations on the map
Shopping Center: (1) . Display/hide its location on the map
Churches in zip code 15120 include: (A) , Homestead Park United Methodist Church (B) , Whitaker United Methodist Church (C) , Saint Rita Church (D) , Saint Maximilian Kolbe Church (E) , Saint Matthews Episcopal Church (F) , Prayer and Deliverance Church of God in Christ (G) , First Hungarian Reformed Church (H) , Abundant Mercy Ministry (I) . Display/hide their locations on the map
Cemetery: (1) . Display/hide its location on the map
Streams, rivers, and creeks: (A) , Homestead Run (B) . Display/hide their locations on the map
Year house built (houses)
6 2020 or later24 2010 to 2019274 2000 to 2009198 1990 to 1999281 1980 to 1989653 1970 to 19791,227 1960 to 19692,544 1950 to 19591,271 1940 to 19493,142 1939 or earlier
Zip code 15120 household income distribution in 2022 660 Less than $10,000514 $10,000 to $14,999476 $15,000 to $19,999467 $20,000 to $24,999430 $25,000 to $29,999481 $30,000 to $34,999510 $35,000 to $39,999426 $40,000 to $44,999350 $45,000 to $49,999708 $50,000 to $59,999824 $60,000 to $74,999707 $75,000 to $99,999749 $100,000 to $124,999468 $125,000 to $149,999462 $150,000 to $199,999320 $200,000 or moreEstimate of home value of owner-occupied houses/condos in 2022 in zip code 15120 40 Less than $10,00029 $10,000 to $14,99970 $15,000 to $19,999135 $20,000 to $24,99918 $25,000 to $29,999154 $30,000 to $34,999150 $35,000 to $39,99988 $40,000 to $49,999149 $50,000 to $59,999231 $60,000 to $69,999189 $70,000 to $79,999621 $80,000 to $89,999288 $90,000 to $99,999584 $100,000 to $124,999599 $125,000 to $149,999639 $150,000 to $174,999219 $175,000 to $199,999191 $200,000 to $249,99971 $250,000 to $299,99999 $300,000 to $399,999135 $400,000 to $499,99927 $500,000 to $749,999Rent paid by renters in 2022 in zip code 15120 37 $100 to $14925 $150 to $199116 $200 to $249169 $250 to $29951 $300 to $349115 $350 to $399442 $400 to $449179 $450 to $499250 $500 to $549129 $550 to $599273 $600 to $649137 $650 to $699213 $700 to $749129 $750 to $799251 $800 to $899184 $900 to $999203 $1,000 to $1,249151 $1,250 to $1,499101 $1,500 to $1,99924 $2,000 to $2,499123 No cash rent
Median gross rent in 2022: $789.
Median price asked for vacant for-sale houses and condos in 2022: $388,388.
Estimated median house (or condo) value in 2022 for: White Non-Hispanic householders: $123,395Black or African American householders: $87,967American Indian or Alaska Native householders: $171,103Asian householders: $162,447Native Hawaiian and other Pacific Islander householders: $130,843Some other race householders: $68,038Two or more races householders: $128,428Hispanic or Latino householders: $65,019Estimated median house or condo value in 2022: $119,168
15120:
$119,168Pennsylvania:
$245,500
Lower value quartile - upper value quartile: $88,911 - $164,813
Mean price in 2022: Detached houses: $141,812Here:
$141,812State:
$317,202
Townhouses or other attached units: $74,817Here:
$74,817State:
$254,369
In 2-unit structures: $62,059Here:
$62,059State:
$249,182
In 5-or-more-unit structures: $492,182Here:
$492,182State:
$320,068
Housing units in structures:
One, detached: 6,715One, attached: 471Two: 6403 or 4: 5445 to 9: 49510 to 19: 15320 to 49: 19750 or more: 536Mobile homes: 75Unemployment : 5.9%
Means of transportation to work in zip code 15120 67.7% 5,744 Drove a car alone7.7% 657 Carpooled6.7% 567 Bus or trolley bus0.6% 51 Streetcar or trolley car0.0% 3 Taxi2.3% 191 Walked1.2% 104 Other means11.6% 985 Worked at homeTravel time to work (commute) in zip code 15120 243 Less than 5 minutes726 5 to 9 minutes672 10 to 14 minutes1,186 15 to 19 minutes792 20 to 24 minutes709 25 to 29 minutes1,357 30 to 34 minutes273 35 to 39 minutes217 40 to 44 minutes549 45 to 59 minutes593 60 to 89 minutes98 90 or more minutes
Neighborhoods in zip code 15120: Percentage of zip code residents living and working in this county: 96.1%
Household type by relationship:
Households: 18,111
Male householders: 3,271 (1,298 living alone ), Female householders: 5,291 (2,406 living alone )2,853 spouses (2,816 opposite-sex spouses ), 742 unmarried partners , (653 opposite-sex unmarried partners ), 4,694 children (4,454 natural , 94 adopted , 147 stepchildren ), 323 grandchildren , 180 brothers or sisters , 145 parents , 0 foster children , 260 other relatives , 304 non-relatives In group quarters: 105 (-1 institutionalized population )
Size of family households: 2,158 2-persons , 878 3-persons , 723 4-persons , 363 5-persons , 64 6-persons , 50 7-or-more-persons
Size of nonfamily households: 3,703 1-person , 603 2-persons , 32 3-persons
1,863 married couples with children. single-parent households (107 men , 1,098 women ).
95.1% of residents of 15120 zip code speak English at home. of residents speak Spanish at home (91% very well, 4% well, 5% not well ).of residents speak other Indo-European language at home (53% very well, 21% well, 22% not well, 4% not at all ).of residents speak Asian or Pacific Island language at home (34% very well, 16% well, 50% not well ).of residents speak other language at home (96% very well, 4% well ).
Foreign born population: 510 (2.8%)
(82.7%
of them are naturalized citizens )
This zip code:
2.8%Whole state:
7.5%
21% Japan 16% Honduras 12% Serbia 6% Sri Lanka 6% Romania 5% Ukraine 4% Algeria 15% Irish 10% German 8% Italian 8% American 8% Slovak 4% Polish 2% European
Year of entry for the foreign-born population
134 2010 or later 103 2000 to 2009 141 1990 to 1999 237 Before 1990
Facilities with environmental interests located in this zip code:
BARRETT EL SCH ( in HOMESTEAD, PA)
(National Center for Education Statistics) - STATE ID-0193 Organizations: STEEL VALLEY SD (SCHOOL DISTRICT)
AMERICAN SHEAR KNIFE MANUFACTURING (501 WEST SEVENTH AVENUE in WEST HOMESTEAD, PA)
AIR MINOR (AIRS/AFS) Conditionally Exempt Small Quantity Generators, less than 100 kg/month of hazardous waste (Resource Conservation and Recovery Act (tracking hazardous waste)) - notification Business SIC classification: HAND AND EDGE TOOLS, EXCEPT MACHINE TOOLS AND HANDSAWSBusiness NAICS classification: HAND AND EDGE TOOL MANUFACTURING.; ROLLING MILL MACHINERY AND EQUIPMENT MANUFACTURING.; POWER-DRIVEN HANDTOOL MANUFACTURING.Organizations: OPERNAME (CONTACT/OPERATOR)
Alternative names: AMERICAN SHEAN KNIFE, AMER SHEAN KNIFE MANUFACTURING, AMERICAN SHEAR KNIFE DIVISION
AAMCO TRANSMISSIONS SERVICE (530 EAST 8TH AVENUE in MUNHALL, PA)
(Resource Conservation and Recovery Act (tracking hazardous waste)) Business NAICS classification: AUTOMOTIVE TRANSMISSION REPAIR.Organizations: OPERNAME (CONTACT/OPERATOR)
ACHA HOMESTEAD APARTMENTS (EIGHTH AVENUE in HOMESTEAD, PA)
AIR MINOR (AIRS/AFS) Business SIC classification: OPERATORS OF APARTMENT BUILDINGSAlternative names: ALLEGHENY COUNTY HOUSING AUTHORITY
AMOCO OIL CO. FACILITY 3538 (MAIN ST & CENTRE AVE in MUNHALL, PA)
AIR MINOR (AIRS/AFS) Business SIC classification: GASKETS, PACKING, AND SEALING DEVICES
ANTHONYS AUTO RECONSTRUCTION (951 FOREST AVE in W HOMESTEAD, PA)
Conditionally Exempt Small Quantity Generators, less than 100 kg/month of hazardous waste (Resource Conservation and Recovery Act (tracking hazardous waste)) - notification Organizations: RICHARD BALLOG (CONTACT/OWNER)
BAKOTAS AUTO SVC (1900 WHITAKER WAY in MUNHALL, PA)
Conditionally Exempt Small Quantity Generators, less than 100 kg/month of hazardous waste (Resource Conservation and Recovery Act (tracking hazardous waste)) - notification Organizations: BAKOTA DONALD (CONTACT/OWNER)
Housing units lacking complete plumbing facilities: 2.6%
Housing units lacking complete kitchen facilities: 2.8%
88.3% Utility gas 8.6% Electricity 1.4% Bottled, tank, or LP gas 0.8% Fuel oil, kerosene, etc.
Population in 1990: 21,866.
Place of birth for U.S.-born residents:
This state: 15,762Northeast: 322Midwest: 411South: 635West: 216
69% of the 15120 zip code residents lived in the same house 5 years ago.
Out of people who lived in different houses, 86% lived in this county.
Out of people who lived in different counties, 50% lived in Pennsylvania.
92% of the 15120 zip code residents lived in the same house 1 year ago.
Out of people who lived in different houses, 81% moved from this county.
Out of people who lived in different houses, 8% moved from different county within same state.
Out of people who lived in different houses, 8% moved from different state.
Out of people who lived in different houses, 2% moved from abroad.
Private vs. public school enrollment:
Students in private schools in grades 1 to 8 (elementary and middle school): 189
Here:
15.0%Pennsylvania:
15.7%
Students in private schools in grades 9 to 12 (high school): 96
Here:
13.6%Pennsylvania:
13.4%
Students in private undergraduate colleges: 195
Here:
31.9%Pennsylvania:
39.8%
Occupation by median earnings in the past 12 months ($)
81,498 Health diagnosing and treating practitioners and other technical occupations 72,749 Architecture and engineering occupations 71,333 Management occupations 64,273 Computer and mathematical occupations 63,651 Legal occupations 62,504 Education, training, and library occupations
Companies with federal contracts located in this zip code:
BROWNS HILL SAND & GLASS BLOCK (135 W 7TH AVE in HOMESTEAD, PA; small business)
$28,350 with U.S. Army Corps of Engineers - civil program financing only for Miscellaneous Items. Signed on 2002-07-02. Completion date: 2002-11-01.
Top industries in this zip code by the number of employees in 2005:
Accommodation and Food Services: Full-Service Restaurants (100-249 employees: 5 establishments, 50-99 employees: 6 establishments, 20-49 employees: 1 establishment, 10-19 employees: 2 establishments, 5-9 employees: 4 establishments, 1-4 employees: 4 establishments)Accommodation and Food Services: Limited-Service Restaurants (50-99: 1, 20-49: 7, 10-19: 3, 5-9: 2, 1-4: 4)Professional, Scientific, and Technical Services: Engineering Services (250-499: 1)Health Care and Social Assistance: Ambulance Services (100-249: 1, 20-49: 2)Administrative and Support and Waste Management and Remediation Services: Janitorial Services (100-249: 1, 10-19: 2, 5-9: 1, 1-4: 1)Information: Motion Picture Theaters (except Drive-Ins) (100-249: 1, 10-19: 1)Health Care and Social Assistance: Outpatient Mental Health and Substance Abuse Centers (100-249: 1, 1-4: 2)
People in group quarters in 2010:
47 people in nursing facilities/skilled-nursing facilities
14 people in group homes intended for adults
13 people in other noninstitutional facilities
12 people in residential treatment centers for adults
People in group quarters in 2000:
96 people in nursing homes
84 people in religious group quarters
72 people in other group homes
15 people in other noninstitutional group quarters
4 people in other nonhousehold living situations
3 people in homes for the mentally ill
Fatal accident statistics in 2012:
Fatal accident count: 2Vehicles involved in fatal accidents: 3Fatal accidents caused by drunken drivers: 0Fatalities: 2Persons involved in fatal accidents: 3Pedestrians involved in fatal accidents: 1
Home Mortgage Disclosure Act Aggregated Statistics For Year 2009(Based on 4 full and 10 partial tracts) A) FHA, FSA/RHS & VA B) Conventional C) Refinancings D) Home Improvement Loans E) Loans on Dwellings For 5+ Families F) Non-occupant Loans on G) Loans On Manufactured Number Average Value Number Average Value Number Average Value Number Average Value Number Average Value Number Average Value Number Average Value
LOANS ORIGINATED 139 $83,023 89 $73,293 208 $92,229 65 $26,850 4 $1,072,390 23 $47,127 0 $0 APPLICATIONS APPROVED, NOT ACCEPTED 4 $101,578 11 $84,379 27 $72,236 15 $23,833 2 $127,090 6 $60,515 0 $0 APPLICATIONS DENIED 7 $64,286 20 $68,234 194 $92,085 73 $14,752 0 $0 17 $60,306 2 $58,295 APPLICATIONS WITHDRAWN 18 $69,556 9 $59,513 90 $83,977 15 $53,008 2 $358,000 6 $39,472 0 $0 FILES CLOSED FOR INCOMPLETENESS 4 $76,065 4 $67,140 13 $93,046 4 $18,958 0 $0 0 $0 0 $0
Aggregated Statistics For Year 2008(Based on 4 full and 10 partial tracts) A) FHA, FSA/RHS & VA B) Conventional C) Refinancings D) Home Improvement Loans E) Loans on Dwellings For 5+ Families F) Non-occupant Loans on Number Average Value Number Average Value Number Average Value Number Average Value Number Average Value Number Average Value
LOANS ORIGINATED 120 $78,142 120 $83,259 203 $87,161 95 $26,764 2 $388,825 63 $57,726 APPLICATIONS APPROVED, NOT ACCEPTED 0 $0 11 $59,032 38 $72,070 12 $16,684 4 $295,140 7 $51,581 APPLICATIONS DENIED 7 $72,493 20 $72,602 303 $79,298 142 $31,533 0 $0 30 $60,363 APPLICATIONS WITHDRAWN 6 $81,133 4 $62,902 60 $83,621 14 $36,688 0 $0 4 $60,060 FILES CLOSED FOR INCOMPLETENESS 2 $74,640 4 $25,320 16 $107,911 8 $23,229 0 $0 0 $0
Aggregated Statistics For Year 2007(Based on 4 full and 10 partial tracts) A) FHA, FSA/RHS & VA B) Conventional C) Refinancings D) Home Improvement Loans E) Loans on Dwellings For 5+ Families F) Non-occupant Loans on G) Loans On Manufactured Number Average Value Number Average Value Number Average Value Number Average Value Number Average Value Number Average Value Number Average Value
LOANS ORIGINATED 67 $81,926 225 $65,295 310 $69,553 146 $30,349 7 $4,822,830 78 $56,276 2 $43,790 APPLICATIONS APPROVED, NOT ACCEPTED 5 $60,574 34 $55,078 72 $68,012 31 $44,963 0 $0 21 $59,929 2 $43,790 APPLICATIONS DENIED 8 $152,239 65 $69,191 514 $76,000 222 $35,113 0 $0 69 $56,692 0 $0 APPLICATIONS WITHDRAWN 9 $81,969 29 $62,984 105 $68,078 17 $33,661 4 $102,905 6 $43,027 0 $0 FILES CLOSED FOR INCOMPLETENESS 2 $54,595 5 $80,588 30 $96,965 4 $49,925 0 $0 5 $70,104 0 $0
Aggregated Statistics For Year 2006(Based on 4 full and 10 partial tracts) A) FHA, FSA/RHS & VA B) Conventional C) Refinancings D) Home Improvement Loans E) Loans on Dwellings For 5+ Families F) Non-occupant Loans on G) Loans On Manufactured Number Average Value Number Average Value Number Average Value Number Average Value Number Average Value Number Average Value Number Average Value
LOANS ORIGINATED 53 $71,804 306 $62,032 408 $67,028 215 $21,614 9 $203,846 101 $58,989 1 $55,340 APPLICATIONS APPROVED, NOT ACCEPTED 0 $0 25 $56,555 109 $55,494 35 $20,366 0 $0 13 $36,773 0 $0 APPLICATIONS DENIED 0 $0 77 $52,124 529 $73,023 243 $25,672 2 $534,190 76 $39,431 4 $63,470 APPLICATIONS WITHDRAWN 0 $0 58 $70,988 211 $76,723 7 $39,691 0 $0 16 $77,342 0 $0 FILES CLOSED FOR INCOMPLETENESS 0 $0 9 $70,508 29 $80,037 4 $28,305 0 $0 8 $49,724 1 $104,640
Aggregated Statistics For Year 2005(Based on 4 full and 10 partial tracts) A) FHA, FSA/RHS & VA B) Conventional C) Refinancings D) Home Improvement Loans E) Loans on Dwellings For 5+ Families F) Non-occupant Loans on G) Loans On Manufactured Number Average Value Number Average Value Number Average Value Number Average Value Number Average Value Number Average Value Number Average Value
LOANS ORIGINATED 69 $72,933 266 $60,569 515 $64,029 234 $24,748 9 $179,389 168 $47,021 0 $0 APPLICATIONS APPROVED, NOT ACCEPTED 2 $91,855 32 $73,975 120 $72,555 27 $21,718 0 $0 24 $64,683 0 $0 APPLICATIONS DENIED 0 $0 75 $70,691 595 $69,511 312 $16,781 2 $55,290 158 $20,742 4 $63,098 APPLICATIONS WITHDRAWN 6 $62,972 38 $72,704 210 $87,935 36 $105,798 0 $0 18 $101,417 0 $0 FILES CLOSED FOR INCOMPLETENESS 0 $0 9 $70,300 71 $90,988 4 $28,305 2 $129,225 9 $93,312 0 $0
Aggregated Statistics For Year 2004(Based on 4 full and 10 partial tracts) A) FHA, FSA/RHS & VA B) Conventional C) Refinancings D) Home Improvement Loans E) Loans on Dwellings For 5+ Families F) Non-occupant Loans on G) Loans On Manufactured Number Average Value Number Average Value Number Average Value Number Average Value Number Average Value Number Average Value Number Average Value
LOANS ORIGINATED 61 $65,789 249 $66,155 669 $59,932 221 $23,176 13 $235,342 156 $40,467 9 $14,784 APPLICATIONS APPROVED, NOT ACCEPTED 0 $0 47 $59,886 105 $63,090 53 $28,867 2 $209,430 23 $29,838 4 $25,062 APPLICATIONS DENIED 5 $38,882 71 $66,536 700 $65,670 342 $14,190 0 $0 184 $16,134 4 $63,982 APPLICATIONS WITHDRAWN 3 $110,363 24 $70,474 241 $61,799 18 $37,911 0 $0 15 $35,890 4 $69,148 FILES CLOSED FOR INCOMPLETENESS 0 $0 18 $56,135 68 $85,549 10 $39,111 0 $0 5 $69,820 0 $0
Aggregated Statistics For Year 2003(Based on 4 full and 10 partial tracts) A) FHA, FSA/RHS & VA B) Conventional C) Refinancings D) Home Improvement Loans E) Loans on Dwellings For 5+ Families F) Non-occupant Loans on Number Average Value Number Average Value Number Average Value Number Average Value Number Average Value Number Average Value
LOANS ORIGINATED 90 $66,517 249 $64,605 1,022 $64,417 227 $24,755 4 $80,810 166 $47,604 APPLICATIONS APPROVED, NOT ACCEPTED 9 $72,846 45 $64,417 252 $60,767 28 $20,488 0 $0 15 $31,118 APPLICATIONS DENIED 4 $27,582 58 $52,187 691 $60,010 185 $12,722 2 $381,690 81 $27,558 APPLICATIONS WITHDRAWN 2 $84,590 36 $56,596 257 $68,606 35 $14,359 2 $112,365 20 $50,882 FILES CLOSED FOR INCOMPLETENESS 0 $0 17 $44,262 52 $75,667 6 $47,512 0 $0 13 $38,282
Aggregated Statistics For Year 2002(Based on 4 full and 8 partial tracts) A) FHA, FSA/RHS & VA B) Conventional C) Refinancings D) Home Improvement Loans F) Non-occupant Loans on Number Average Value Number Average Value Number Average Value Number Average Value Number Average Value
LOANS ORIGINATED 66 $66,522 213 $56,510 658 $57,643 141 $22,601 123 $43,889 APPLICATIONS APPROVED, NOT ACCEPTED 4 $74,640 27 $54,852 210 $64,420 23 $24,434 21 $59,623 APPLICATIONS DENIED 8 $66,254 58 $42,883 584 $56,518 114 $16,998 49 $44,680 APPLICATIONS WITHDRAWN 7 $44,026 27 $53,473 301 $65,376 22 $13,255 16 $52,726 FILES CLOSED FOR INCOMPLETENESS 0 $0 13 $62,684 89 $65,622 1 $10,060 7 $63,529
Aggregated Statistics For Year 2001(Based on 4 full and 8 partial tracts) A) FHA, FSA/RHS & VA B) Conventional C) Refinancings D) Home Improvement Loans E) Loans on Dwellings For 5+ Families F) Non-occupant Loans on Number Average Value Number Average Value Number Average Value Number Average Value Number Average Value Number Average Value
LOANS ORIGINATED 67 $61,033 162 $53,938 588 $49,479 224 $23,028 6 $103,762 73 $35,575 APPLICATIONS APPROVED, NOT ACCEPTED 0 $0 26 $44,020 195 $56,232 40 $17,229 0 $0 7 $46,261 APPLICATIONS DENIED 4 $57,705 57 $44,772 577 $49,925 204 $16,097 0 $0 40 $30,775 APPLICATIONS WITHDRAWN 6 $61,787 10 $52,605 257 $53,433 43 $19,641 0 $0 7 $45,870 FILES CLOSED FOR INCOMPLETENESS 2 $34,980 7 $42,504 39 $59,375 0 $0 0 $0 4 $45,845
Aggregated Statistics For Year 2000(Based on 4 full and 8 partial tracts) A) FHA, FSA/RHS & VA B) Conventional C) Refinancings D) Home Improvement Loans E) Loans on Dwellings For 5+ Families F) Non-occupant Loans on Number Average Value Number Average Value Number Average Value Number Average Value Number Average Value Number Average Value
LOANS ORIGINATED 88 $52,182 208 $49,747 438 $45,850 248 $16,408 6 $153,745 75 $34,571 APPLICATIONS APPROVED, NOT ACCEPTED 9 $37,238 26 $56,007 139 $53,965 74 $16,591 0 $0 9 $39,927 APPLICATIONS DENIED 2 $34,010 74 $45,058 477 $49,273 231 $16,076 2 $101,135 29 $41,458 APPLICATIONS WITHDRAWN 2 $63,695 22 $56,274 174 $57,231 41 $15,404 0 $0 15 $37,018 FILES CLOSED FOR INCOMPLETENESS 2 $59,710 11 $49,256 41 $58,233 9 $24,282 0 $0 6 $33,818
Aggregated Statistics For Year 1999(Based on 3 full and 5 partial tracts) A) FHA, FSA/RHS & VA B) Conventional C) Refinancings D) Home Improvement Loans F) Non-occupant Loans on Number Average Value Number Average Value Number Average Value Number Average Value Number Average Value
LOANS ORIGINATED 64 $52,161 130 $45,837 326 $44,802 129 $15,461 58 $39,247 APPLICATIONS APPROVED, NOT ACCEPTED 3 $52,093 16 $41,515 104 $45,727 36 $18,558 7 $33,150 APPLICATIONS DENIED 5 $56,290 40 $40,728 257 $41,831 125 $16,560 25 $33,767 APPLICATIONS WITHDRAWN 5 $52,116 10 $69,883 101 $43,339 19 $21,038 9 $55,622 FILES CLOSED FOR INCOMPLETENESS 0 $0 2 $33,665 14 $44,571 0 $0 1 $75,280
Private Mortgage Insurance Companies Aggregated Statistics For Year 2009(Based on 4 full and 8 partial tracts) A) Conventional B) Refinancings Number Average Value Number Average Value
LOANS ORIGINATED 20 $91,242 6 $143,705 APPLICATIONS APPROVED, NOT ACCEPTED 2 $57,810 6 $83,128 APPLICATIONS DENIED 2 $53,740 2 $126,310 APPLICATIONS WITHDRAWN 0 $0 2 $112,460 FILES CLOSED FOR INCOMPLETENESS 0 $0 0 $0
Aggregated Statistics For Year 2008(Based on 4 full and 10 partial tracts) A) Conventional B) Refinancings C) Non-occupant Loans on Number Average Value Number Average Value Number Average Value
LOANS ORIGINATED 58 $72,684 21 $88,453 19 $47,397 APPLICATIONS APPROVED, NOT ACCEPTED 4 $63,300 18 $85,767 2 $47,770 APPLICATIONS DENIED 2 $118,430 4 $62,698 2 $62,700 APPLICATIONS WITHDRAWN 0 $0 0 $0 0 $0 FILES CLOSED FOR INCOMPLETENESS 0 $0 2 $136,995 0 $0
Aggregated Statistics For Year 2007(Based on 4 full and 10 partial tracts) A) Conventional B) Refinancings C) Non-occupant Loans on Number Average Value Number Average Value Number Average Value
LOANS ORIGINATED 68 $72,073 33 $91,364 9 $34,082 APPLICATIONS APPROVED, NOT ACCEPTED 12 $53,356 8 $83,165 6 $56,560 APPLICATIONS DENIED 7 $59,369 0 $0 0 $0 APPLICATIONS WITHDRAWN 0 $0 7 $84,994 7 $84,994 FILES CLOSED FOR INCOMPLETENESS 0 $0 2 $66,570 2 $66,570
Aggregated Statistics For Year 2006(Based on 4 full and 10 partial tracts) A) Conventional B) Refinancings C) Non-occupant Loans on Number Average Value Number Average Value Number Average Value
LOANS ORIGINATED 65 $62,952 32 $81,124 7 $56,060 APPLICATIONS APPROVED, NOT ACCEPTED 2 $141,795 2 $54,410 0 $0 APPLICATIONS DENIED 0 $0 4 $141,665 2 $20,595 APPLICATIONS WITHDRAWN 0 $0 4 $107,632 0 $0 FILES CLOSED FOR INCOMPLETENESS 0 $0 0 $0 0 $0
Aggregated Statistics For Year 2005(Based on 4 full and 10 partial tracts) A) Conventional B) Refinancings C) Non-occupant Loans on Number Average Value Number Average Value Number Average Value
LOANS ORIGINATED 56 $72,451 32 $101,088 16 $48,348 APPLICATIONS APPROVED, NOT ACCEPTED 4 $87,080 8 $122,140 0 $0 APPLICATIONS DENIED 4 $129,222 2 $44,590 2 $44,590 APPLICATIONS WITHDRAWN 4 $75,925 2 $38,865 2 $76,630 FILES CLOSED FOR INCOMPLETENESS 0 $0 5 $57,598 0 $0
Aggregated Statistics For Year 2004(Based on 4 full and 10 partial tracts) A) Conventional B) Refinancings C) Non-occupant Loans on Number Average Value Number Average Value Number Average Value
LOANS ORIGINATED 70 $62,657 39 $81,331 15 $47,018 APPLICATIONS APPROVED, NOT ACCEPTED 7 $56,829 12 $70,864 6 $24,337 APPLICATIONS DENIED 4 $57,722 5 $62,826 0 $0 APPLICATIONS WITHDRAWN 2 $35,035 2 $155,250 0 $0 FILES CLOSED FOR INCOMPLETENESS 0 $0 2 $27,745 2 $27,745
Aggregated Statistics For Year 2003(Based on 4 full and 10 partial tracts) A) Conventional B) Refinancings C) Non-occupant Loans on Number Average Value Number Average Value Number Average Value
LOANS ORIGINATED 91 $71,088 85 $78,610 13 $63,548 APPLICATIONS APPROVED, NOT ACCEPTED 8 $83,588 29 $102,342 0 $0 APPLICATIONS DENIED 2 $70,660 1 $63,390 0 $0 APPLICATIONS WITHDRAWN 0 $0 4 $85,588 0 $0 FILES CLOSED FOR INCOMPLETENESS 0 $0 0 $0 0 $0
Aggregated Statistics For Year 2002(Based on 4 full and 8 partial tracts) A) Conventional B) Refinancings C) Non-occupant Loans on Number Average Value Number Average Value Number Average Value
LOANS ORIGINATED 66 $57,247 50 $77,436 13 $54,818 APPLICATIONS APPROVED, NOT ACCEPTED 6 $77,043 21 $81,514 2 $67,775 APPLICATIONS DENIED 0 $0 0 $0 0 $0 APPLICATIONS WITHDRAWN 3 $120,080 8 $96,295 2 $67,775 FILES CLOSED FOR INCOMPLETENESS 0 $0 0 $0 0 $0
Aggregated Statistics For Year 2001(Based on 4 full and 8 partial tracts) A) Conventional B) Refinancings C) Non-occupant Loans on Number Average Value Number Average Value Number Average Value
LOANS ORIGINATED 49 $55,655 62 $80,653 15 $36,833 APPLICATIONS APPROVED, NOT ACCEPTED 8 $50,616 2 $59,750 0 $0 APPLICATIONS DENIED 0 $0 8 $83,109 4 $68,170 APPLICATIONS WITHDRAWN 2 $84,590 0 $0 0 $0 FILES CLOSED FOR INCOMPLETENESS 0 $0 0 $0 0 $0
Aggregated Statistics For Year 2000(Based on 4 full and 8 partial tracts) A) Conventional B) Refinancings C) Non-occupant Loans on Number Average Value Number Average Value Number Average Value
LOANS ORIGINATED 57 $60,836 30 $76,765 7 $33,437 APPLICATIONS APPROVED, NOT ACCEPTED 4 $66,618 4 $60,210 0 $0 APPLICATIONS DENIED 0 $0 10 $87,444 0 $0 APPLICATIONS WITHDRAWN 2 $69,665 1 $157,970 0 $0 FILES CLOSED FOR INCOMPLETENESS 0 $0 0 $0 0 $0
Aggregated Statistics For Year 1999(Based on 3 full and 4 partial tracts) A) Conventional B) Refinancings C) Non-occupant Loans on Number Average Value Number Average Value Number Average Value
LOANS ORIGINATED 36 $56,414 18 $63,556 4 $41,158 APPLICATIONS APPROVED, NOT ACCEPTED 3 $44,227 0 $0 1 $34,140 APPLICATIONS DENIED 0 $0 1 $100,040 0 $0 APPLICATIONS WITHDRAWN 0 $0 1 $124,980 0 $0 FILES CLOSED FOR INCOMPLETENESS 0 $0 0 $0 0 $0
2004 - 2018 National Fire Incident Reporting System (NFIRS) incidents See full 2006 National Fire Incident Reporting System statistics for zip code 15120, Pennsylvania
Most common first names in zip code 15120 among deceased individuals Name Count Lived (average)
John 702 74.3 years Mary 576 80.6 years Anna 375 81.3 years Joseph 361 74.5 years William 306 73.4 years Michael 285 74.5 years Margaret 255 77.9 years George 252 74.6 years Helen 242 78.4 years Elizabeth 225 80.4 years
Most common last names in zip code 15120 among deceased individuals Last name Count Lived (average)
Smith 66 75.7 years Miller 53 75.4 years Thomas 48 74.9 years Wilson 39 77.8 years Jones 39 76.9 years Williams 38 73.6 years Johnson 34 76.1 years Martin 32 74.4 years Harris 31 74.3 years Brown 31 74.4 years
Businesses in zip code 15120
Name Count Name Count
AT&T 1 McDonald's 1 Abercrombie & Fitch 1 Men's Wearhouse 1 Advance Auto Parts 1 Motherhood Maternity 1 Aeropostale 1 New Balance 1 American Eagle Outfitters 1 Nike 5 Ann Taylor 1 Office Depot 1 Barnes & Noble 1 Old Navy 1 Bath & Body Works 1 Panera Bread 1 Bed Bath & Beyond 1 Pizza Hut 1 Chick-Fil-A 1 RadioShack 1 Costco 1 Red Robin 1 Cricket Wireless 1 Rite Aid 1 DressBarn 1 Sprint Nextel 1 Express 1 Starbucks 1 Famous Footwear 1 Steak 'n Shake 1 FedEx 1 Subway 2 GNC 1 T-Mobile 1 Gap 1 T.G.I. Driday's 1 H&R Block 1 T.J.Maxx 1 Jones New York 1 Target 1 Journeys 1 U-Haul 1 Justice 1 UPS 2 KFC 1 Vans 1 Lane Bryant 1 Verizon Wireless 1 Lowe's 1 Victoria's Secret 1 Macy's 1 Walgreens 1 Marriott 1 Wendy's 1 Marshalls 1 Wet Seal 1
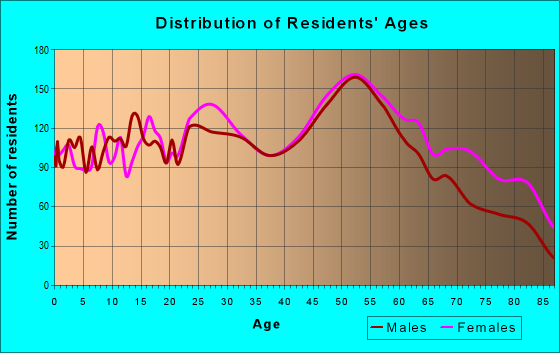
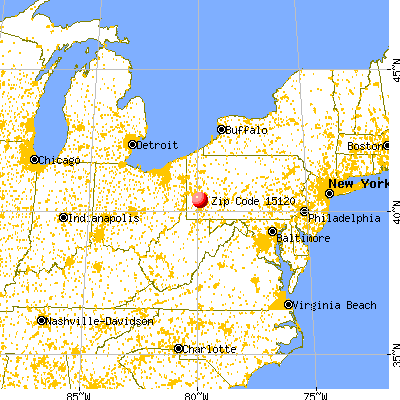


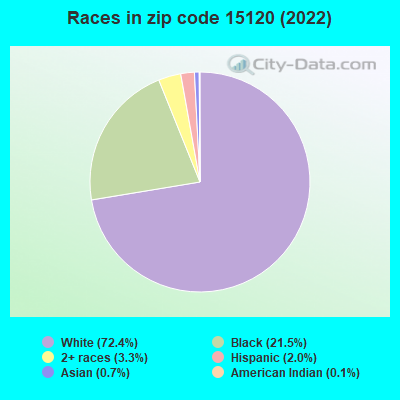


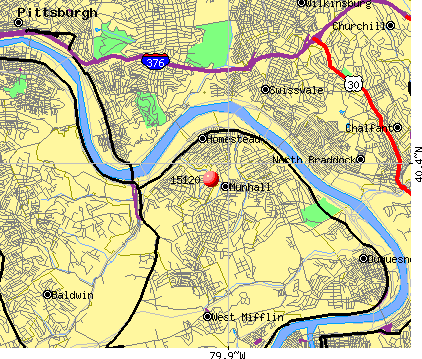 Nearest zip codes: 15207, 15218, 15122, 15217, 15104, 15034.
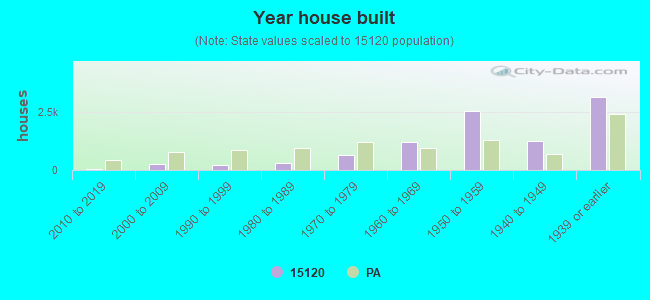
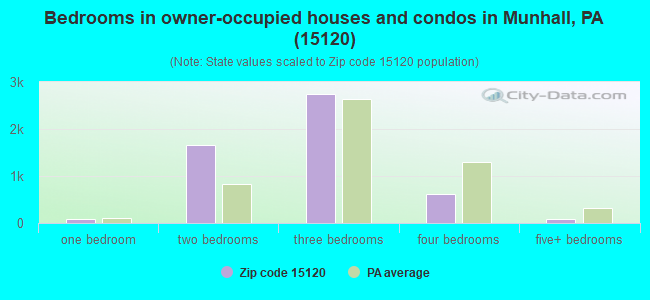
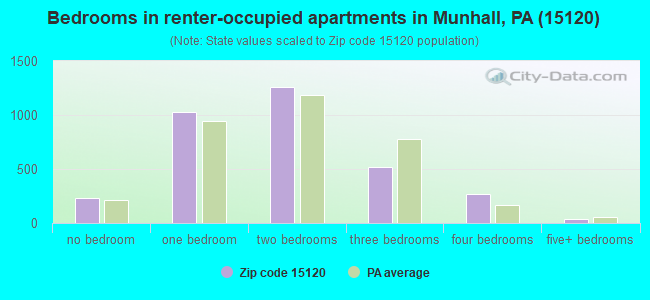
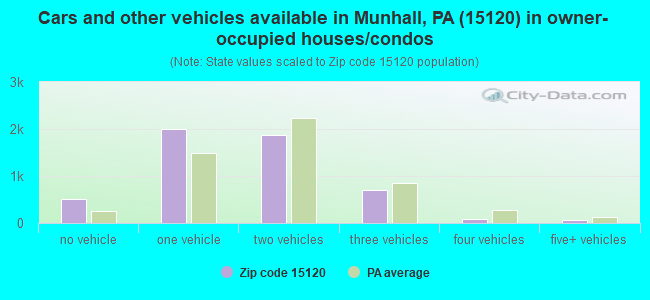
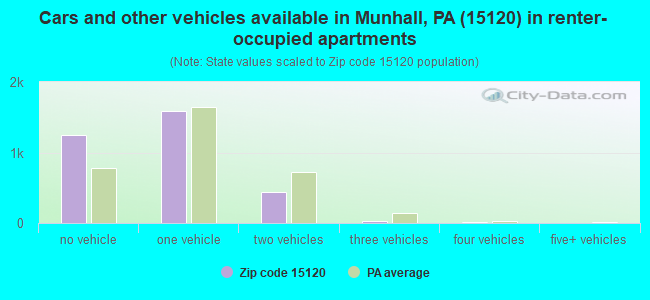


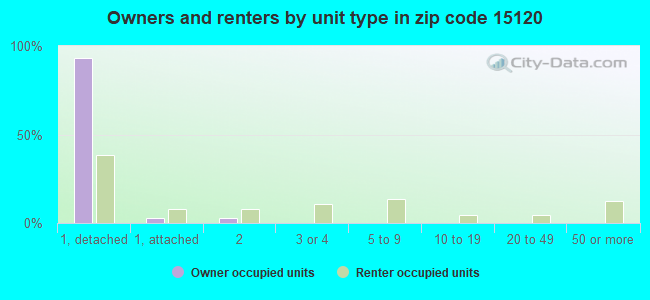
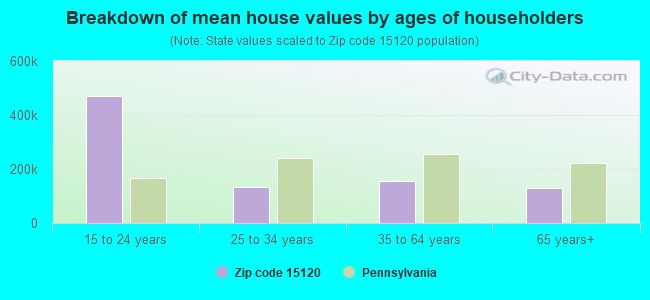


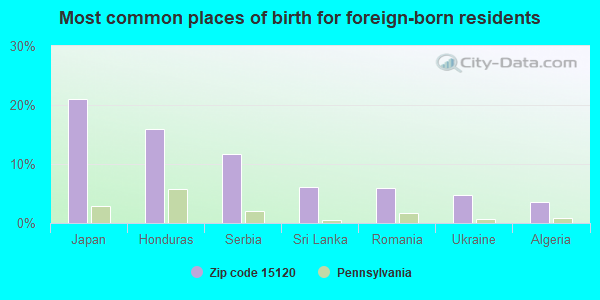
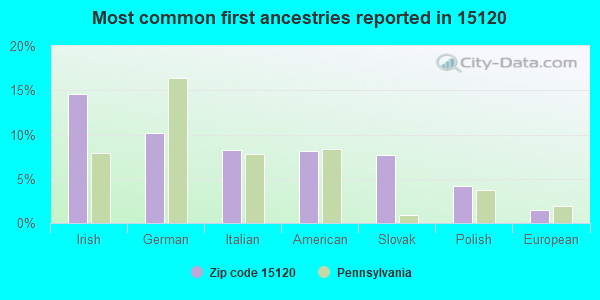
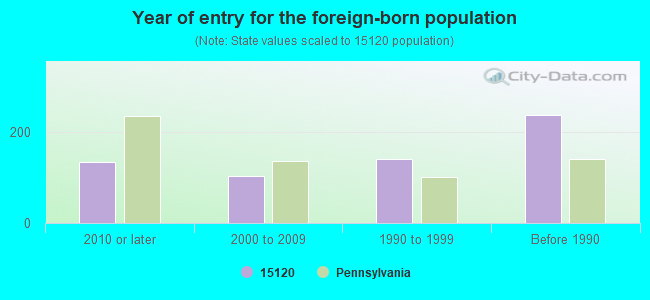


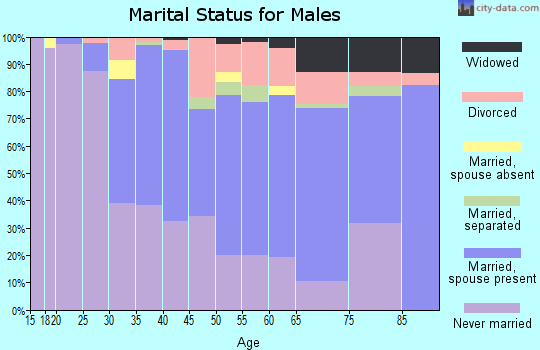
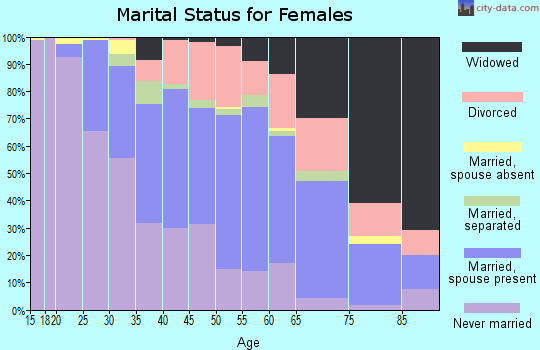
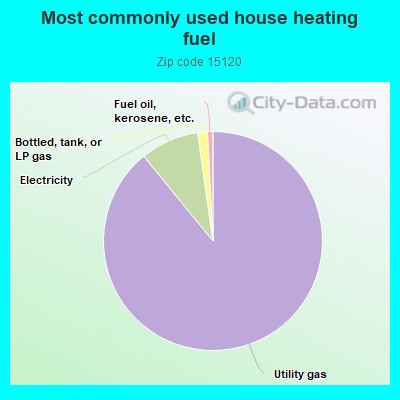
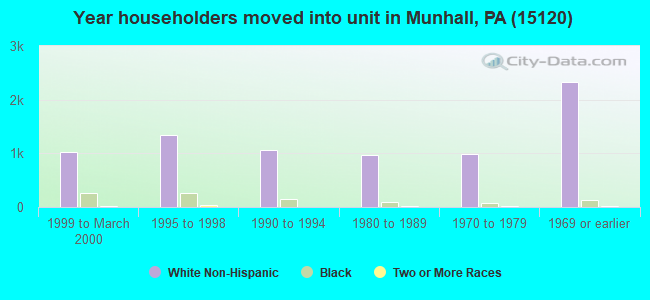
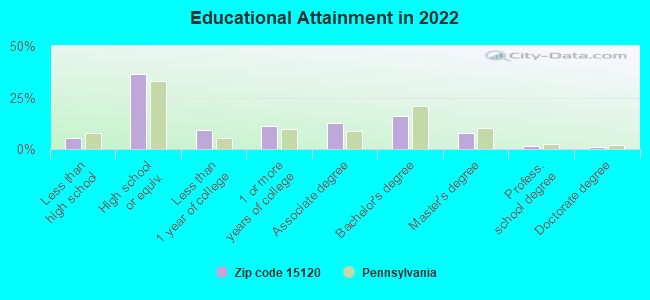
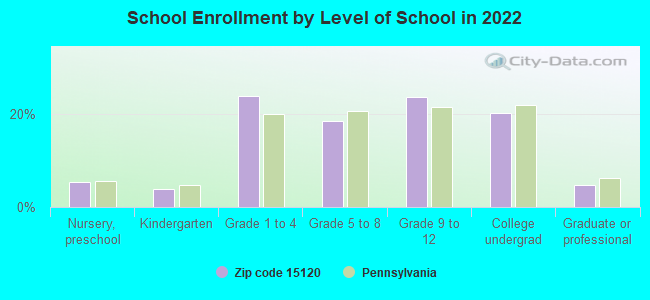
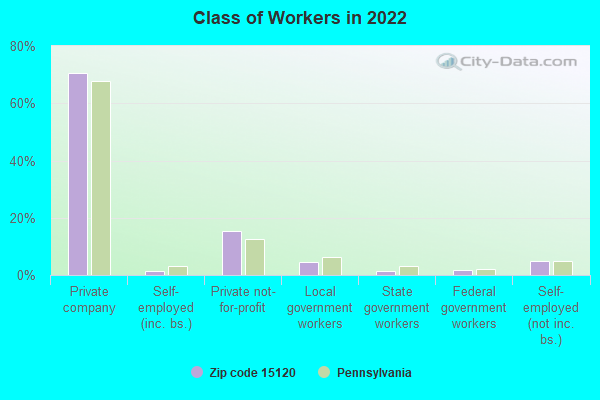
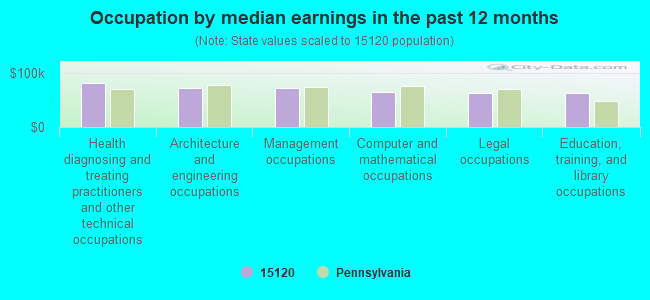
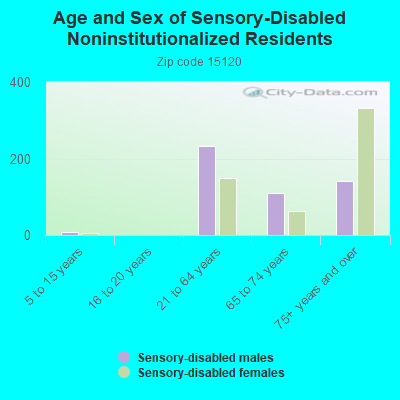
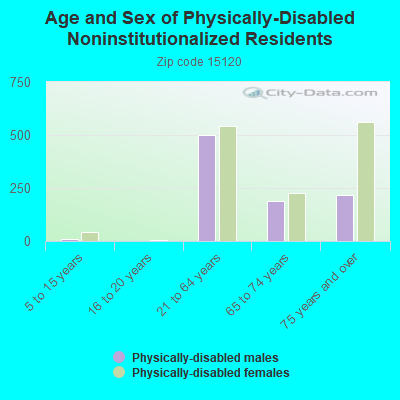
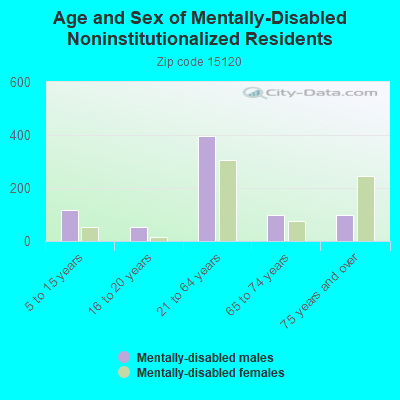
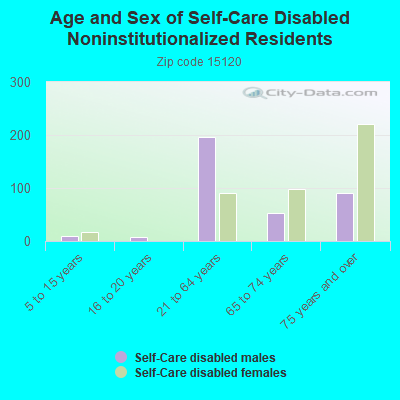
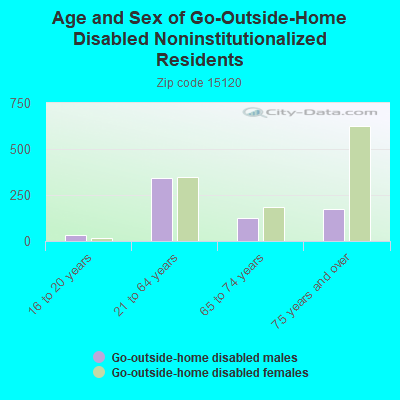
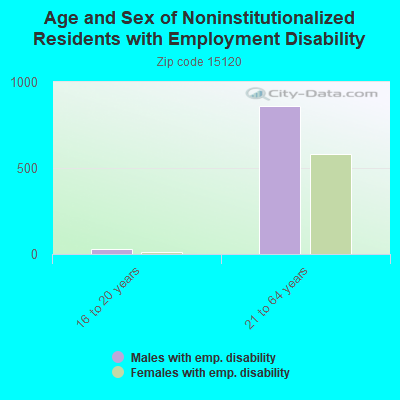
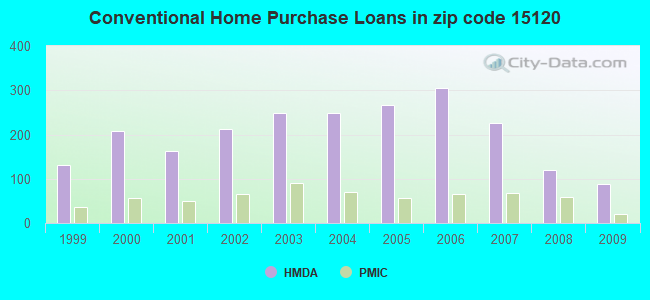
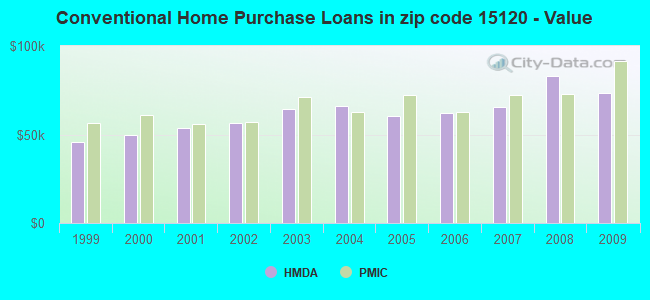
 Based on the data from the years 2004 - 2018 the average number of fires per year is 48. The highest number of fires - 121 took place in 2018, and the least - 0 in 2005. The data has a rising trend.
 When looking into fire subcategories, the most incidents belonged to: Structure Fires (54.6%), and Other (24.8%).