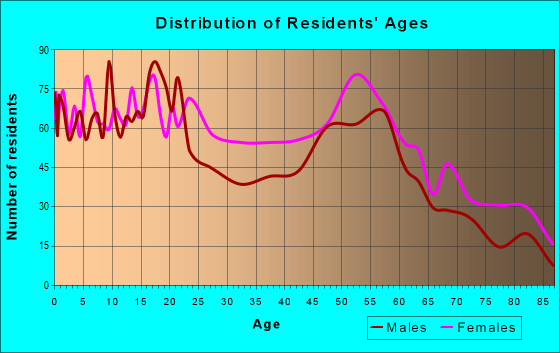
Estimated zip code population in 2022: 7,944 Zip code population in 2010: 9,038 Zip code population in 2000: 11,434
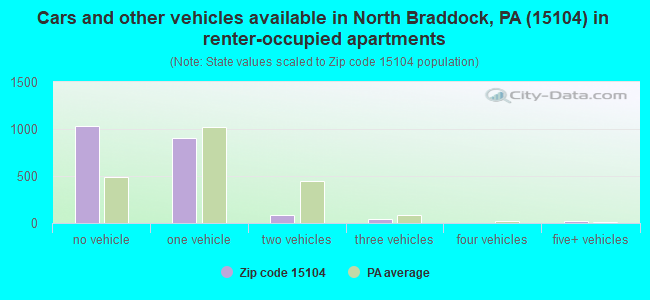
Houses and condos: 4,717 Renter-occupied apartments: 2,090
% of renters here:
56%
State:
31%
March 2022 cost of living index in zip code 15104: 90.6 (less than average, U.S. average is 100)
Land area: 2.4 sq. mi. Water area: 0.2 sq. mi.
Population density: 3,245 people per square mile
(average).
OSM Map
General Map
Google Map
MSN Map
OSM Map
General Map
Google Map
MSN Map
OSM Map
General Map
Google Map
MSN Map
OSM Map
General Map
Google Map
MSN Map
Please wait while loading the map...
Real estate property taxes paid for housing units in 2022:
This zip code:
1.6% ($946)
Pennsylvania:
1.3% ($3,094)
Median real estate property taxes paid for housing units with mortgages in 2022: $1,111 (1.5%) Median real estate property taxes paid for housing units with no mortgage in 2022: $776 (1.4%)
Averages for the 2020 tax year for zip code 15104, filed in 2021:
Average Adjusted Gross Income (AGI) in 2020: $32,491 (Individual Income Tax Returns)
Here:
$32,491
State:
$75,707
Salary/wage: $27,016 (reported on 82.3% of returns)
Here:
$27,016
State:
$62,806
(% of AGI for various income ranges: 878.8% for AGIs below $25k, 3156.7% for AGIs $25k-50k, 5796.4% for AGIs $50k-75k, 8783.3% for AGIs $75k-100k, 17884.0% for AGIs $100k-200k)
Taxable interest for individuals: $600 (reported on 11.2% of returns)
This zip code:
$600
Pennsylvania:
$1,633
(% of AGI for various income ranges: 6.1% for AGIs below $25k, 2.3% for AGIs $25k-50k, 4.6% for AGIs $50k-75k, 116.7% for AGIs $75k-100k, 22.0% for AGIs $100k-200k)
Ordinary dividends: $1,639 (reported on 5.1% of returns)
Here:
$1,639
State:
$7,382
(% of AGI for various income ranges: 2.9% for AGIs below $25k, 4.5% for AGIs $25k-50k, 11.1% for AGIs $50k-75k, 100.0% for AGIs $75k-100k, 170.0% for AGIs $100k-200k)
Net capital gain/loss in AGI: +$3,992 (reported on 3.7% of returns)
Here:
+$3,992
State:
+$23,522
(% of AGI for various income ranges: 2.8% for AGIs below $25k, 8.8% for AGIs $25k-50k, 124.4% for AGIs $75k-100k, 548.0% for AGIs $100k-200k)
Profit/loss from business: +$4,733 (reported on 9.3% of returns)
Here:
+$4,733
State:
+$16,274
(% of AGI for various income ranges: 71.2% for AGIs below $25k, 27.7% for AGIs $25k-50k, 34.3% for AGIs $50k-75k, 192.2% for AGIs $75k-100k)
Taxable individual retirement arrangement distribution: $10,681 (reported on 4.5% of returns)
15104:
$10,681
Pennsylvania:
$18,583
(% of AGI for various income ranges: 27.7% for AGIs below $25k, 27.9% for AGIs $25k-50k, 149.6% for AGIs $50k-75k, 670.0% for AGIs $75k-100k)
Total itemized deductions: $21,767 (reported on 0.8% of returns)
Here:
$21,767
State:
$34,850
(% of AGI for various income ranges: 61.0% for AGIs $25k-50k)
Charity contributions: $5,700 (reported on 0.6% of returns)
Here:
$5,700
State:
$12,392
(% of AGI for various income ranges: 10.7% for AGIs $25k-50k)
Taxes paid: $3,400 (reported on 0.8% of returns)
15104:
$3,400
State:
$8,200
(% of AGI for various income ranges: 9.5% for AGIs $25k-50k)
Earned income credit: $2,326 (reported on 31.2% of returns)
Here:
$2,326
State:
$2,100
(% of AGI for various income ranges: 119.4% for AGIs below $25k, 85.0% for AGIs $25k-50k)
Percentage of individuals using paid preparers for their 2020 taxes: 91.6%
Here:
92%
State:
92%
(% for various income ranges: 92.4% for AGIs below $25k, 93.5% for AGIs $25k-50k, 88.9% for AGIs $50k-75k, 78.6% for AGIs $75k-100k, 80.0% for AGIs $100k-200k)
Averages for the 2012 tax year for zip code 15104, filed in 2013:
Average Adjusted Gross Income (AGI) in 2012: $26,035 (Individual Income Tax Returns)
Here:
$26,035
State:
$61,346
Salary/wage: $24,248 (reported on 86.2% of returns)
Here:
$24,248
State:
$51,902
(% of AGI for various income ranges: 76.2% for AGIs below $25k, 83.8% for AGIs $25k-50k, 81.7% for AGIs $50k-75k, 81.1% for AGIs $75k-100k, 76.1% for AGIs $100k-200k)
Taxable interest for individuals: $870 (reported on 14.8% of returns)
This zip code:
$870
Pennsylvania:
$1,588
(% of AGI for various income ranges: 0.9% for AGIs below $25k, 0.4% for AGIs $25k-50k, 0.4% for AGIs $50k-75k, 0.2% for AGIs $75k-100k, 0.2% for AGIs $100k-200k)
Ordinary dividends: $1,211 (reported on 7.0% of returns)
Here:
$1,211
State:
$5,827
(% of AGI for various income ranges: 0.4% for AGIs below $25k, 0.3% for AGIs $25k-50k, 0.3% for AGIs $50k-75k, 0.5% for AGIs $75k-100k)
Net capital gain/loss in AGI: +$1,021 (reported on 3.6% of returns)
Here:
+$1,021
State:
+$14,495
(% of AGI for various income ranges: 0.3% for AGIs $25k-50k, 0.2% for AGIs $75k-100k)
Profit/loss from business: +$6,159 (reported on 8.3% of returns)
Here:
+$6,159
State:
+$16,268
(% of AGI for various income ranges: 4.9% for AGIs below $25k, 0.7% for AGIs $25k-50k, 1.7% for AGIs $50k-75k)
Taxable individual retirement arrangement distribution: $9,832 (reported on 5.7% of returns)
15104:
$9,832
Pennsylvania:
$14,550
(% of AGI for various income ranges: 1.8% for AGIs below $25k, 1.3% for AGIs $25k-50k, 3.4% for AGIs $50k-75k, 5.4% for AGIs $75k-100k)
Total itemized deductions: $13,874 (25% of AGI, reported on 6.0% of returns)
Here:
$13,874
State:
$23,538
Here:
24.7% of AGI
State:
18.4% of AGI
(% of AGI for various income ranges: 1.5% for AGIs below $25k, 2.9% for AGIs $25k-50k, 3.3% for AGIs $50k-75k, 4.3% for AGIs $75k-100k, 7.8% for AGIs $100k-200k)
Charity contributions: $3,465 (reported on 4.4% of returns)
Here:
$3,465
State:
$4,025
(% of AGI for various income ranges: 0.2% for AGIs below $25k, 0.5% for AGIs $25k-50k, 0.7% for AGIs $50k-75k, 1.1% for AGIs $75k-100k, 1.4% for AGIs $100k-200k)
Taxes paid: $4,100 (reported on 6.0% of returns)
15104:
$4,100
State:
$9,982
(% of AGI for various income ranges: 0.3% for AGIs below $25k, 0.8% for AGIs $25k-50k, 1.1% for AGIs $50k-75k, 1.3% for AGIs $75k-100k, 2.7% for AGIs $100k-200k)
Earned income credit: $2,385 (reported on 37.9% of returns)
Here:
$2,385
State:
$2,106
(% of AGI for various income ranges: 10.5% for AGIs below $25k, 1.5% for AGIs $25k-50k)
Percentage of individuals using paid preparers for their 2012 taxes: 38.2%
Here:
38%
State:
53%
(% for various income ranges: 38.7% for AGIs below $25k, 36.0% for AGIs $25k-50k, 40.0% for AGIs $50k-75k, 38.5% for AGIs $75k-100k, 42.9% for AGIs $100k-200k)
Averages for the 2004 tax year for zip code 15104, filed in 2005:
Average Adjusted Gross Income (AGI) in 2004: $23,864 (Individual Income Tax Returns)
Here:
$23,864
State:
$48,049
Salary/wage: $22,923 (reported on 86.0% of returns)
Here:
$22,923
State:
$42,646
(% of AGI for various income ranges: 81.1% for AGIs below $10k, 79.1% for AGIs $10k-25k, 86.6% for AGIs $25k-50k, 81.0% for AGIs $50k-75k, 84.1% for AGIs $75k-100k, 79.0% for AGIs over 100k)
Taxable interest for individuals: $1,370 (reported on 24.7% of returns)
This zip code:
$1,370
Pennsylvania:
$1,657
(% of AGI for various income ranges: 2.5% for AGIs below $10k, 2.0% for AGIs $10k-25k, 0.9% for AGIs $25k-50k, 1.3% for AGIs $50k-75k, 2.1% for AGIs $75k-100k, 0.2% for AGIs over 100k)
Taxable dividends: $1,047 (reported on 10.2% of returns)
Here:
$1,047
State:
$3,566
(% of AGI for various income ranges: 1.2% for AGIs below $10k, 0.4% for AGIs $10k-25k, 0.2% for AGIs $25k-50k, 0.7% for AGIs $50k-75k, 0.7% for AGIs $75k-100k, 0.2% for AGIs over 100k)
Net capital gain/loss: +$800 (reported on 5.6% of returns)
Here:
+$800
State:
+$9,716
(% of AGI for various income ranges: -0.4% for AGIs below $10k, 0.3% for AGIs $10k-25k, 0.2% for AGIs $25k-50k, 0.3% for AGIs $50k-75k, 0.2% for AGIs $75k-100k)
Profit/loss from business: +$4,821 (reported on 6.1% of returns)
Here:
+$4,821
State:
+$14,267
(% of AGI for various income ranges: 2.0% for AGIs below $10k, 2.3% for AGIs $10k-25k, 1.0% for AGIs $25k-50k, 1.0% for AGIs $50k-75k, -0.0% for AGIs $75k-100k)
IRA payment deduction: $2,000 (reported on 1.3% of returns)
15104:
$2,000
Pennsylvania:
$2,903
Total itemized deductions: $12,625 (22% of AGI, reported on 6.8% of returns)
Here:
$12,625
State:
$18,804
Here:
22.2% of AGI
State:
19.5% of AGI
(% of AGI for various income ranges: 2.4% for AGIs $10k-25k, 3.2% for AGIs $25k-50k, 4.4% for AGIs $50k-75k, 5.7% for AGIs $75k-100k, 9.1% for AGIs over 100k)
Charity contributions deductions: $2,979 (5% of AGI, reported on 5.7% of returns)
Here:
$2,979
State:
$3,337
Here:
5.3% of AGI
State:
3.3% of AGI
(% of AGI for various income ranges: 0.4% for AGIs $10k-25k, 0.7% for AGIs $25k-50k, 1.1% for AGIs $50k-75k, 1.1% for AGIs $75k-100k, 1.3% for AGIs over 100k)
Total tax: $2,997 (reported on 59.9% of returns)
15104:
$2,997
State:
$8,008
(% of AGI for various income ranges: 1.2% for AGIs below $10k, 3.3% for AGIs $10k-25k, 6.7% for AGIs $25k-50k, 10.4% for AGIs $50k-75k, 12.7% for AGIs $75k-100k, 20.1% for AGIs over 100k)
Earned income credit: $1,862 (reported on 33.0% of returns)
Here:
$1,862
State:
$1,643
Percentage of individuals using paid preparers for their 2004 taxes: 49.9%
Here:
50%
State:
56%
(% for various income ranges: 50.1% for AGIs below $10k, 53.4% for AGIs $10k-25k, 45.7% for AGIs $25k-50k, 45.8% for AGIs $50k-75k, 45.7% for AGIs $75k-100k, 62.5% for AGIs over 100k)
Likely homosexual households (counted as self-reported same-sex unmarried-partner households)
Lesbian couples: 0.0% of all households
Gay men: 0.1% of all households
Household received Food Stamps/SNAP in the past 12 months: 1,514 Household did not receive Food Stamps/SNAP in the past 12 months: 2,291
Women who had a birth in the past 12 months: 46 (0 now married, 40 unmarried) Women who did not have a birth in the past 12 months: 1,625 (246 now married, 1,392 unmarried)
Housing units in zip code 15104 with a mortgage: 592 (13 second mortgage, 13 both second mortgage and home equity loan) Houses without a mortgage: 182
Median monthly owner costs for units with a mortgage: $826 Median monthly owner costs for units without a mortgage: $423
Residents with income below the poverty level in 2022:
This zip code:
28.4%
Whole state:
11.8%
Residents with income below 50% of the poverty level in 2022:
This zip code:
15.9%
Whole state:
6.1%
Median number of rooms in houses and condos:
Here:
6.1
State:
6.8
Median number of rooms in apartments:
Here:
4.2
State:
4.3
Notable locations in this zip code not listed on our city pages
Notable locations in zip code 15104: Ben Fairless Intermediate School Library (A), Braddock Borough Hall (B), Braddock Carnegie Library (C), Braddock Police Department (D), North Braddock Borough Hall (E), North Braddock Police Department (F), Rankin Borough Hall (G), Rankin Christian Center (H), Rankin Police Department (I), Rankin Volunteer Fire Department Station 238 (J), Rankin Station (K), North Braddock Volunteer Fire Department Company 2 Station 207 (L), North Braddock Volunteer Fire Department Company 1 Station 208 (M), Braddock Volunteer Fire Department 2 Station 113 (N). Display/hide their locations on the map
Churches in zip code 15104 include: Immanuel Lutheran Church (A), Holy Temple Church of God in Christ (B), Unity Baptist Church (C), Saint Michaels Church (D), Saint Johns Greek Catholic Church (E), Sacred Heart Catholic Church (F), Resurrection Baptist Church (G), New Testament Ministries (H), Mount Olive Baptist Church (I). Display/hide their locations on the map
157 married couples with children.
1,113 single-parent households (87 men, 1,026 women).
97.1% of residents of 15104 zip code speak English at home.
1.3% of residents speak Spanish at home (95% very well, 5% not well).
0.5% of residents speak other Indo-European language at home (89% very well, 11% not at all).
0.5% of residents speak Asian or Pacific Island language at home (57% very well, 43% well).
0.2% of residents speak other language at home (100% well).
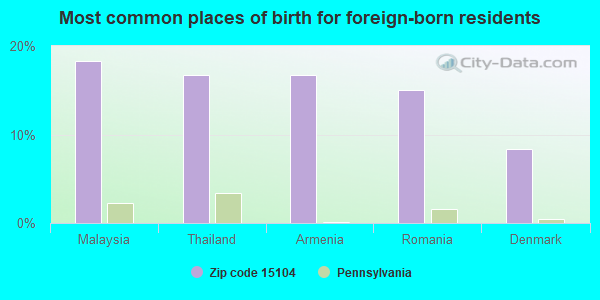
Foreign born population: 59 (0.8%) (45.8% of them are naturalized citizens)
This zip code:
0.8%
Whole state:
7.5%
18%Malaysia
17%Thailand
17%Armenia
15%Romania
8%Denmark
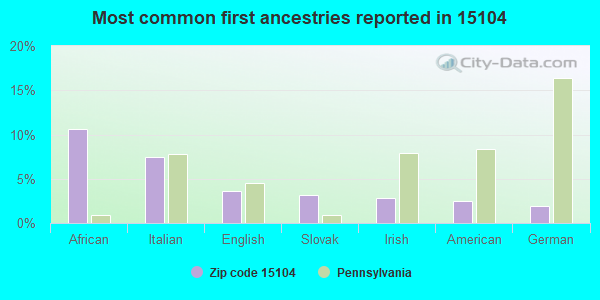
11%African
7%Italian
4%English
3%Slovak
3%Irish
2%American
2%German
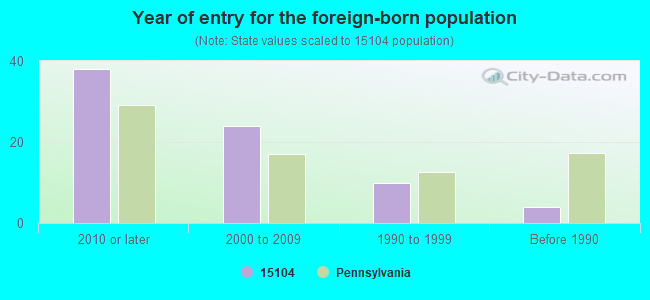
Year of entry for the foreign-born population
382010 or later
242000 to 2009
101990 to 1999
4Before 1990
Facilities with environmental interests located in this zip code:
ABARAY PRINTING (327 BRADDOCK AVE in BRADDOCK, PA)
(Resource Conservation and Recovery Act (tracking hazardous waste)) Business NAICS classification: COMMERCIAL LITHOGRAPHIC PRINTING.; OTHER COMMERCIAL PRINTING. Organizations: OPERNAME (CONTACT/OPERATOR)
, OWNERNAME (CONTACT/OWNER)
ATLANTIC SERVICE STATION #0363 2023 (500 BRADDOCK AVE in BRADDOCK, PA)
ACHA GENERAL BRADDOCK TOWERS (620 SIXTH STREET N. in BRADDOCK, PA)
AIR MINOR (AIRS/AFS) Business SIC classification: OPERATORS OF APARTMENT BUILDINGS Alternative names: ALLEGHENY COUNTY HOUSING AUTHORITY
ACHA MAPLEVIEW TERRACE (FRAZIER STREET in BRADDOCK, PA)
AIR MINOR (AIRS/AFS) Business SIC classification: OPERATORS OF APARTMENT BUILDINGS Alternative names: ALLEGHENY COUNTY HOUSING AUTHORITY
Housing units lacking complete plumbing facilities: 14.8% Housing units lacking complete kitchen facilities: 7.6%
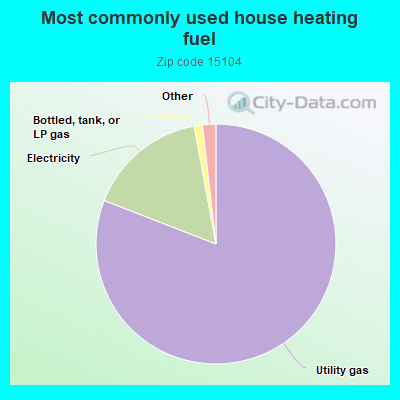
81.0%Utility gas
16.2%Electricity
1.1%Bottled, tank, or LP gas
1.0%No fuel used
0.8%Fuel oil, kerosene, etc.
Population in 1990: 13,915.
Place of birth for U.S.-born residents:
This state: 7,048
Northeast: 262
Midwest: 70
South: 341
West: 88
65% of the 15104 zip code residents lived in the same house 5 years ago. Out of people who lived in different houses, 90% lived in this county. Out of people who lived in different counties, 50% lived in Pennsylvania.
94% of the 15104 zip code residents lived in the same house 1 year ago. Out of people who lived in different houses, 82% moved from this county. Out of people who lived in different houses, 8% moved from different county within same state. Out of people who lived in different houses, 10% moved from different state.
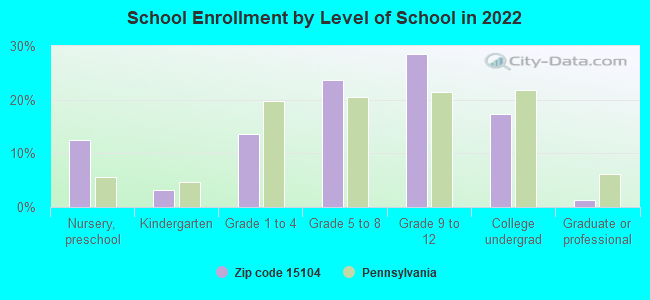
Private vs. public school enrollment:
Students in private schools in grades 1 to 8 (elementary and middle school): 10
Here:
2.0%
Pennsylvania:
15.7%
Students in private schools in grades 9 to 12 (high school):
Here:
0.0%
Pennsylvania:
13.4%
Students in private undergraduate colleges: 129
Here:
51.6%
Pennsylvania:
39.8%
Occupation by median earnings in the past 12 months ($)
74,558Installation, maintenance, and repair occupations
56,006Management occupations
52,846Computer and mathematical occupations
46,237Health technologists and technicians
45,922Material moving occupations
43,675Life, physical, and social science occupations
Companies with federal contracts located in this zip code:
FIELD ENVIRONMENTAL INSTRUMENT (99 MILLER AVE in BRADDOCK, PA; small business) : $14,690 in 2 contractsin 2005
$10,990 with Centers for Disease Control and Prevention for Laboratory Equipment and Supplies. Signed on 2005-07-28. Completion date: 2005-08-30.
$3,700 with Army for Cable, Cord, and Wire Assemblies: Communications Equipment. Taking place in WA. Signed on 2005-09-29. Completion date: 2005-10-07.
WILHELM AND KRUSE, INC. (98 ANTISBURY ST in BRADDOCK, PA; small business) : -$184,232 in 2 contractsfrom 2000 to 2004
$83,725 with U.S. Army Corps of Engineers - civil program financing only for Barges & Lighters Special Purpose. Signed on 2000-09-28. Completion date: 2001-03-28.
-$267,957 with Army for Barges & Lighters Special Purpose. Signed on 2004-12-10. Completion date: 2001-03-28.
Top industries in this zip code by the number of employees in 2005:
Health Care and Social Assistance: General Medical and Surgical Hospitals (500-999 employees: 1 establishment)
Wholesale Trade: Tobacco and Tobacco Product Merchant Wholesalers (100-249: 1)
Administrative and Support and Waste Management and Remediation Services: All Other Support Services (100-249: 1)
Other Services (except Public Administration): Religious Organizations (50-99: 1, 10-19: 1, 5-9: 2, 1-4: 8)
Health Care and Social Assistance: Outpatient Mental Health and Substance Abuse Centers (50-99: 1, 20-49: 1)
Management of Companies and Enterprises: Corporate, Subsidiary, and Regional Managing Offices (50-99: 1, 1-4: 1)
Construction: Tile and Terrazzo Contractors (50-99: 1)
Wholesale Trade: Roofing, Siding, and Insulation Material Merchant Wholesalers (50-99: 1)
People in group quarters in 2010:
107 people in correctional residential facilities
49 people in emergency and transitional shelters (with sleeping facilities) for people experiencing homelessness
18 people in group homes intended for adults
11 people in residential treatment centers for adults
3 people in other noninstitutional facilities
People in group quarters in 2000:
27 people in other noninstitutional group quarters
15 people in religious group quarters
14 people in other group homes
12 people in other nonhousehold living situations
Fatal accident statistics in 2010:
Fatal accident count: 1
Vehicles involved in fatal accidents: 1
Fatal accidents caused by drunken drivers: 0
Fatalities: 1
Persons involved in fatal accidents: 1
Pedestrians involved in fatal accidents: 0
Home Mortgage Disclosure Act Aggregated Statistics For Year 2009 (Based on 10 partial tracts)
A) FHA, FSA/RHS & VA Home Purchase Loans
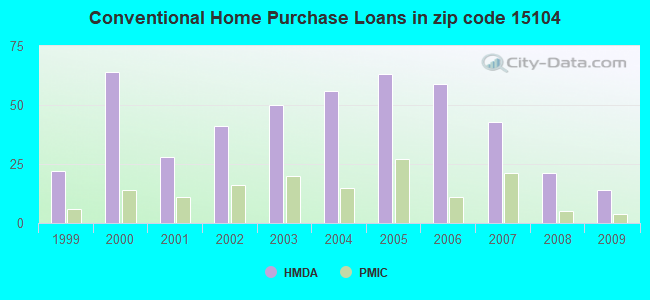
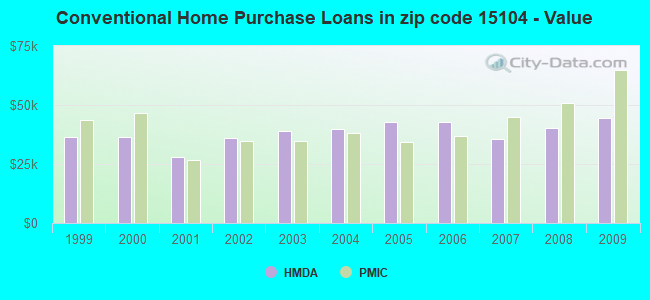
B) Conventional Home Purchase Loans
C) Refinancings
D) Home Improvement Loans
F) Non-occupant Loans on < 5 Family Dwellings (A B C & D)
G) Loans On Manufactured Home Dwelling (A B C & D)
Number
Average Value
Number
Average Value
Number
Average Value
Number
Average Value
Number
Average Value
Number
Average Value
LOANS ORIGINATED
30
$53,571
14
$44,456
22
$39,586
34
$8,484
9
$33,281
0
$0
APPLICATIONS APPROVED, NOT ACCEPTED
0
$0
0
$0
4
$54,270
2
$17,280
0
$0
0
$0
APPLICATIONS DENIED
4
$49,662
2
$54,635
52
$54,692
51
$13,370
10
$28,502
2
$1,760
APPLICATIONS WITHDRAWN
4
$44,828
2
$23,515
11
$72,984
7
$31,226
4
$32,708
0
$0
FILES CLOSED FOR INCOMPLETENESS
0
$0
0
$0
2
$26,400
0
$0
0
$0
0
$0
Aggregated Statistics For Year 2008 (Based on 10 partial tracts)
A) FHA, FSA/RHS & VA Home Purchase Loans
B) Conventional Home Purchase Loans
C) Refinancings
D) Home Improvement Loans
E) Loans on Dwellings For 5+ Families
F) Non-occupant Loans on < 5 Family Dwellings (A B C & D)
Number
Average Value
Number
Average Value
Number
Average Value
Number
Average Value
Number
Average Value
Number
Average Value
LOANS ORIGINATED
12
$51,703
21
$40,066
31
$42,611
57
$16,235
2
$71,455
20
$48,032
APPLICATIONS APPROVED, NOT ACCEPTED
7
$51,579
2
$56,985
9
$26,611
0
$0
0
$0
0
$0
APPLICATIONS DENIED
2
$43,415
4
$38,680
130
$48,348
92
$12,587
0
$0
21
$22,678
APPLICATIONS WITHDRAWN
2
$41,900
6
$28,863
21
$50,751
2
$50,280
0
$0
2
$18,620
FILES CLOSED FOR INCOMPLETENESS
0
$0
0
$0
5
$32,806
9
$34,013
0
$0
5
$58,472
Aggregated Statistics For Year 2007 (Based on 10 partial tracts)
A) FHA, FSA/RHS & VA Home Purchase Loans
B) Conventional Home Purchase Loans
C) Refinancings
D) Home Improvement Loans
F) Non-occupant Loans on < 5 Family Dwellings (A B C & D)
G) Loans On Manufactured Home Dwelling (A B C & D)
Number
Average Value
Number
Average Value
Number
Average Value
Number
Average Value
Number
Average Value
Number
Average Value
LOANS ORIGINATED
29
$47,267
43
$35,491
60
$44,534
69
$16,943
34
$33,683
0
$0
APPLICATIONS APPROVED, NOT ACCEPTED
5
$38,404
11
$35,566
18
$40,982
2
$20,170
0
$0
0
$0
APPLICATIONS DENIED
0
$0
29
$44,723
190
$51,795
147
$17,166
35
$61,009
2
$87,525
APPLICATIONS WITHDRAWN
0
$0
11
$37,625
30
$81,022
5
$51,872
5
$31,164
0
$0
FILES CLOSED FOR INCOMPLETENESS
0
$0
4
$36,952
5
$37,892
0
$0
2
$31,660
0
$0
Aggregated Statistics For Year 2006 (Based on 10 partial tracts)
A) FHA, FSA/RHS & VA Home Purchase Loans
B) Conventional Home Purchase Loans
C) Refinancings
D) Home Improvement Loans
F) Non-occupant Loans on < 5 Family Dwellings (A B C & D)
G) Loans On Manufactured Home Dwelling (A B C & D)
Number
Average Value
Number
Average Value
Number
Average Value
Number
Average Value
Number
Average Value
Number
Average Value
LOANS ORIGINATED
27
$45,971
59
$42,812
107
$44,631
95
$15,222
61
$43,314
0
$0
APPLICATIONS APPROVED, NOT ACCEPTED
0
$0
17
$33,147
32
$44,927
18
$18,834
9
$43,162
2
$18,620
APPLICATIONS DENIED
2
$66,935
34
$50,952
224
$52,411
199
$19,080
69
$28,477
0
$0
APPLICATIONS WITHDRAWN
4
$58,800
23
$50,134
74
$53,137
9
$30,563
20
$37,568
0
$0
FILES CLOSED FOR INCOMPLETENESS
0
$0
4
$20,398
14
$48,151
0
$0
2
$17,280
0
$0
Aggregated Statistics For Year 2005 (Based on 10 partial tracts)
A) FHA, FSA/RHS & VA Home Purchase Loans
B) Conventional Home Purchase Loans
C) Refinancings
D) Home Improvement Loans
E) Loans on Dwellings For 5+ Families
F) Non-occupant Loans on < 5 Family Dwellings (A B C & D)
G) Loans On Manufactured Home Dwelling (A B C & D)
Number
Average Value
Number
Average Value
Number
Average Value
Number
Average Value
Number
Average Value
Number
Average Value
Number
Average Value
LOANS ORIGINATED
19
$49,505
63
$42,850
101
$41,845
78
$12,772
3
$86,440
62
$30,449
0
$0
APPLICATIONS APPROVED, NOT ACCEPTED
0
$0
9
$40,772
37
$37,026
16
$29,282
0
$0
12
$40,954
2
$13,965
APPLICATIONS DENIED
4
$37,085
37
$51,853
288
$49,813
271
$11,939
2
$64,800
141
$17,838
2
$5,185
APPLICATIONS WITHDRAWN
2
$43,120
14
$50,241
107
$56,593
25
$84,536
0
$0
12
$41,704
0
$0
FILES CLOSED FOR INCOMPLETENESS
2
$17,185
4
$46,130
11
$74,551
2
$17,600
0
$0
4
$65,122
0
$0
Aggregated Statistics For Year 2004 (Based on 10 partial tracts)
A) FHA, FSA/RHS & VA Home Purchase Loans
B) Conventional Home Purchase Loans
C) Refinancings
D) Home Improvement Loans
F) Non-occupant Loans on < 5 Family Dwellings (A B C & D)
G) Loans On Manufactured Home Dwelling (A B C & D)
Number
Average Value
Number
Average Value
Number
Average Value
Number
Average Value
Number
Average Value
Number
Average Value
LOANS ORIGINATED
20
$54,658
56
$39,922
151
$41,139
112
$9,964
75
$23,566
0
$0
APPLICATIONS APPROVED, NOT ACCEPTED
0
$0
5
$50,906
62
$44,015
30
$11,207
14
$22,079
0
$0
APPLICATIONS DENIED
4
$59,915
20
$37,412
320
$49,546
281
$8,581
152
$12,027
4
$31,150
APPLICATIONS WITHDRAWN
4
$44,168
16
$75,928
80
$58,097
16
$32,184
10
$37,083
0
$0
FILES CLOSED FOR INCOMPLETENESS
0
$0
2
$38,895
27
$54,696
0
$0
2
$23,515
0
$0
Aggregated Statistics For Year 2003 (Based on 10 partial tracts)
A) FHA, FSA/RHS & VA Home Purchase Loans
B) Conventional Home Purchase Loans
C) Refinancings
D) Home Improvement Loans
E) Loans on Dwellings For 5+ Families
F) Non-occupant Loans on < 5 Family Dwellings (A B C & D)
Number
Average Value
Number
Average Value
Number
Average Value
Number
Average Value
Number
Average Value
Number
Average Value
LOANS ORIGINATED
22
$41,388
50
$38,925
173
$38,350
78
$12,491
2
$78,210
77
$26,906
APPLICATIONS APPROVED, NOT ACCEPTED
6
$33,830
20
$39,116
110
$44,102
18
$20,381
0
$0
18
$37,747
APPLICATIONS DENIED
4
$31,935
20
$44,346
339
$46,786
176
$7,312
0
$0
107
$16,443
APPLICATIONS WITHDRAWN
2
$35,200
5
$36,896
101
$46,698
12
$11,029
0
$0
9
$27,457
FILES CLOSED FOR INCOMPLETENESS
0
$0
2
$16,280
10
$31,432
0
$0
2
$26,895
9
$24,667
Aggregated Statistics For Year 2002 (Based on 10 partial tracts)
A) FHA, FSA/RHS & VA Home Purchase Loans
B) Conventional Home Purchase Loans
C) Refinancings
D) Home Improvement Loans
F) Non-occupant Loans on < 5 Family Dwellings (A B C & D)
Number
Average Value
Number
Average Value
Number
Average Value
Number
Average Value
Number
Average Value
LOANS ORIGINATED
33
$34,474
41
$35,819
169
$37,507
55
$11,400
52
$28,174
APPLICATIONS APPROVED, NOT ACCEPTED
2
$49,250
11
$27,472
111
$43,434
12
$32,725
16
$32,108
APPLICATIONS DENIED
2
$43,200
26
$29,682
310
$43,793
93
$18,132
35
$36,662
APPLICATIONS WITHDRAWN
0
$0
7
$55,043
135
$48,603
16
$10,398
9
$37,684
FILES CLOSED FOR INCOMPLETENESS
2
$56,320
7
$46,754
46
$45,337
4
$36,578
5
$29,490
Aggregated Statistics For Year 2001 (Based on 10 partial tracts)
A) FHA, FSA/RHS & VA Home Purchase Loans
B) Conventional Home Purchase Loans
C) Refinancings
D) Home Improvement Loans
E) Loans on Dwellings For 5+ Families
F) Non-occupant Loans on < 5 Family Dwellings (A B C & D)
Number
Average Value
Number
Average Value
Number
Average Value
Number
Average Value
Number
Average Value
Number
Average Value
LOANS ORIGINATED
32
$46,624
28
$27,820
181
$36,971
88
$12,013
0
$0
25
$26,140
APPLICATIONS APPROVED, NOT ACCEPTED
2
$15,970
16
$28,573
156
$40,866
14
$10,019
0
$0
14
$34,943
APPLICATIONS DENIED
3
$27,340
37
$32,791
400
$38,851
169
$13,518
0
$0
39
$28,013
APPLICATIONS WITHDRAWN
2
$47,940
9
$32,158
129
$40,309
37
$12,899
2
$42,240
9
$12,494
FILES CLOSED FOR INCOMPLETENESS
0
$0
4
$18,990
32
$44,418
0
$0
0
$0
5
$31,494
Aggregated Statistics For Year 2000 (Based on 10 partial tracts)
A) FHA, FSA/RHS & VA Home Purchase Loans
B) Conventional Home Purchase Loans
C) Refinancings
D) Home Improvement Loans
F) Non-occupant Loans on < 5 Family Dwellings (A B C & D)
Number
Average Value
Number
Average Value
Number
Average Value
Number
Average Value
Number
Average Value
LOANS ORIGINATED
50
$34,125
64
$36,311
184
$37,823
92
$12,921
58
$36,806
APPLICATIONS APPROVED, NOT ACCEPTED
0
$0
18
$39,193
76
$40,818
39
$19,111
7
$47,269
APPLICATIONS DENIED
2
$26,070
85
$35,331
288
$35,465
156
$16,458
34
$30,941
APPLICATIONS WITHDRAWN
0
$0
28
$41,315
133
$43,978
25
$18,622
11
$35,657
FILES CLOSED FOR INCOMPLETENESS
0
$0
3
$32,440
23
$36,983
2
$47,485
5
$27,922
Aggregated Statistics For Year 1999 (Based on 5 partial tracts)
A) FHA, FSA/RHS & VA Home Purchase Loans
B) Conventional Home Purchase Loans
C) Refinancings
D) Home Improvement Loans
E) Loans on Dwellings For 5+ Families
F) Non-occupant Loans on < 5 Family Dwellings (A B C & D)
2004 - 2018 National Fire Incident Reporting System (NFIRS) incidents
Based on the data from the years 2004 - 2018 the average number of fires per year is 53. The highest number of fires - 154 took place in 2016, and the least - 0 in 2008. The data has a rising trend.
When looking into fire subcategories, the most incidents belonged to: Structure Fires (74.4%), and Outside Fires (11.5%).
Fire incident types reported to NFIRS in Zip Code 15104


 Nearest zip codes: 15112, 15221, 15110, 15218, 15145, 15120.


 Based on the data from the years 2004 - 2018 the average number of fires per year is 53. The highest number of fires - 154 took place in 2016, and the least - 0 in 2008. The data has a rising trend.
 When looking into fire subcategories, the most incidents belonged to: Structure Fires (74.4%), and Outside Fires (11.5%).