Estimated zip code population in 2022: 31,377 Zip code population in 2010: 29,724 Zip code population in 2000: 30,630
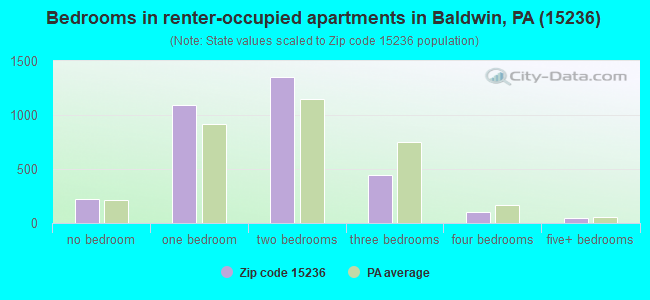
Houses and condos: 14,596 Renter-occupied apartments: 3,225
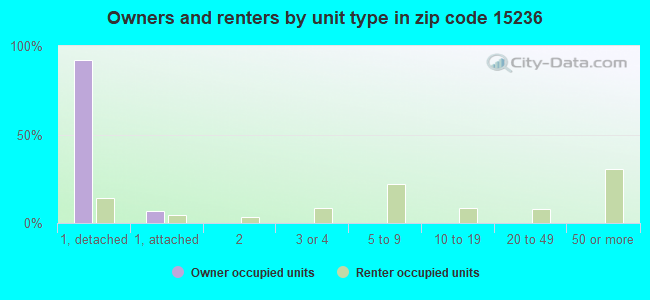
% of renters here:
23%
State:
31%
March 2022 cost of living index in zip code 15236: 93.9 (less than average, U.S. average is 100)
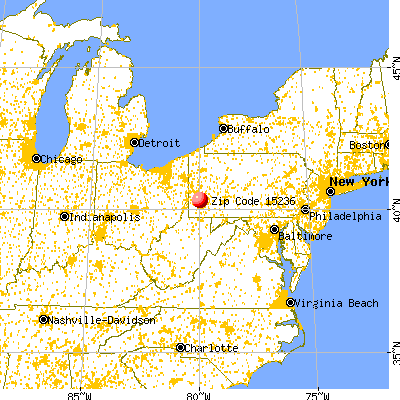
Land area: 11.1 sq. mi. Water area: 0.0 sq. mi.
Population density: 2,827 people per square mile
(average).
OSM Map
General Map
Google Map
MSN Map
OSM Map
General Map
Google Map
MSN Map
OSM Map
General Map
Google Map
MSN Map
OSM Map
General Map
Google Map
MSN Map
Please wait while loading the map...
Real estate property taxes paid for housing units in 2022:
This zip code:
1.6% ($3,636)
Pennsylvania:
1.3% ($3,094)
Median real estate property taxes paid for housing units with mortgages in 2022: $3,647 (1.6%) Median real estate property taxes paid for housing units with no mortgage in 2022: $3,623 (1.6%)
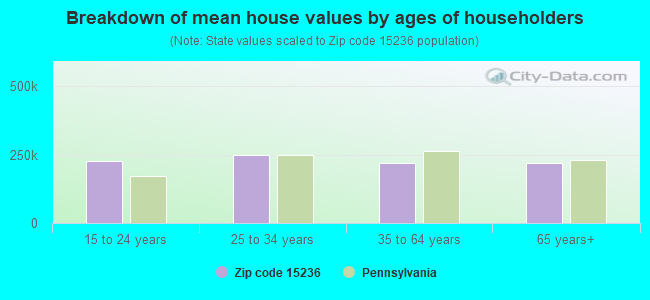
Estimated median house/condo value in 2022: $222,274
15236:
$222,274
Pennsylvania:
$245,500
According to our research of Pennsylvania and other state lists, there were 16 registered sex offenders living in 15236 zip code as of April 27, 2024. The ratio of all residents to sex offenders in zip code 15236 is 1,870 to 1. The ratio of registered sex offenders to all residents in this zip code is much lower than the state average.
Median resident age:
This zip code:
44.3 years
Pennsylvania median age:
40.9 years
Average household size:
This zip code:
2.3 people
Pennsylvania:
2.4 people
Averages for the 2020 tax year for zip code 15236, filed in 2021:
Average Adjusted Gross Income (AGI) in 2020: $69,129 (Individual Income Tax Returns)
Here:
$69,129
State:
$75,707
Salary/wage: $61,461 (reported on 78.0% of returns)
Here:
$61,461
State:
$62,806
(% of AGI for various income ranges: 1244.4% for AGIs below $25k, 3433.2% for AGIs $25k-50k, 5968.2% for AGIs $50k-75k, 8770.5% for AGIs $75k-100k, 16182.1% for AGIs $100k-200k, 60090.0% for AGIs over 200k)
Taxable interest for individuals: $1,208 (reported on 37.2% of returns)
This zip code:
$1,208
Pennsylvania:
$1,633
(% of AGI for various income ranges: 25.9% for AGIs below $25k, 30.6% for AGIs $25k-50k, 53.6% for AGIs $50k-75k, 69.7% for AGIs $75k-100k, 121.0% for AGIs $100k-200k, 820.6% for AGIs over 200k)
Ordinary dividends: $3,997 (reported on 26.0% of returns)
Here:
$3,997
State:
$7,382
(% of AGI for various income ranges: 42.1% for AGIs below $25k, 61.2% for AGIs $25k-50k, 115.0% for AGIs $50k-75k, 161.9% for AGIs $75k-100k, 296.6% for AGIs $100k-200k, 2281.2% for AGIs over 200k)
Net capital gain/loss in AGI: +$9,955 (reported on 21.4% of returns)
Here:
+$9,955
State:
+$23,522
(% of AGI for various income ranges: 20.0% for AGIs below $25k, 33.1% for AGIs $25k-50k, 97.3% for AGIs $50k-75k, 169.6% for AGIs $75k-100k, 457.8% for AGIs $100k-200k, 12177.1% for AGIs over 200k)
Profit/loss from business: +$13,265 (reported on 10.8% of returns)
Here:
+$13,265
State:
+$16,274
(% of AGI for various income ranges: 56.2% for AGIs below $25k, 107.6% for AGIs $25k-50k, 170.1% for AGIs $50k-75k, 214.0% for AGIs $75k-100k, 422.4% for AGIs $100k-200k, 2580.0% for AGIs over 200k)
Taxable individual retirement arrangement distribution: $17,370 (reported on 14.4% of returns)
15236:
$17,370
Pennsylvania:
$18,583
(% of AGI for various income ranges: 134.0% for AGIs below $25k, 192.9% for AGIs $25k-50k, 279.9% for AGIs $50k-75k, 478.6% for AGIs $75k-100k, 673.7% for AGIs $100k-200k, 3810.6% for AGIs over 200k)
Self-employed (Keogh) retirement plans: $19,950 (reported on 0.4% of returns)
15236:
$19,950
Pennsylvania:
$25,407
(% of AGI for various income ranges: 22.6% for AGIs $100k-200k, 441.2% for AGIs over 200k)
Total itemized deductions: $28,674 (reported on 4.7% of returns)
Here:
$28,674
State:
$34,850
(% of AGI for various income ranges: 40.1% for AGIs below $25k, 65.2% for AGIs $25k-50k, 154.8% for AGIs $50k-75k, 243.1% for AGIs $75k-100k, 321.7% for AGIs $100k-200k, 3758.2% for AGIs over 200k)
Charity contributions: $8,776 (reported on 3.5% of returns)
Here:
$8,776
State:
$12,392
(% of AGI for various income ranges: 2.5% for AGIs below $25k, 10.2% for AGIs $25k-50k, 22.7% for AGIs $50k-75k, 39.5% for AGIs $75k-100k, 97.4% for AGIs $100k-200k, 1101.8% for AGIs over 200k)
Taxes paid: $7,276 (reported on 4.7% of returns)
15236:
$7,276
State:
$8,200
(% of AGI for various income ranges: 5.4% for AGIs below $25k, 14.3% for AGIs $25k-50k, 42.1% for AGIs $50k-75k, 90.2% for AGIs $75k-100k, 104.1% for AGIs $100k-200k, 551.8% for AGIs over 200k)
Earned income credit: $2,013 (reported on 8.2% of returns)
Here:
$2,013
State:
$2,100
(% of AGI for various income ranges: 48.7% for AGIs below $25k, 41.7% for AGIs $25k-50k, 0.8% for AGIs $50k-75k)
Percentage of individuals using paid preparers for their 2020 taxes: 90.4%
Here:
90%
State:
92%
(% for various income ranges: 88.5% for AGIs below $25k, 91.4% for AGIs $25k-50k, 91.4% for AGIs $50k-75k, 91.4% for AGIs $75k-100k, 90.7% for AGIs $100k-200k, 90.6% for AGIs over 200k)
Averages for the 2012 tax year for zip code 15236, filed in 2013:
Average Adjusted Gross Income (AGI) in 2012: $56,209 (Individual Income Tax Returns)
Here:
$56,209
State:
$61,346
Salary/wage: $51,800 (reported on 79.3% of returns)
Here:
$51,800
State:
$51,902
(% of AGI for various income ranges: 63.1% for AGIs below $25k, 71.9% for AGIs $25k-50k, 72.4% for AGIs $50k-75k, 75.4% for AGIs $75k-100k, 79.1% for AGIs $100k-200k, 60.9% for AGIs over 200k)
Taxable interest for individuals: $1,004 (reported on 43.3% of returns)
This zip code:
$1,004
Pennsylvania:
$1,588
(% of AGI for various income ranges: 2.2% for AGIs below $25k, 0.9% for AGIs $25k-50k, 0.7% for AGIs $50k-75k, 0.6% for AGIs $75k-100k, 0.6% for AGIs $100k-200k, 0.6% for AGIs over 200k)
Ordinary dividends: $3,432 (reported on 29.7% of returns)
Here:
$3,432
State:
$5,827
(% of AGI for various income ranges: 3.2% for AGIs below $25k, 1.7% for AGIs $25k-50k, 1.6% for AGIs $50k-75k, 1.3% for AGIs $75k-100k, 1.3% for AGIs $100k-200k, 3.6% for AGIs over 200k)
Net capital gain/loss in AGI: +$2,769 (reported on 19.3% of returns)
Here:
+$2,769
State:
+$14,495
(% of AGI for various income ranges: 0.2% for AGIs $25k-50k, 0.4% for AGIs $50k-75k, 0.7% for AGIs $75k-100k, 0.8% for AGIs $100k-200k, 4.5% for AGIs over 200k)
Profit/loss from business: +$13,014 (reported on 9.9% of returns)
Here:
+$13,014
State:
+$16,268
(% of AGI for various income ranges: 4.3% for AGIs below $25k, 2.1% for AGIs $25k-50k, 1.7% for AGIs $50k-75k, 1.7% for AGIs $75k-100k, 2.1% for AGIs $100k-200k, 3.8% for AGIs over 200k)
Taxable individual retirement arrangement distribution: $14,477 (reported on 16.8% of returns)
15236:
$14,477
Pennsylvania:
$14,550
(% of AGI for various income ranges: 7.2% for AGIs below $25k, 4.9% for AGIs $25k-50k, 4.2% for AGIs $50k-75k, 3.8% for AGIs $75k-100k, 3.2% for AGIs $100k-200k, 5.9% for AGIs over 200k)
Self-employment retirement plans: $14,386 (reported on 0.4% of returns)
15236:
$14,386
Pennsylvania:
$20,922
Total itemized deductions: $17,421 (18% of AGI, reported on 34.2% of returns)
Here:
$17,421
State:
$23,538
Here:
18.3% of AGI
State:
18.4% of AGI
(% of AGI for various income ranges: 8.7% for AGIs below $25k, 9.0% for AGIs $25k-50k, 9.7% for AGIs $50k-75k, 10.9% for AGIs $75k-100k, 11.8% for AGIs $100k-200k, 11.4% for AGIs over 200k)
Charity contributions: $2,514 (reported on 28.6% of returns)
Here:
$2,514
State:
$4,025
(% of AGI for various income ranges: 0.7% for AGIs below $25k, 0.9% for AGIs $25k-50k, 1.0% for AGIs $50k-75k, 1.2% for AGIs $75k-100k, 1.6% for AGIs $100k-200k, 1.7% for AGIs over 200k)
Taxes paid: $7,865 (reported on 34.0% of returns)
15236:
$7,865
State:
$9,982
(% of AGI for various income ranges: 2.3% for AGIs below $25k, 3.1% for AGIs $25k-50k, 4.1% for AGIs $50k-75k, 4.9% for AGIs $75k-100k, 6.0% for AGIs $100k-200k, 5.9% for AGIs over 200k)
Earned income credit: $1,856 (reported on 8.6% of returns)
Here:
$1,856
State:
$2,106
(% of AGI for various income ranges: 3.0% for AGIs below $25k, 0.6% for AGIs $25k-50k)
Percentage of individuals using paid preparers for their 2012 taxes: 45.6%
Here:
46%
State:
53%
(% for various income ranges: 41.3% for AGIs below $25k, 45.1% for AGIs $25k-50k, 47.7% for AGIs $50k-75k, 47.1% for AGIs $75k-100k, 50.7% for AGIs $100k-200k, 66.7% for AGIs over 200k)
Averages for the 2004 tax year for zip code 15236, filed in 2005:
Average Adjusted Gross Income (AGI) in 2004: $46,280 (Individual Income Tax Returns)
Here:
$46,280
State:
$48,049
Salary/wage: $43,807 (reported on 77.8% of returns)
Here:
$43,807
State:
$42,646
(% of AGI for various income ranges: 97.0% for AGIs below $10k, 58.1% for AGIs $10k-25k, 71.3% for AGIs $25k-50k, 76.7% for AGIs $50k-75k, 80.4% for AGIs $75k-100k, 71.3% for AGIs over 100k)
Taxable interest for individuals: $1,827 (reported on 61.1% of returns)
This zip code:
$1,827
Pennsylvania:
$1,657
(% of AGI for various income ranges: 12.3% for AGIs below $10k, 5.4% for AGIs $10k-25k, 2.7% for AGIs $25k-50k, 1.9% for AGIs $50k-75k, 1.6% for AGIs $75k-100k, 1.9% for AGIs over 100k)
Taxable dividends: $2,632 (reported on 38.0% of returns)
Here:
$2,632
State:
$3,566
(% of AGI for various income ranges: 9.1% for AGIs below $10k, 3.2% for AGIs $10k-25k, 2.2% for AGIs $25k-50k, 1.4% for AGIs $50k-75k, 1.5% for AGIs $75k-100k, 2.6% for AGIs over 100k)
Net capital gain/loss: +$3,748 (reported on 26.9% of returns)
Here:
+$3,748
State:
+$9,716
(% of AGI for various income ranges: -2.9% for AGIs below $10k, 0.3% for AGIs $10k-25k, 0.4% for AGIs $25k-50k, 0.6% for AGIs $50k-75k, 1.1% for AGIs $75k-100k, 5.9% for AGIs over 100k)
Profit/loss from business: +$10,626 (reported on 10.5% of returns)
Here:
+$10,626
State:
+$14,267
(% of AGI for various income ranges: 0.5% for AGIs below $10k, 4.2% for AGIs $10k-25k, 2.2% for AGIs $25k-50k, 1.9% for AGIs $50k-75k, 1.7% for AGIs $75k-100k, 3.1% for AGIs over 100k)
IRA payment deduction: $2,950 (reported on 3.5% of returns)
15236:
$2,950
Pennsylvania:
$2,903
(% of AGI for various income ranges: 0.3% for AGIs below $10k, 0.4% for AGIs $10k-25k, 0.4% for AGIs $25k-50k, 0.2% for AGIs $50k-75k, 0.2% for AGIs $75k-100k, 0.1% for AGIs over 100k)
Self-employed pension: $8,485 (reported on 0.7% of returns)
Here:
$8,485
Pennsylvania:
$14,674
(% of AGI for various income ranges: 0.1% for AGIs $25k-50k, 0.1% for AGIs $50k-75k, 0.1% for AGIs $75k-100k, 0.3% for AGIs over 100k)
Total itemized deductions: $15,472 (20% of AGI, reported on 38.0% of returns)
Here:
$15,472
State:
$18,804
Here:
19.9% of AGI
State:
19.5% of AGI
(% of AGI for various income ranges: 15.0% for AGIs below $10k, 10.2% for AGIs $10k-25k, 12.2% for AGIs $25k-50k, 13.2% for AGIs $50k-75k, 13.8% for AGIs $75k-100k, 12.4% for AGIs over 100k)
Charity contributions deductions: $2,319 (3% of AGI, reported on 35.1% of returns)
Here:
$2,319
State:
$3,337
Here:
2.9% of AGI
State:
3.3% of AGI
(% of AGI for various income ranges: 0.8% for AGIs below $10k, 1.0% for AGIs $10k-25k, 1.3% for AGIs $25k-50k, 1.6% for AGIs $50k-75k, 1.8% for AGIs $75k-100k, 2.4% for AGIs over 100k)
Total tax: $6,435 (reported on 78.8% of returns)
15236:
$6,435
State:
$8,008
(% of AGI for various income ranges: 2.2% for AGIs below $10k, 4.3% for AGIs $10k-25k, 7.2% for AGIs $25k-50k, 8.9% for AGIs $50k-75k, 10.6% for AGIs $75k-100k, 17.3% for AGIs over 100k)
Earned income credit: $1,424 (reported on 7.0% of returns)
Here:
$1,424
State:
$1,643
Percentage of individuals using paid preparers for their 2004 taxes: 48.5%
Here:
49%
State:
56%
(% for various income ranges: 44.1% for AGIs below $10k, 50.5% for AGIs $10k-25k, 48.7% for AGIs $25k-50k, 48.4% for AGIs $50k-75k, 46.9% for AGIs $75k-100k, 55.3% for AGIs over 100k)
Likely homosexual households (counted as self-reported same-sex unmarried-partner households)
Lesbian couples: 0.2% of all households
Gay men: 0.0% of all households
Household received Food Stamps/SNAP in the past 12 months: 1,298 Household did not receive Food Stamps/SNAP in the past 12 months: 12,538
Women who had a birth in the past 12 months: 321 (315 now married, 22 unmarried) Women who did not have a birth in the past 12 months: 5,999 (2,891 now married, 3,090 unmarried)
Housing units in zip code 15236 with a mortgage: 6,536 (788 second mortgage, 715 both second mortgage and home equity loan) Houses without a mortgage: 662
Median monthly owner costs for units with a mortgage: $1,483 Median monthly owner costs for units without a mortgage: $648
Residents with income below the poverty level in 2022:
This zip code:
7.4%
Whole state:
11.8%
Residents with income below 50% of the poverty level in 2022:
This zip code:
3.7%
Whole state:
6.1%
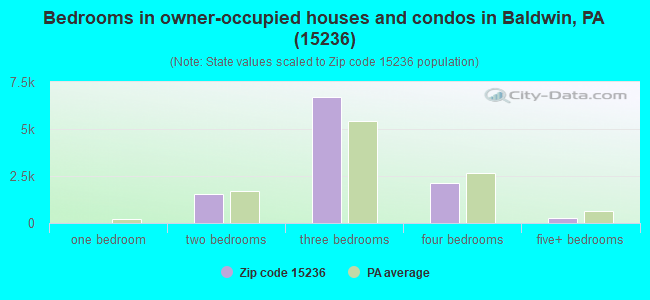
Median number of rooms in houses and condos:
Here:
6.6
State:
6.8
Median number of rooms in apartments:
Here:
4.0
State:
4.3
Notable locations in this zip code not listed on our city pages
Notable locations in zip code 15236: South Park Golf Course (A), South Hills Country Club (B), ABC Creative Play Center (C), Lutheran Service Society of Western Pennsylvania (D), Pleasant Hills Borough Hall (E), Pleasant Hills Public Library (F), Saint Joseph Convent (G), Wesley Spectrum Highland School Library (H), Whitehall Borough Hall (I), Whitehall Police Department (J), Whitehall Public Library (K), Pleasant Hills Fire Company Station 232 (L), Broughton Volunteer Fire Department Station 270 (M), South Baldwin Volunteer Fire Company (N), Option Independent Fire Company (O). Display/hide their locations on the map
Churches in zip code 15236 include: Tried Stone Baptist Church (A), Sunrise Baptist Church (B), North Zion Lutheran Church (C), Nativity Church of South Park (D), Hamilton Presbyterian Church (E), Baldwin United Presbyterian Church (F), Mount Providence Church (G), Zion Church (H), Bethany Church (I). Display/hide their locations on the map
In group quarters: 142 (-1 institutionalized population)
Size of family households: 4,700 2-persons, 2,044 3-persons, 1,227 4-persons, 631 5-persons, 150 6-persons, 74 7-or-more-persons
Size of nonfamily households: 4,228 1-person, 800 2-persons, 34 3-persons
3,933 married couples with children.
1,168 single-parent households (602 men, 566 women).
87.6% of residents of 15236 zip code speak English at home.
0.9% of residents speak Spanish at home (91% very well, 3% well, 6% not well).
9.7% of residents speak other Indo-European language at home (34% very well, 36% well, 17% not well, 13% not at all).
1.0% of residents speak Asian or Pacific Island language at home (22% very well, 50% well, 28% not well).
0.9% of residents speak other language at home (50% very well, 20% well, 30% not well).
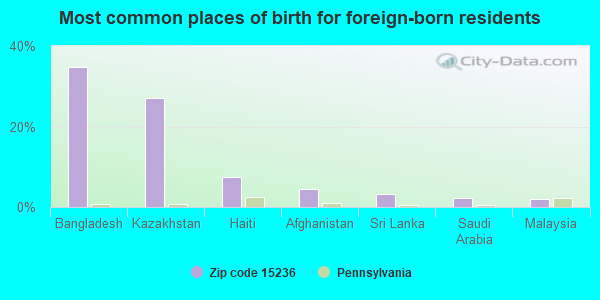
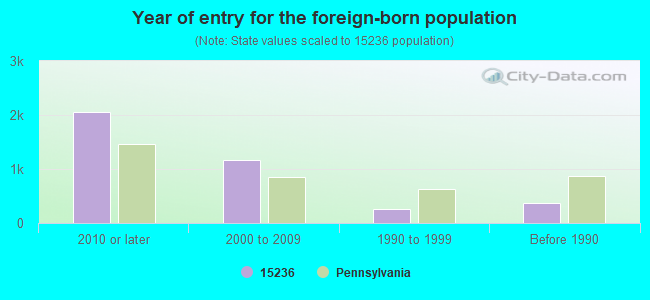
Foreign born population: 3,681 (11.7%) (64.7% of them are naturalized citizens)
Major facilities with environmental interests located in this zip code:
BLOOM ENG (5460 HORNING ROAD in PITTSBURGH, PA)
AIR MINOR (AIRS/AFS) STATE MASTER (Pennsylvania database) - RCRIS-PAD004328258, HAZARDOUS WASTE PROGRAM Small Quantity Generators, between 100 kg and 1000 kg of hazardous waste/month (Resource Conservation and Recovery Act (tracking hazardous waste)) - notification TRI REPORTER (Tracking of toxic chemicals releasing facilities) Business SIC classification: NONCLAY REFRACTORIES; FABRICATED METAL PRODUCTS Organizations: OPERNAME (CONTACT/OPERATOR)
, BLOOM ENGINEERING INC (CONTACT/OWNER)
Alternative names: BLOOM ENGINEERING CO INC
ALL STAR CADILLAC (4500 SAW MILL RUN BOULEVARD in PITTSBURGH, PA)
AIR MINOR (AIRS/AFS) STATE MASTER (Pennsylvania database) - RCRIS-PAD981732142, HAZARDOUS WASTE PROGRAM Small Quantity Generators, between 100 kg and 1000 kg of hazardous waste/month (Resource Conservation and Recovery Act (tracking hazardous waste)) - notification Business SIC classification: MOTOR VEHICLE DEALERS (NEW AND USED) Organizations: OPERNAME (CONTACT/OPERATOR)
, ALL STAR CADILLAC INC (CONTACT/OWNER)
Alternative names: BOYLE AND LANE CADILLAC
ALFERY & ASSOC (621-27 REGIS AVE in PLEASANT HILLS, PA)
STATE MASTER (Pennsylvania database) - RCRIS-PAD987276755, HAZARDOUS WASTE PROGRAM (Resource Conservation and Recovery Act (tracking hazardous waste)) Organizations: OPERNAME (CONTACT/OPERATOR)
, ALFERY & ASSOCIATES (CONTACT/OWNER)
ART JONES BUICK (8 CLAIRTON BLVD in PITTSBURGH, PA)
STATE MASTER (Pennsylvania database) - RCRIS-PAD052199437, HAZARDOUS WASTE PROGRAM Small Quantity Generators, between 100 kg and 1000 kg of hazardous waste/month (Resource Conservation and Recovery Act (tracking hazardous waste)) - notification Organizations: OPERNAME (CONTACT/OPERATOR)
, JONES, ARTHUR (CONTACT/OWNER)
Alternative names: JONES ART BUICK
BAIANO CONST (4842 STREETS RUN RD in PITTSBURGH, PA)
STATE MASTER (Pennsylvania database) - RCRIS-PAR000008375, HAZARDOUS WASTE PROGRAM Conditionally Exempt Small Quantity Generators, less than 100 kg/month of hazardous waste (Resource Conservation and Recovery Act (tracking hazardous waste)) - notification Organizations: BAIANO VECCHIO PROPERTIES (CONTACT/OWNER)
BALDWIN ORNAMENTAL IRON CO INC (5331 MC ANULTY RD in PITTSBURGH, PA)
(Resource Conservation and Recovery Act (tracking hazardous waste)) Business NAICS classification: ORNAMENTAL AND ARCHITECTURAL METAL WORK MANUFACTURING. Organizations: OPERNAME (CONTACT/OPERATOR)
, OWNERNAME (CONTACT/OWNER)
, MILANI STEVE (CONTACT/OWNER)
Alternative names: CENTERLINE COLLISION
BALDWIN SENIOR HIGH SCHOOL (4653 CLAIRTON BLVD in PITTSBURGH, PA)
(National Center for Education Statistics) - STATE ID-0050 Organizations: BALDWIN-WHITEHALL SD (SCHOOL DISTRICT)
AAMCO (290 CURRY HOLLOW RD in PITTSBURGH, PA)
Small Quantity Generators, between 100 kg and 1000 kg of hazardous waste/month (Resource Conservation and Recovery Act (tracking hazardous waste)) - notification Organizations: OPERNAME (CONTACT/OPERATOR)
, LAMB, ROBERT (CONTACT/OWNER)
ATLANTIC SERVICE STATION (CURRY HOLLOW & KEEPORT in PITTSBURGH, PA)
Conditionally Exempt Small Quantity Generators, less than 100 kg/month of hazardous waste (Resource Conservation and Recovery Act (tracking hazardous waste)) - notification Organizations: OPERNAME (CONTACT/OPERATOR)
, ATLANTIC REFINING & MARKETINF (CONTACT/OWNER)
BALDWIN-WHITEHALL SD WHITEHALL ELEMENTAR (4900 CURRY ROAD in PITTSBURGH, PA)
AIR MINOR (AIRS/AFS) Business SIC classification: ELEMENTARY AND SECONDARY SCHOOLS Alternative names: BALDWIN-WHITEHALL SCHOOL DISTRICT, WHITEHALL EL SCH
BENSON LINCOLN MERCURY (4800 CLAIRTON BLVD in PITTSBURGH, PA)
Small Quantity Generators, between 100 kg and 1000 kg of hazardous waste/month (Resource Conservation and Recovery Act (tracking hazardous waste)) - notification Organizations: OPERNAME (CONTACT/OPERATOR)
, BENSON, GEORGE (CONTACT/OWNER)
BILLS TEXACO (700 OLD CLAIRTON RD in PITTSBURGH, PA)
Conditionally Exempt Small Quantity Generators, less than 100 kg/month of hazardous waste (Resource Conservation and Recovery Act (tracking hazardous waste)) - notification Organizations: CARSON WILLIAM L (CONTACT/OWNER)
, KEHM GEORGE (CONTACT/OWNER)
APC ARDMORE (540 DELWAR RD BLDG 3 in PITTSBURGH, PA)
Conditionally Exempt Small Quantity Generators, less than 100 kg/month of hazardous waste (Resource Conservation and Recovery Act (tracking hazardous waste)) - notification Organizations: BECKER DEV (CONTACT/OWNER)
Housing units lacking complete plumbing facilities: 1.1% Housing units lacking complete kitchen facilities: 4.1%
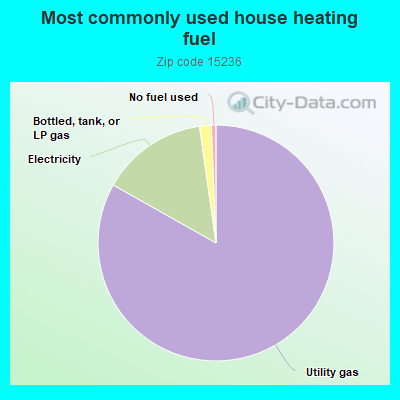
82.6%Utility gas
14.5%Electricity
1.6%Bottled, tank, or LP gas
0.6%No fuel used
Population in 1990: 36,047.
Place of birth for U.S.-born residents:
This state: 24,349
Northeast: 979
Midwest: 777
South: 937
West: 558
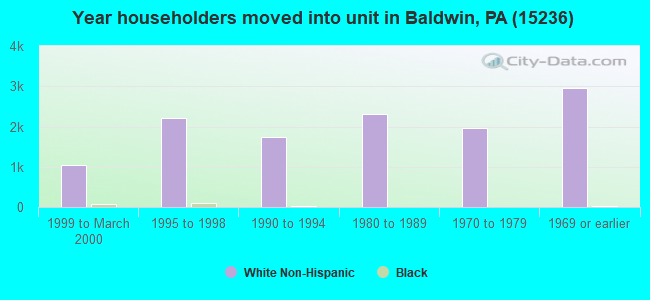
74% of the 15236 zip code residents lived in the same house 5 years ago. Out of people who lived in different houses, 83% lived in this county. Out of people who lived in different counties, 50% lived in Pennsylvania.
94% of the 15236 zip code residents lived in the same house 1 year ago. Out of people who lived in different houses, 63% moved from this county. Out of people who lived in different houses, 8% moved from different county within same state. Out of people who lived in different houses, 27% moved from different state. Out of people who lived in different houses, 6% moved from abroad.
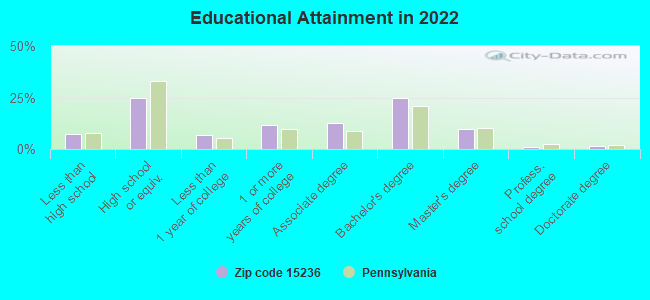
Private vs. public school enrollment:
Students in private schools in grades 1 to 8 (elementary and middle school): 111
Here:
5.9%
Pennsylvania:
15.7%
Students in private schools in grades 9 to 12 (high school): 47
Here:
3.0%
Pennsylvania:
13.4%
Students in private undergraduate colleges: 253
Here:
22.9%
Pennsylvania:
39.8%
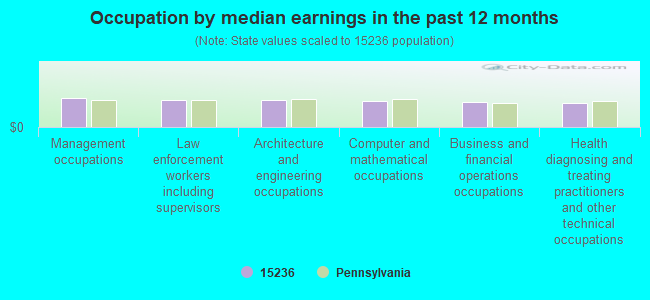
Occupation by median earnings in the past 12 months ($)
86,144Management occupations
80,587Law enforcement workers including supervisors
80,583Architecture and engineering occupations
75,221Computer and mathematical occupations
74,224Business and financial operations occupations
71,901Health diagnosing and treating practitioners and other technical occupations
Companies with federal contracts located in this zip code:
GANTREX CORPORATION (275 CURRY HOLLOW RD in PITTSBURGH, PA)
$10,030 with Navy for Maintenance, Repair or Alteration of Real Property -- Other Non-Building Facilities. Taking place in CA. Signed on 2001-02-28. Completion date: 2001-04-04.
GEO-CENTERS, INC (250-C CURRY HOLLOW ROAD in PITTSBURGH, PA; small business)
$3,603 with Navy for Hardware, Commercial. Signed on 2004-06-10. Completion date: 2004-08-12.
Top industries in this zip code by the number of employees in 2005:
Health Care and Social Assistance: General Medical and Surgical Hospitals (over 1000 employees: 1 establishment)
2005 - 2018 National Fire Incident Reporting System (NFIRS) incidents
Based on the data from the years 2005 - 2018 the average number of fire incidents per year is 57. The highest number of fires - 178 took place in 2015, and the least - 4 in 2005. The data has an increasing trend.
When looking into fire subcategories, the most incidents belonged to: Structure Fires (68.0%), and Outside Fires (18.0%).
Fire incident types reported to NFIRS in Zip Code 15236


 Nearest zip codes: 15227, 15234, 15129, 15210, 15226, 15102.


 Based on the data from the years 2005 - 2018 the average number of fire incidents per year is 57. The highest number of fires - 178 took place in 2015, and the least - 4 in 2005. The data has an increasing trend.
 When looking into fire subcategories, the most incidents belonged to: Structure Fires (68.0%), and Outside Fires (18.0%).