Estimated zip code population in 2022: 5,030 Zip code population in 2010: 5,368 Zip code population in 2000: 7,075
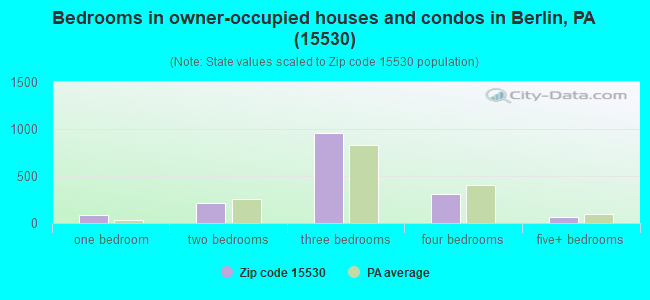
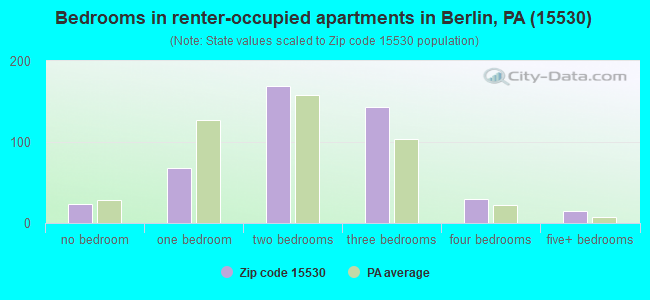
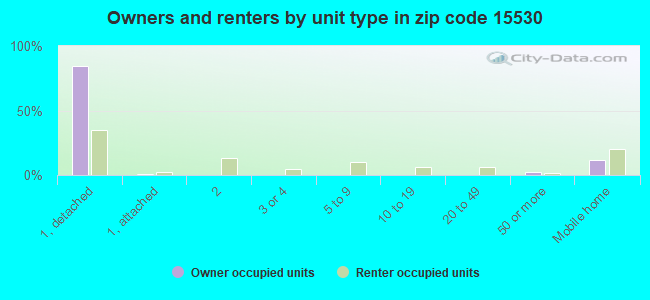
Houses and condos: 2,292 Renter-occupied apartments: 451
% of renters here:
22%
State:
31%
March 2022 cost of living index in zip code 15530: 91.5 (less than average, U.S. average is 100)
Land area: 87.5 sq. mi. Water area: 0.0 sq. mi.
Population density: 57 people per square mile
(very low).
OSM Map
General Map
Google Map
MSN Map
OSM Map
General Map
Google Map
MSN Map
OSM Map
General Map
Google Map
MSN Map
OSM Map
General Map
Google Map
MSN Map
Please wait while loading the map...
Real estate property taxes paid for housing units in 2022:
This zip code:
0.8% ($1,315)
Pennsylvania:
1.3% ($3,094)
Median real estate property taxes paid for housing units with mortgages in 2022: $1,326 (0.8%) Median real estate property taxes paid for housing units with no mortgage in 2022: $1,304 (0.9%)
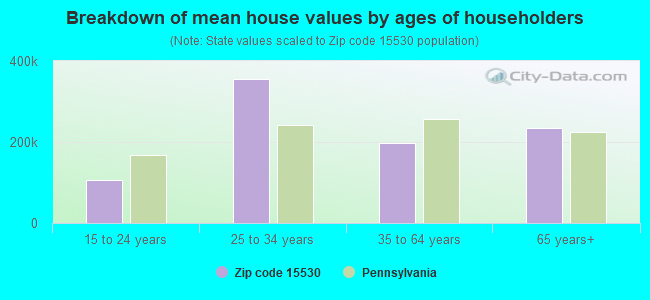
Estimated median house/condo value in 2022: $157,806
15530:
$157,806
Pennsylvania:
$245,500
According to our research of Pennsylvania and other state lists, there were 2 registered sex offenders living in 15530 zip code as of May 10, 2024. The ratio of all residents to sex offenders in zip code 15530 is 2,692 to 1. The ratio of registered sex offenders to all residents in this zip code is much lower than the state average.
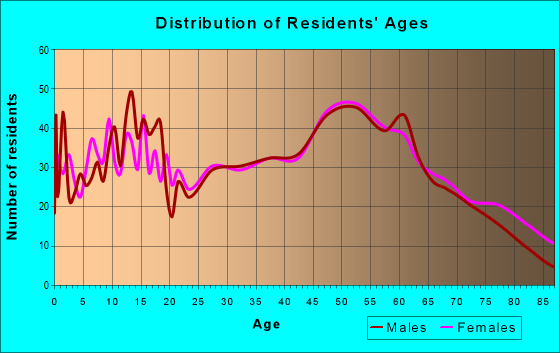
Median resident age:
This zip code:
49.7 years
Pennsylvania median age:
40.9 years
Average household size:
This zip code:
2.3 people
Pennsylvania:
2.4 people
Averages for the 2020 tax year for zip code 15530, filed in 2021:
Average Adjusted Gross Income (AGI) in 2020: $55,444 (Individual Income Tax Returns)
Here:
$55,444
State:
$75,707
Salary/wage: $48,809 (reported on 78.8% of returns)
Here:
$48,809
State:
$62,806
(% of AGI for various income ranges: 1168.9% for AGIs below $25k, 3485.2% for AGIs $25k-50k, 6478.4% for AGIs $50k-75k, 8362.9% for AGIs $75k-100k, 13674.8% for AGIs $100k-200k)
Taxable interest for individuals: $1,216 (reported on 41.1% of returns)
This zip code:
$1,216
Pennsylvania:
$1,633
(% of AGI for various income ranges: 29.1% for AGIs below $25k, 23.7% for AGIs $25k-50k, 65.6% for AGIs $50k-75k, 86.2% for AGIs $75k-100k, 140.9% for AGIs $100k-200k)
Ordinary dividends: $3,373 (reported on 20.8% of returns)
Here:
$3,373
State:
$7,382
(% of AGI for various income ranges: 41.5% for AGIs below $25k, 52.6% for AGIs $25k-50k, 102.8% for AGIs $50k-75k, 113.3% for AGIs $75k-100k, 313.5% for AGIs $100k-200k)
Net capital gain/loss in AGI: +$9,413 (reported on 16.5% of returns)
Here:
+$9,413
State:
+$23,522
(% of AGI for various income ranges: 33.8% for AGIs below $25k, 62.2% for AGIs $25k-50k, 126.0% for AGIs $50k-75k, 200.5% for AGIs $75k-100k, 1082.6% for AGIs $100k-200k)
Profit/loss from business: +$11,363 (reported on 12.7% of returns)
Here:
+$11,363
State:
+$16,274
(% of AGI for various income ranges: 117.9% for AGIs below $25k, 173.3% for AGIs $25k-50k, 339.6% for AGIs $50k-75k, 268.6% for AGIs $75k-100k, 280.4% for AGIs $100k-200k)
Taxable individual retirement arrangement distribution: $11,270 (reported on 14.0% of returns)
15530:
$11,270
Pennsylvania:
$18,583
(% of AGI for various income ranges: 141.3% for AGIs below $25k, 134.6% for AGIs $25k-50k, 180.4% for AGIs $50k-75k, 272.9% for AGIs $75k-100k, 613.9% for AGIs $100k-200k)
Total itemized deductions: $33,520 (reported on 2.1% of returns)
Here:
$33,520
State:
$34,850
(% of AGI for various income ranges: 728.7% for AGIs $100k-200k)
Charity contributions: $12,500 (reported on 1.7% of returns)
Here:
$12,500
State:
$12,392
(% of AGI for various income ranges: 217.4% for AGIs $100k-200k)
Taxes paid: $6,440 (reported on 2.1% of returns)
15530:
$6,440
State:
$8,200
(% of AGI for various income ranges: 140.0% for AGIs $100k-200k)
Earned income credit: $2,037 (reported on 11.4% of returns)
Here:
$2,037
State:
$2,100
(% of AGI for various income ranges: 66.0% for AGIs below $25k, 52.2% for AGIs $25k-50k)
Percentage of individuals using paid preparers for their 2020 taxes: 92.8%
Here:
93%
State:
92%
(% for various income ranges: 92.2% for AGIs below $25k, 91.7% for AGIs $25k-50k, 91.7% for AGIs $50k-75k, 96.4% for AGIs $75k-100k, 93.8% for AGIs $100k-200k, 100.0% for AGIs over 200k)
Averages for the 2012 tax year for zip code 15530, filed in 2013:
Average Adjusted Gross Income (AGI) in 2012: $44,814 (Individual Income Tax Returns)
Here:
$44,814
State:
$61,346
Salary/wage: $39,255 (reported on 81.1% of returns)
Here:
$39,255
State:
$51,902
(% of AGI for various income ranges: 68.2% for AGIs below $25k, 76.6% for AGIs $25k-50k, 79.6% for AGIs $50k-75k, 81.8% for AGIs $75k-100k, 80.9% for AGIs $100k-200k)
Taxable interest for individuals: $900 (reported on 40.2% of returns)
This zip code:
$900
Pennsylvania:
$1,588
(% of AGI for various income ranges: 2.5% for AGIs below $25k, 0.6% for AGIs $25k-50k, 0.7% for AGIs $50k-75k, 0.4% for AGIs $75k-100k, 0.6% for AGIs $100k-200k, 0.8% for AGIs over 200k)
Ordinary dividends: $3,040 (reported on 20.5% of returns)
Here:
$3,040
State:
$5,827
(% of AGI for various income ranges: 1.9% for AGIs below $25k, 0.9% for AGIs $25k-50k, 0.8% for AGIs $50k-75k, 0.5% for AGIs $75k-100k, 4.1% for AGIs $100k-200k)
Net capital gain/loss in AGI: +$11,150 (reported on 13.1% of returns)
Here:
+$11,150
State:
+$14,495
(% of AGI for various income ranges: 0.6% for AGIs $25k-50k, 1.1% for AGIs $50k-75k, 0.5% for AGIs $75k-100k, 15.4% for AGIs $100k-200k)
Profit/loss from business: +$13,382 (reported on 13.5% of returns)
Here:
+$13,382
State:
+$16,268
(% of AGI for various income ranges: 5.2% for AGIs below $25k, 4.3% for AGIs $25k-50k, 3.2% for AGIs $50k-75k, 1.7% for AGIs $75k-100k, 8.7% for AGIs $100k-200k)
Taxable individual retirement arrangement distribution: $8,438 (reported on 11.9% of returns)
15530:
$8,438
Pennsylvania:
$14,550
(% of AGI for various income ranges: 5.5% for AGIs below $25k, 2.1% for AGIs $25k-50k, 1.5% for AGIs $50k-75k, 2.0% for AGIs $75k-100k, 2.8% for AGIs $100k-200k)
Total itemized deductions: $19,259 (20% of AGI, reported on 15.2% of returns)
Here:
$19,259
State:
$23,538
Here:
19.7% of AGI
State:
18.4% of AGI
(% of AGI for various income ranges: 5.5% for AGIs below $25k, 3.9% for AGIs $25k-50k, 4.7% for AGIs $50k-75k, 7.0% for AGIs $75k-100k, 9.1% for AGIs $100k-200k, 11.7% for AGIs over 200k)
Charity contributions: $5,239 (reported on 11.5% of returns)
Here:
$5,239
State:
$4,025
(% of AGI for various income ranges: 1.0% for AGIs $25k-50k, 0.7% for AGIs $50k-75k, 1.1% for AGIs $75k-100k, 2.0% for AGIs $100k-200k, 4.5% for AGIs over 200k)
Taxes paid: $6,092 (reported on 14.8% of returns)
15530:
$6,092
State:
$9,982
(% of AGI for various income ranges: 0.9% for AGIs below $25k, 0.8% for AGIs $25k-50k, 1.4% for AGIs $50k-75k, 2.3% for AGIs $75k-100k, 3.2% for AGIs $100k-200k, 4.5% for AGIs over 200k)
Earned income credit: $1,966 (reported on 14.3% of returns)
Here:
$1,966
State:
$2,106
(% of AGI for various income ranges: 4.2% for AGIs below $25k, 1.0% for AGIs $25k-50k)
Percentage of individuals using paid preparers for their 2012 taxes: 62.3%
Here:
62%
State:
53%
(% for various income ranges: 56.6% for AGIs below $25k, 62.3% for AGIs $25k-50k, 70.7% for AGIs $50k-75k, 66.7% for AGIs $75k-100k, 68.8% for AGIs $100k-200k, 66.7% for AGIs over 200k)
Averages for the 2004 tax year for zip code 15530, filed in 2005:
Average Adjusted Gross Income (AGI) in 2004: $34,936 (Individual Income Tax Returns)
Here:
$34,936
State:
$48,049
Salary/wage: $31,511 (reported on 82.6% of returns)
Here:
$31,511
State:
$42,646
(% of AGI for various income ranges: 113.7% for AGIs below $10k, 71.3% for AGIs $10k-25k, 84.1% for AGIs $25k-50k, 84.5% for AGIs $50k-75k, 81.2% for AGIs $75k-100k, 36.3% for AGIs over 100k)
Taxable interest for individuals: $1,552 (reported on 49.7% of returns)
This zip code:
$1,552
Pennsylvania:
$1,657
(% of AGI for various income ranges: 12.1% for AGIs below $10k, 3.7% for AGIs $10k-25k, 1.8% for AGIs $25k-50k, 1.6% for AGIs $50k-75k, 1.1% for AGIs $75k-100k, 2.4% for AGIs over 100k)
Taxable dividends: $2,620 (reported on 25.0% of returns)
Here:
$2,620
State:
$3,566
(% of AGI for various income ranges: 5.5% for AGIs below $10k, 1.4% for AGIs $10k-25k, 1.1% for AGIs $25k-50k, 1.1% for AGIs $50k-75k, 1.5% for AGIs $75k-100k, 4.6% for AGIs over 100k)
Net capital gain/loss: +$9,771 (reported on 15.2% of returns)
Here:
+$9,771
State:
+$9,716
(% of AGI for various income ranges: 3.1% for AGIs below $10k, 0.6% for AGIs $10k-25k, 0.8% for AGIs $25k-50k, 1.7% for AGIs $50k-75k, 2.3% for AGIs $75k-100k, 18.1% for AGIs over 100k)
Profit/loss from business: +$8,225 (reported on 14.5% of returns)
Here:
+$8,225
State:
+$14,267
(% of AGI for various income ranges: 8.7% for AGIs below $10k, 5.5% for AGIs $10k-25k, 2.6% for AGIs $25k-50k, 1.4% for AGIs $50k-75k, 3.5% for AGIs $75k-100k, 5.8% for AGIs over 100k)
IRA payment deduction: $2,774 (reported on 4.9% of returns)
15530:
$2,774
Pennsylvania:
$2,903
(% of AGI for various income ranges: 0.7% for AGIs $10k-25k, 0.5% for AGIs $25k-50k, 0.4% for AGIs $50k-75k, 0.2% for AGIs over 100k)
Total itemized deductions: $14,436 (20% of AGI, reported on 14.7% of returns)
Here:
$14,436
State:
$18,804
Here:
19.6% of AGI
State:
19.5% of AGI
(% of AGI for various income ranges: 5.3% for AGIs $10k-25k, 4.3% for AGIs $25k-50k, 7.7% for AGIs $50k-75k, 9.1% for AGIs $75k-100k, 5.7% for AGIs over 100k)
Charity contributions deductions: $2,791 (4% of AGI, reported on 12.1% of returns)
Here:
$2,791
State:
$3,337
Here:
3.5% of AGI
State:
3.3% of AGI
(% of AGI for various income ranges: 0.6% for AGIs $10k-25k, 0.5% for AGIs $25k-50k, 1.1% for AGIs $50k-75k, 1.9% for AGIs $75k-100k, 1.3% for AGIs over 100k)
Total tax: $4,547 (reported on 72.8% of returns)
15530:
$4,547
State:
$8,008
(% of AGI for various income ranges: 4.3% for AGIs below $10k, 4.2% for AGIs $10k-25k, 6.5% for AGIs $25k-50k, 7.7% for AGIs $50k-75k, 10.0% for AGIs $75k-100k, 21.2% for AGIs over 100k)
Earned income credit: $1,583 (reported on 14.2% of returns)
Here:
$1,583
State:
$1,643
Percentage of individuals using paid preparers for their 2004 taxes: 62.6%
Here:
63%
State:
56%
(% for various income ranges: 59.4% for AGIs below $10k, 61.3% for AGIs $10k-25k, 63.6% for AGIs $25k-50k, 63.0% for AGIs $50k-75k, 63.4% for AGIs $75k-100k, 88.1% for AGIs over 100k)
Household received Food Stamps/SNAP in the past 12 months: 222 Household did not receive Food Stamps/SNAP in the past 12 months: 1,855
Women who had a birth in the past 12 months: 63 (60 now married, 6 unmarried) Women who did not have a birth in the past 12 months: 701 (366 now married, 331 unmarried)
Housing units in zip code 15530 with a mortgage: 741 (98 second mortgage, 3 home equity loan, 89 both second mortgage and home equity loan) Houses without a mortgage: 104
Median monthly owner costs for units with a mortgage: $1,196 Median monthly owner costs for units without a mortgage: $434
Residents with income below the poverty level in 2022:
This zip code:
10.0%
Whole state:
11.8%
Residents with income below 50% of the poverty level in 2022:
This zip code:
6.5%
Whole state:
6.1%
Median number of rooms in houses and condos:
Here:
6.5
State:
6.8
Median number of rooms in apartments:
Here:
4.7
State:
4.3
Notable locations in this zip code not listed on our city pages
Notable locations in zip code 15530: Vietersburg (A), East Liberty (B), Buffalo Station (C), Davey Station (D), Hillcrest Grange (E), Pennwood Farms (F), Deeters Gap (G), Pine Hill Station (H), Salco Mines (I), Cambria Four Mine Station (J), Pine Hill Mine Number 1 Station (K), Pine Hill Mine Number 2 Station (L), Berlin Fire Department (M), New Baltimore and Area Volunteer Fire Department (N). Display/hide their locations on the map
Churches in zip code 15530 include: Saint Gregorys Church (A), Sarver Church (B), Saint Lukes Church (C), Saint Johns Church (D), Saint Michaels Church (E), Saint Pauls Church (F), Salem Church (G). Display/hide their locations on the map
Streams, rivers, and creeks: Wills Run (A), Wambaugh Run (B), Tubs Run (C), Hays Run (D), Glades Creek (E), Breastwork Run (F), Millers Run (G), Three Lick Run (H), Reitz Creek (I). Display/hide their locations on the map
In group quarters: 172 (-1 institutionalized population)
Size of family households: 878 2-persons, 291 3-persons, 124 4-persons, 56 5-persons, 57 6-persons, 33 7-or-more-persons
Size of nonfamily households: 544 1-person, 64 2-persons, 30 4-persons
761 married couples with children.
189 single-parent households (84 men, 105 women).
97.1% of residents of 15530 zip code speak English at home.
0.2% of residents speak Spanish at home (100% very well).
2.0% of residents speak other Indo-European language at home (97% very well, 3% not well).
0.6% of residents speak Asian or Pacific Island language at home (100% well).
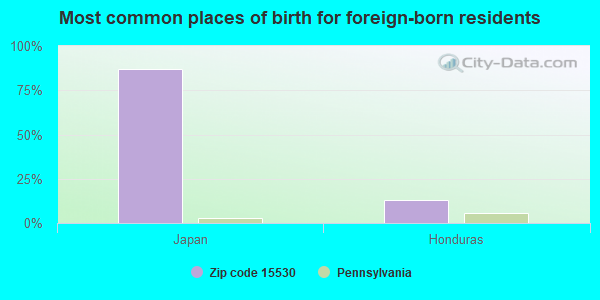
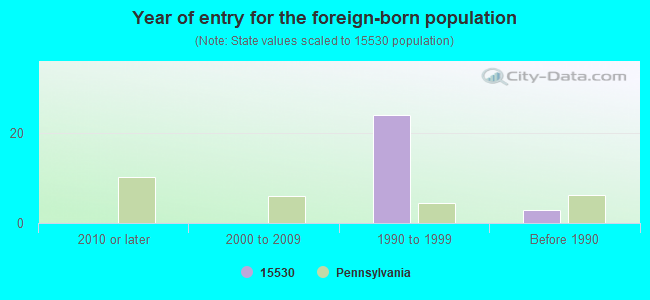
Foreign born population: 31 (0.6%) (100.0% of them are naturalized citizens)
This zip code:
0.6%
Whole state:
7.5%
87%Japan
13%Honduras
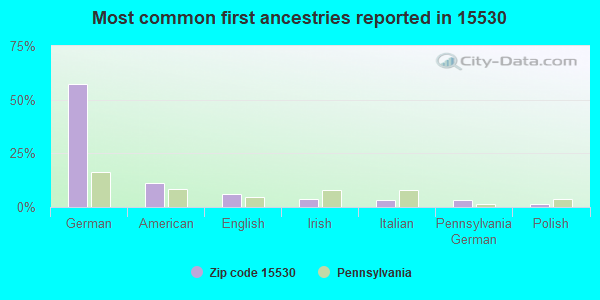
57%German
11%American
6%English
4%Irish
3%Italian
3%Pennsylvania German
2%Polish
Year of entry for the foreign-born population
02010 or later
02000 to 2009
241990 to 1999
3Before 1990
Facilities with environmental interests located in this zip code:
BERLIN BROS VALLEY ELEM SECONDARY SCH (1025 MAIN ST in BERLIN, PA)
AIR MINOR (AIRS/AFS) AIR SYNTHETIC MINOR (AIRS/AFS) STATE MASTER (Pennsylvania database) - AFS-25-1213327-2, AIR PROGRAM, AFS-25-1213327-1, STATE MASTER (Pennsylvania database) - AFS-25-1213327-1, AIR PROGRAM Business SIC classification: ELEMENTARY AND SECONDARY SCHOOLS Organizations: BERLIN BROTHERSVALLEY SCHOOL DISTRICT (CONTRACTOR)
Alternative names: BERLIN BROS VALLEY HIGH SCHOOL, BERLIN BROS VALLEY SR HIGH SCH, BERLIN BROTHERSVALLEY SCH DIST/1025 MAIN, BERLIN-BROTHERSVALLEY SCHOOL DISTRICT
BARBARA 2 MINE (9378 GLADES PIKE in BERLIN, PA)
STATE MASTER (Pennsylvania database) - PCS-PA0217760, National Pollutant Discharge Elimination System Permit National Pollutant Discharge Elimination System NON-MAJOR (Tracking pollutant discharge elimination systems) - permit Business SIC classification: SEWERAGE SYSTEMS Organizations: ROXCOAL, INC. (OWNER/OPERATOR)
Alternative names: BARBARA NO. 2 MINE, ROXCOAL INC
BERLIN BORO (VALLEY RD in BERLIN, PA)
STATE MASTER (Pennsylvania database) - PCS-PA0021822, National Pollutant Discharge Elimination System Permit National Pollutant Discharge Elimination System NON-MAJOR (Tracking pollutant discharge elimination systems) - permit Business SIC classification: SEWERAGE SYSTEMS
BERLIN BROTHERSVALLEY EL SCH ( in BERLIN, PA)
(National Center for Education Statistics) - STATE ID-6206 Organizations: BERLIN BROTHERSVALLEY SD (SCHOOL DISTRICT)
BERLIN BROTHERSVALLEY MS ( in BERLIN, PA)
(National Center for Education Statistics) - STATE ID-7645 Organizations: BERLIN BROTHERSVALLEY SD (SCHOOL DISTRICT)
BERLIN BROTHERSVALLEY SHS ( in BERLIN, PA)
(National Center for Education Statistics) - STATE ID-6207 Organizations: BERLIN BROTHERSVALLEY SD (SCHOOL DISTRICT)
BITTNER VENDING INC (500 BROADWAY ST in BERLIN, PA)
National Pollutant Discharge Elimination System NON-MAJOR (Tracking pollutant discharge elimination systems) - permit Business SIC classification: AUTOMATIC MERCHANDISING MACHINE OPERATORS Alternative names: MILLER-PICKING CORP
Housing units lacking complete plumbing facilities: 0.8% Housing units lacking complete kitchen facilities: 2.4%
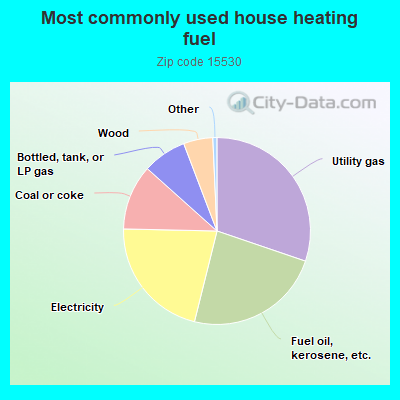
30.3%Utility gas
23.7%Fuel oil, kerosene, etc.
21.5%Electricity
11.3%Coal or coke
7.6%Bottled, tank, or LP gas
5.1%Wood
Population in 1990: 4,459. Population change in the 1990s: +2,616 (+58.7%).
Place of birth for U.S.-born residents:
This state: 4,208
Northeast: 99
Midwest: 199
South: 397
West: 68
58% of the 15530 zip code residents lived in the same house 5 years ago. Out of people who lived in different houses, 77% lived in this county. Out of people who lived in different counties, 50% lived in Pennsylvania.
94% of the 15530 zip code residents lived in the same house 1 year ago. Out of people who lived in different houses, 72% moved from this county. Out of people who lived in different houses, 8% moved from different county within same state. Out of people who lived in different houses, 19% moved from different state. Out of people who lived in different houses, 2% moved from abroad.
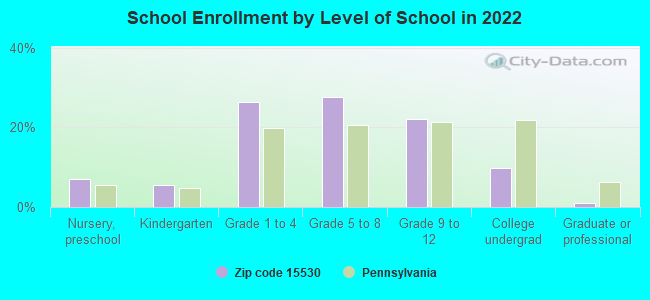
Private vs. public school enrollment:
Students in private schools in grades 1 to 8 (elementary and middle school): 57
Here:
13.8%
Pennsylvania:
15.7%
Students in private schools in grades 9 to 12 (high school): 16
Here:
9.9%
Pennsylvania:
13.4%
Students in private undergraduate colleges:
Here:
0.0%
Pennsylvania:
39.8%
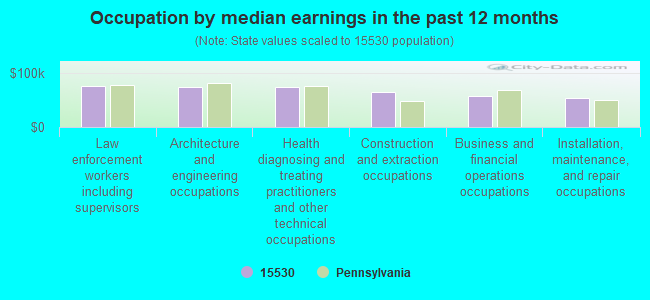
Occupation by median earnings in the past 12 months ($)
74,630Law enforcement workers including supervisors
74,357Architecture and engineering occupations
72,926Health diagnosing and treating practitioners and other technical occupations
64,416Construction and extraction occupations
57,084Business and financial operations occupations
53,606Installation, maintenance, and repair occupations
Companies with federal contracts located in this zip code:
JAY AUTOMOTIVE SPECIALTIES INC (701 NORTH ST in BERLIN, PA; small business) : $1,719,620 in 31 contractsfrom 1999 to 2002
Contracts for Miscellaneous Vehicular Components, Maintenance, Repair and Rebuilding of Equipment -- Vehicular Equipment Components, Motor Pool Operations, Miscellaneous Engine Accessories, Nonaircraft, and moreby Navy, Air Force, Army, Defense Logistics Agency, and others Signed by year:2000: $986,223; 2001: $172,090; 2002: -$27,193; 2003: $0; 2004: $0; 2005: $0; 2006: $0.
Biggest contracts:
$268,000 with Navy for Miscellaneous Vehicular Components. Taking place in NC. Signed on 2000-10-17. Completion date: 2001-06-30.
$268,000, same as above.Signed on 1999-10-18. Completion date: 2000-06-30.
$249,756 with Air Force for Maintenance, Repair and Rebuilding of Equipment -- Vehicular Equipment Components. Taking place in FL. Signed on 2000-10-30. Completion date: 2001-02-28.
$170,000, same as above.Signed on 2001-01-03. Completion date: 2001-01-03.
SNYDER OF BERLIN (1313 STADIUM DR in BERLIN, PA) : $6,242 in 4 contractsfrom 2004 to 2005
$5,387 with Defense Commissary Agency for Food Items For Resale. Signed on 2004-10-01. Completion date: 2005-09-30.
$352 with Defense Commissary Agency for Non-Food Items For Resale. Signed on 2005-10-01. Completion date: 2005-12-31.
$305, same as above.Signed on 2005-10-01. Completion date: 2005-12-31.
$198, same as above.Signed on 2005-10-01. Completion date: 2005-12-31.
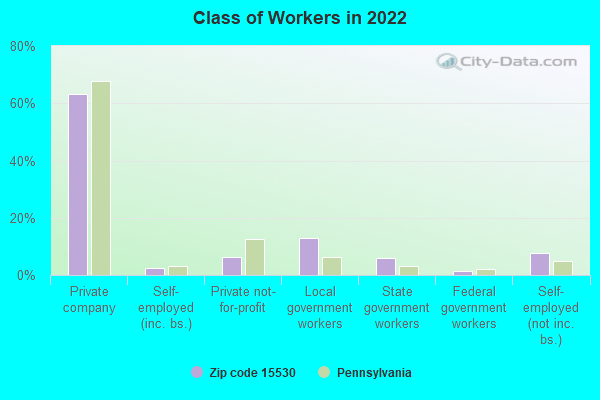
Top industries in this zip code by the number of employees in 2005:
Health Care and Social Assistance: Nursing Care Facilities (100-249 employees: 1 establishment, 1-4 employees: 1 establishment)
Other Services (except Public Administration): Religious Organizations (10-19: 1, 5-9: 2, 1-4: 4)
Wholesale Trade: Electrical Apparatus and Equipment, Wiring Supplies, and Related Equipment Merchant Wholesalers (5-9: 5)
Construction: Commercial and Institutional Building Construction (20-49: 1)
People in group quarters in 2010:
133 people in nursing facilities/skilled-nursing facilities
20 people in group homes intended for adults
People in group quarters in 2000:
1,769 people in state prisons
139 people in nursing homes
17 people in homes for the mentally retarded
10 people in other noninstitutional group quarters
Fatal accident statistics in 2014:
Fatal accident count: 1
Vehicles involved in fatal accidents: 2
Fatal accidents caused by drunken drivers: 0
Fatalities: 1
Persons involved in fatal accidents: 2
Pedestrians involved in fatal accidents: 0
Fatal accident statistics in 2012:
Fatal accident count: 1
Vehicles involved in fatal accidents: 1
Fatal accidents caused by drunken drivers: 1
Fatalities: 1
Persons involved in fatal accidents: 1
Pedestrians involved in fatal accidents: 0
Home Mortgage Disclosure Act Aggregated Statistics For Year 2003 (Based on 6 partial tracts)
A) FHA, FSA/RHS & VA Home Purchase Loans
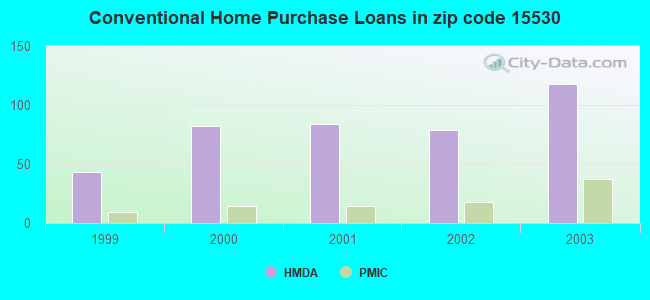
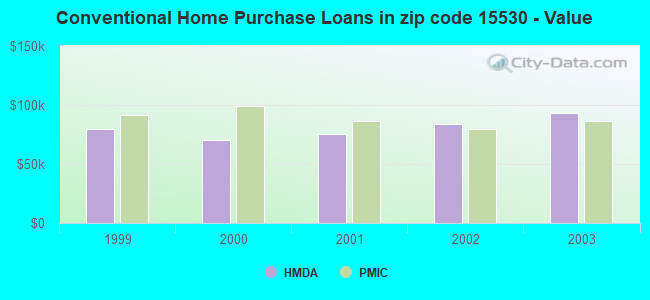
B) Conventional Home Purchase Loans
C) Refinancings
D) Home Improvement Loans
F) Non-occupant Loans on < 5 Family Dwellings (A B C & D)
Number
Average Value
Number
Average Value
Number
Average Value
Number
Average Value
Number
Average Value
LOANS ORIGINATED
4
$73,470
118
$93,055
329
$79,069
113
$37,850
44
$133,387
APPLICATIONS APPROVED, NOT ACCEPTED
0
$0
8
$68,021
50
$76,007
9
$29,567
1
$42,760
APPLICATIONS DENIED
3
$61,883
23
$56,783
131
$80,277
26
$25,733
4
$79,920
APPLICATIONS WITHDRAWN
0
$0
12
$72,200
64
$75,737
3
$73,113
6
$95,660
FILES CLOSED FOR INCOMPLETENESS
0
$0
1
$211,820
9
$85,829
1
$61,020
1
$211,820
Aggregated Statistics For Year 2002 (Based on 6 partial tracts)
A) FHA, FSA/RHS & VA Home Purchase Loans
B) Conventional Home Purchase Loans
C) Refinancings
D) Home Improvement Loans
F) Non-occupant Loans on < 5 Family Dwellings (A B C & D)
Number
Average Value
Number
Average Value
Number
Average Value
Number
Average Value
Number
Average Value
LOANS ORIGINATED
17
$76,039
79
$83,803
237
$74,959
69
$28,225
33
$137,192
APPLICATIONS APPROVED, NOT ACCEPTED
0
$0
8
$81,981
41
$73,195
5
$28,054
1
$125,620
APPLICATIONS DENIED
1
$126,960
23
$49,610
118
$70,159
28
$24,282
2
$157,570
APPLICATIONS WITHDRAWN
1
$41,430
4
$68,278
79
$77,331
4
$11,918
1
$114,260
FILES CLOSED FOR INCOMPLETENESS
0
$0
2
$246,010
13
$115,109
1
$50,310
0
$0
Aggregated Statistics For Year 2001 (Based on 6 partial tracts)
A) FHA, FSA/RHS & VA Home Purchase Loans
B) Conventional Home Purchase Loans
C) Refinancings
D) Home Improvement Loans
F) Non-occupant Loans on < 5 Family Dwellings (A B C & D)
Number
Average Value
Number
Average Value
Number
Average Value
Number
Average Value
Number
Average Value
LOANS ORIGINATED
19
$70,005
84
$75,239
224
$62,765
84
$23,030
15
$90,003
APPLICATIONS APPROVED, NOT ACCEPTED
0
$0
23
$35,192
27
$53,097
12
$32,765
0
$0
APPLICATIONS DENIED
2
$74,265
40
$35,402
139
$59,726
32
$21,578
2
$71,005
APPLICATIONS WITHDRAWN
2
$108,440
3
$85,780
45
$66,724
8
$14,996
2
$124,285
FILES CLOSED FOR INCOMPLETENESS
0
$0
1
$36,750
13
$88,488
0
$0
1
$36,750
Aggregated Statistics For Year 2000 (Based on 6 partial tracts)
A) FHA, FSA/RHS & VA Home Purchase Loans
B) Conventional Home Purchase Loans
C) Refinancings
D) Home Improvement Loans
F) Non-occupant Loans on < 5 Family Dwellings (A B C & D)
Number
Average Value
Number
Average Value
Number
Average Value
Number
Average Value
Number
Average Value
LOANS ORIGINATED
16
$67,117
82
$70,631
88
$51,348
74
$18,669
21
$62,394
APPLICATIONS APPROVED, NOT ACCEPTED
1
$108,690
20
$45,354
22
$62,860
14
$17,293
1
$35,950
APPLICATIONS DENIED
0
$0
52
$34,723
67
$55,385
16
$22,874
9
$20,622
APPLICATIONS WITHDRAWN
2
$29,810
5
$52,282
21
$52,704
4
$49,768
1
$69,290
FILES CLOSED FOR INCOMPLETENESS
0
$0
1
$76,640
7
$49,733
1
$20,900
0
$0
Aggregated Statistics For Year 1999 (Based on 3 partial tracts)
A) FHA, FSA/RHS & VA Home Purchase Loans
B) Conventional Home Purchase Loans
C) Refinancings
D) Home Improvement Loans
F) Non-occupant Loans on < 5 Family Dwellings (A B C & D)
2003 - 2018 National Fire Incident Reporting System (NFIRS) incidents
Based on the data from the years 2003 - 2018 the average number of fire incidents per year is 26. The highest number of reported fire incidents - 43 took place in 2010, and the least - 6 in 2015. The data has a dropping trend.
When looking into fire subcategories, the most incidents belonged to: Structure Fires (37.8%), and Outside Fires (27.1%).
Fire incident types reported to NFIRS in Zip Code 15530
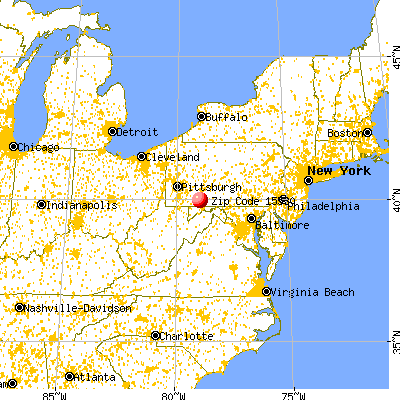


 Nearest zip codes: 15560, 15541, 15538, 15510, 15926, 15563.


 Based on the data from the years 2003 - 2018 the average number of fire incidents per year is 26. The highest number of reported fire incidents - 43 took place in 2010, and the least - 6 in 2015. The data has a dropping trend.
 When looking into fire subcategories, the most incidents belonged to: Structure Fires (37.8%), and Outside Fires (27.1%).