Estimated zip code population in 2022: 3,572 Zip code population in 2010: 3,861 Zip code population in 2000: 4,186
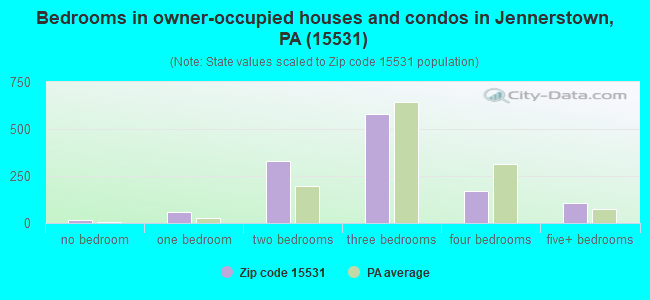
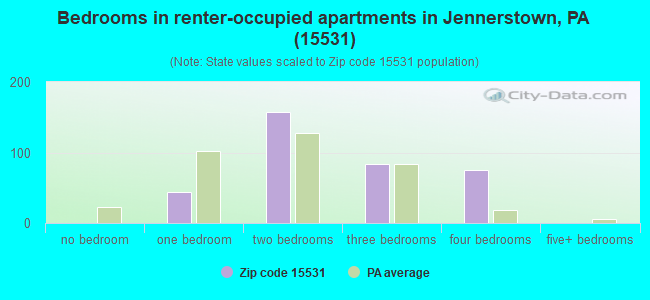
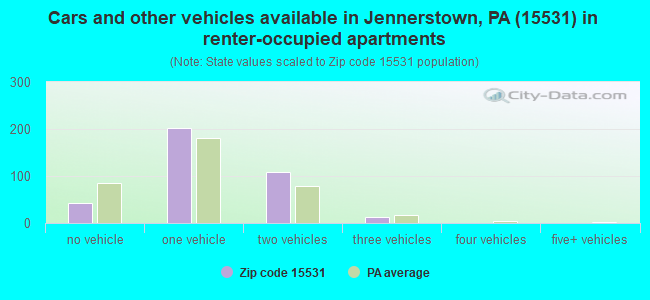
Houses and condos: 1,870 Renter-occupied apartments: 365
% of renters here:
23%
State:
31%
March 2022 cost of living index in zip code 15531: 91.2 (less than average, U.S. average is 100)
Land area: 59.0 sq. mi. Water area: 0.2 sq. mi.
Population density: 61 people per square mile
(very low).
OSM Map
General Map
Google Map
MSN Map
OSM Map
General Map
Google Map
MSN Map
OSM Map
General Map
Google Map
MSN Map
OSM Map
General Map
Google Map
MSN Map
Please wait while loading the map...
Real estate property taxes paid for housing units in 2022:
This zip code:
1.0% ($1,364)
Pennsylvania:
1.3% ($3,094)
Median real estate property taxes paid for housing units with mortgages in 2022: $2,013 (1.2%) Median real estate property taxes paid for housing units with no mortgage in 2022: $1,137 (0.9%)
Business Search- 14 Million verified businesses
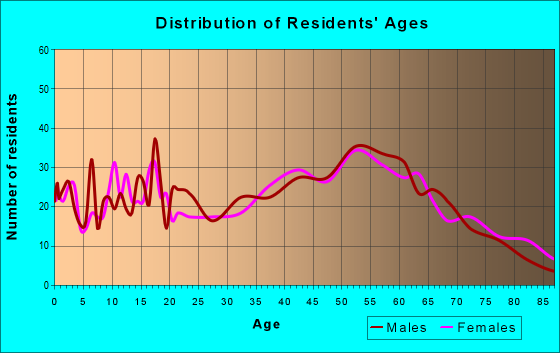
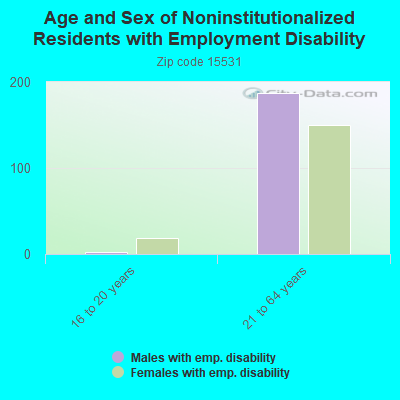
Males: 1,761
(49.3%)
Females: 1,810
(50.7%)
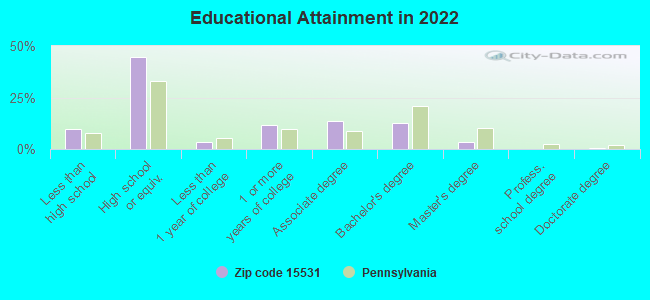
For population 25 years and over in 15531:
High school or higher: 88.5%
Bachelor's degree or higher: 16.7%
Graduate or professional degree: 4.1%
Unemployed: 4.3%
Mean travel time to work (commute): 23.5 minutes
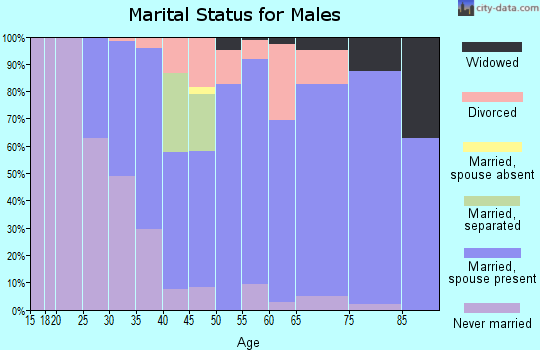
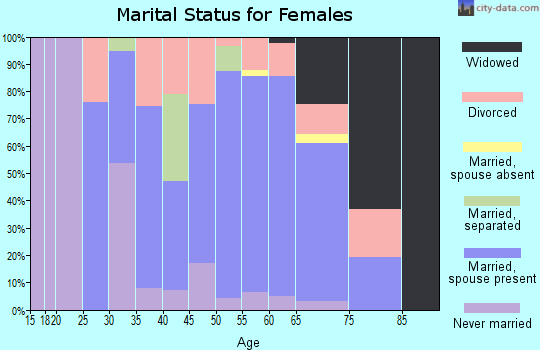
For population 15 years and over in 15531:
Never married: 27.8%
Now married: 53.2%
Separated: 1.2%
Widowed: 7.2%
Divorced: 10.6%
Zip code 15531 compared to state average:
Median house value below state average.
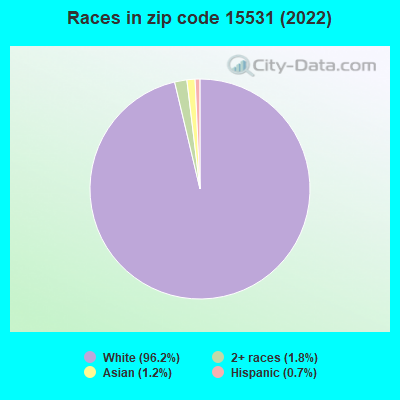
Black race population percentage significantly below state average.
Hispanic race population percentage significantly below state average.
Median age above state average.
Foreign-born population percentage significantly below state average.
Length of stay since moving in significantly above state average.
Number of college students below state average.
Percentage of population with a bachelor's degree or higher below state average.
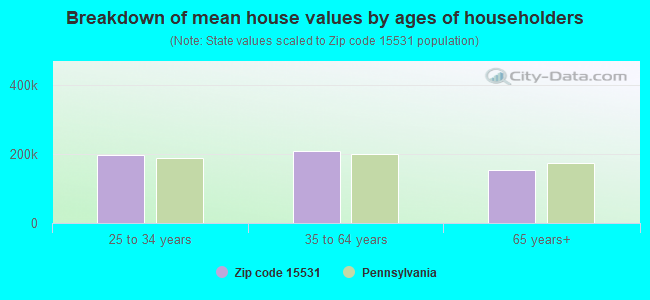
Estimated median house/condo value in 2022: $138,053
15531:
$138,053
Pennsylvania:
$245,500
According to our research of Pennsylvania and other state lists, there were 4 registered sex offenders living in 15531 zip code as of April 27, 2024. The ratio of all residents to sex offenders in zip code 15531 is 1,081 to 1. The ratio of registered sex offenders to all residents in this zip code is lower than the state average.
Median resident age:
This zip code:
45.6 years
Pennsylvania median age:
40.9 years
Average household size:
This zip code:
2.2 people
Pennsylvania:
2.4 people
Averages for the 2020 tax year for zip code 15531, filed in 2021:
Average Adjusted Gross Income (AGI) in 2020: $51,583 (Individual Income Tax Returns)
Here:
$51,583
State:
$75,707
Salary/wage: $43,520 (reported on 79.2% of returns)
Here:
$43,520
State:
$62,806
(% of AGI for various income ranges: 1067.2% for AGIs below $25k, 3235.6% for AGIs $25k-50k, 5948.1% for AGIs $50k-75k, 8587.5% for AGIs $75k-100k, 14932.7% for AGIs $100k-200k)
Taxable interest for individuals: $937 (reported on 32.9% of returns)
This zip code:
$937
Pennsylvania:
$1,633
(% of AGI for various income ranges: 26.5% for AGIs below $25k, 16.1% for AGIs $25k-50k, 21.0% for AGIs $50k-75k, 98.3% for AGIs $75k-100k, 189.1% for AGIs $100k-200k)
Ordinary dividends: $3,921 (reported on 16.8% of returns)
Here:
$3,921
State:
$7,382
(% of AGI for various income ranges: 24.5% for AGIs below $25k, 28.1% for AGIs $25k-50k, 41.4% for AGIs $50k-75k, 129.2% for AGIs $75k-100k, 632.7% for AGIs $100k-200k)
Net capital gain/loss in AGI: +$6,225 (reported on 13.9% of returns)
Here:
+$6,225
State:
+$23,522
(% of AGI for various income ranges: 17.5% for AGIs below $25k, 36.7% for AGIs $25k-50k, 86.2% for AGIs $50k-75k, 101.7% for AGIs $75k-100k, 899.1% for AGIs $100k-200k)
Profit/loss from business: +$9,975 (reported on 11.6% of returns)
Here:
+$9,975
State:
+$16,274
(% of AGI for various income ranges: 89.0% for AGIs below $25k, 114.7% for AGIs $25k-50k, 249.0% for AGIs $50k-75k, 281.7% for AGIs $75k-100k, 331.8% for AGIs $100k-200k)
Taxable individual retirement arrangement distribution: $11,356 (reported on 14.5% of returns)
15531:
$11,356
Pennsylvania:
$18,583
(% of AGI for various income ranges: 113.2% for AGIs below $25k, 154.7% for AGIs $25k-50k, 202.9% for AGIs $50k-75k, 357.5% for AGIs $75k-100k, 885.5% for AGIs $100k-200k)
Total itemized deductions: $34,300 (reported on 1.7% of returns)
Here:
$34,300
State:
$34,850
(% of AGI for various income ranges: 857.5% for AGIs $75k-100k)
Charity contributions: $26,950 (reported on 1.2% of returns)
Here:
$26,950
State:
$12,392
(% of AGI for various income ranges: 256.7% for AGIs $50k-75k)
Taxes paid: $6,000 (reported on 1.7% of returns)
15531:
$6,000
State:
$8,200
(% of AGI for various income ranges: 150.0% for AGIs $75k-100k)
Earned income credit: $2,196 (reported on 15.0% of returns)
Here:
$2,196
State:
$2,100
(% of AGI for various income ranges: 78.8% for AGIs below $25k, 71.1% for AGIs $25k-50k)
Percentage of individuals using paid preparers for their 2020 taxes: 93.1%
Here:
93%
State:
92%
(% for various income ranges: 91.9% for AGIs below $25k, 93.5% for AGIs $25k-50k, 92.9% for AGIs $50k-75k, 94.1% for AGIs $75k-100k, 94.4% for AGIs $100k-200k, 100.0% for AGIs over 200k)
Averages for the 2012 tax year for zip code 15531, filed in 2013:
Average Adjusted Gross Income (AGI) in 2012: $43,420 (Individual Income Tax Returns)
Here:
$43,420
State:
$61,346
Salary/wage: $38,988 (reported on 81.9% of returns)
Here:
$38,988
State:
$51,902
(% of AGI for various income ranges: 70.5% for AGIs below $25k, 79.1% for AGIs $25k-50k, 76.1% for AGIs $50k-75k, 77.5% for AGIs $75k-100k, 66.7% for AGIs $100k-200k)
Taxable interest for individuals: $1,042 (reported on 36.3% of returns)
This zip code:
$1,042
Pennsylvania:
$1,588
(% of AGI for various income ranges: 1.3% for AGIs below $25k, 0.8% for AGIs $25k-50k, 0.5% for AGIs $50k-75k, 0.7% for AGIs $75k-100k, 1.1% for AGIs $100k-200k)
Ordinary dividends: $3,026 (reported on 15.8% of returns)
Here:
$3,026
State:
$5,827
(% of AGI for various income ranges: 0.7% for AGIs below $25k, 0.5% for AGIs $25k-50k, 0.4% for AGIs $50k-75k, 0.3% for AGIs $75k-100k, 2.7% for AGIs $100k-200k)
Net capital gain/loss in AGI: +$2,376 (reported on 9.9% of returns)
Here:
+$2,376
State:
+$14,495
(% of AGI for various income ranges: 0.3% for AGIs $25k-50k, 0.9% for AGIs $50k-75k, 1.0% for AGIs $100k-200k)
Profit/loss from business: +$11,929 (reported on 14.0% of returns)
Here:
+$11,929
State:
+$16,268
(% of AGI for various income ranges: 4.8% for AGIs below $25k, 3.3% for AGIs $25k-50k, 5.4% for AGIs $50k-75k, 4.7% for AGIs $100k-200k)
Taxable individual retirement arrangement distribution: $8,689 (reported on 10.5% of returns)
15531:
$8,689
Pennsylvania:
$14,550
(% of AGI for various income ranges: 4.5% for AGIs below $25k, 2.0% for AGIs $25k-50k, 2.5% for AGIs $50k-75k, 3.8% for AGIs $75k-100k)
Total itemized deductions: $19,776 (20% of AGI, reported on 14.6% of returns)
Here:
$19,776
State:
$23,538
Here:
19.6% of AGI
State:
18.4% of AGI
(% of AGI for various income ranges: 4.8% for AGIs below $25k, 3.2% for AGIs $25k-50k, 5.4% for AGIs $50k-75k, 7.2% for AGIs $75k-100k, 10.6% for AGIs $100k-200k)
Charity contributions: $5,105 (reported on 11.1% of returns)
Here:
$5,105
State:
$4,025
(% of AGI for various income ranges: 0.4% for AGIs $25k-50k, 1.0% for AGIs $50k-75k, 1.3% for AGIs $75k-100k, 2.7% for AGIs $100k-200k)
Taxes paid: $6,056 (reported on 14.6% of returns)
15531:
$6,056
State:
$9,982
(% of AGI for various income ranges: 0.6% for AGIs below $25k, 1.0% for AGIs $25k-50k, 1.6% for AGIs $50k-75k, 2.4% for AGIs $75k-100k, 3.5% for AGIs $100k-200k)
Earned income credit: $2,038 (reported on 17.0% of returns)
Here:
$2,038
State:
$2,106
(% of AGI for various income ranges: 5.0% for AGIs below $25k, 1.0% for AGIs $25k-50k)
Percentage of individuals using paid preparers for their 2012 taxes: 54.4%
Here:
54%
State:
53%
(% for various income ranges: 48.1% for AGIs below $25k, 52.4% for AGIs $25k-50k, 59.3% for AGIs $50k-75k, 61.5% for AGIs $75k-100k, 83.3% for AGIs $100k-200k)
Averages for the 2004 tax year for zip code 15531, filed in 2005:
Average Adjusted Gross Income (AGI) in 2004: $31,494 (Individual Income Tax Returns)
Here:
$31,494
State:
$48,049
Salary/wage: $29,639 (reported on 82.4% of returns)
Here:
$29,639
State:
$42,646
(% of AGI for various income ranges: 88.1% for AGIs below $10k, 74.6% for AGIs $10k-25k, 82.9% for AGIs $25k-50k, 85.7% for AGIs $50k-75k, 84.8% for AGIs $75k-100k, 49.8% for AGIs over 100k)
Taxable interest for individuals: $1,322 (reported on 41.9% of returns)
This zip code:
$1,322
Pennsylvania:
$1,657
(% of AGI for various income ranges: 7.9% for AGIs below $10k, 2.5% for AGIs $10k-25k, 1.3% for AGIs $25k-50k, 0.8% for AGIs $50k-75k, 0.6% for AGIs $75k-100k, 3.0% for AGIs over 100k)
Taxable dividends: $1,714 (reported on 20.1% of returns)
Here:
$1,714
State:
$3,566
(% of AGI for various income ranges: 2.6% for AGIs below $10k, 1.1% for AGIs $10k-25k, 0.7% for AGIs $25k-50k, 0.7% for AGIs $50k-75k, 0.5% for AGIs $75k-100k, 2.6% for AGIs over 100k)
Net capital gain/loss: +$3,276 (reported on 12.3% of returns)
Here:
+$3,276
State:
+$9,716
(% of AGI for various income ranges: 1.6% for AGIs below $10k, 0.4% for AGIs $10k-25k, 0.4% for AGIs $25k-50k, 1.0% for AGIs $50k-75k, 0.1% for AGIs $75k-100k, 5.0% for AGIs over 100k)
Profit/loss from business: +$9,754 (reported on 14.5% of returns)
Here:
+$9,754
State:
+$14,267
(% of AGI for various income ranges: 6.2% for AGIs below $10k, 3.9% for AGIs $10k-25k, 5.5% for AGIs $25k-50k, 3.0% for AGIs $50k-75k, 0.1% for AGIs $75k-100k, 8.1% for AGIs over 100k)
IRA payment deduction: $2,632 (reported on 4.0% of returns)
15531:
$2,632
Pennsylvania:
$2,903
Total itemized deductions: $15,779 (22% of AGI, reported on 13.2% of returns)
Here:
$15,779
State:
$18,804
Here:
21.7% of AGI
State:
19.5% of AGI
(% of AGI for various income ranges: 5.5% for AGIs $10k-25k, 4.9% for AGIs $25k-50k, 6.4% for AGIs $50k-75k, 8.9% for AGIs $75k-100k, 11.2% for AGIs over 100k)
Charity contributions deductions: $3,257 (4% of AGI, reported on 11.2% of returns)
Here:
$3,257
State:
$3,337
Here:
4.4% of AGI
State:
3.3% of AGI
(% of AGI for various income ranges: 0.5% for AGIs $10k-25k, 0.5% for AGIs $25k-50k, 1.2% for AGIs $50k-75k, 1.6% for AGIs $75k-100k, 2.8% for AGIs over 100k)
Total tax: $3,996 (reported on 70.1% of returns)
15531:
$3,996
State:
$8,008
(% of AGI for various income ranges: 2.8% for AGIs below $10k, 4.3% for AGIs $10k-25k, 6.5% for AGIs $25k-50k, 8.4% for AGIs $50k-75k, 10.7% for AGIs $75k-100k, 18.5% for AGIs over 100k)
Earned income credit: $1,502 (reported on 17.4% of returns)
Here:
$1,502
State:
$1,643
Percentage of individuals using paid preparers for their 2004 taxes: 57.1%
Here:
57%
State:
56%
(% for various income ranges: 56.5% for AGIs below $10k, 52.9% for AGIs $10k-25k, 58.8% for AGIs $25k-50k, 58.0% for AGIs $50k-75k, 60.0% for AGIs $75k-100k, 80.4% for AGIs over 100k)
Household received Food Stamps/SNAP in the past 12 months: 333 Household did not receive Food Stamps/SNAP in the past 12 months: 1,295
Women who had a birth in the past 12 months: 31 (29 now married, 3 unmarried) Women who did not have a birth in the past 12 months: 718 (301 now married, 416 unmarried)
Housing units in zip code 15531 with a mortgage: 674 (74 second mortgage, 52 both second mortgage and home equity loan) Houses without a mortgage: 47
Median monthly owner costs for units with a mortgage: $1,180 Median monthly owner costs for units without a mortgage: $470
Residents with income below the poverty level in 2022:
This zip code:
15.3%
Whole state:
11.8%
Residents with income below 50% of the poverty level in 2022:
This zip code:
12.9%
Whole state:
6.1%
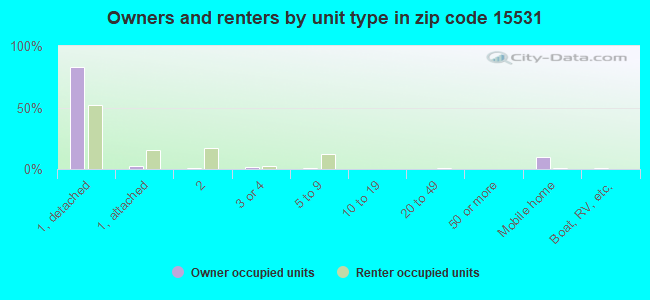
Median number of rooms in houses and condos:
Here:
6.2
State:
6.8
Median number of rooms in apartments:
Here:
6.0
State:
4.3
Notable locations in this zip code not listed on our city pages
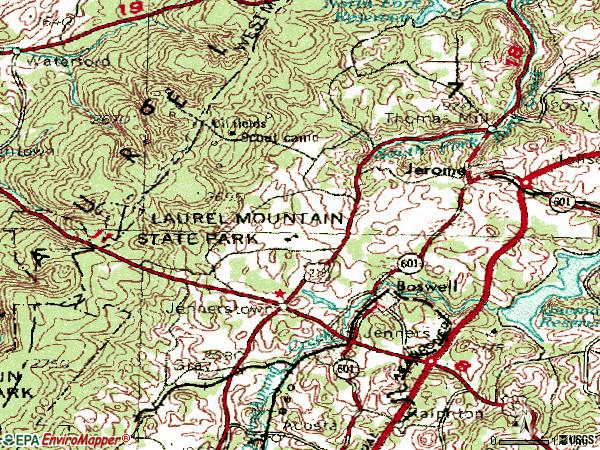
Notable locations in zip code 15531: Laurel Mountain Ski Resort (A), Morgans Mills (B), Camp Sequanota (C), Pine Springs Camp (D), Roaring Run Camp (E), Boswell Volunteer Fire Department (F). Display/hide their locations on the map
Churches in zip code 15531 include: Beam Church (A), Laurel Hill Tabernacle (B), Saint James Church (C), Mount Zion Church (D). Display/hide their locations on the map
Cemeteries: Saint Stanislaus Cemetery (1), Saints Peter and Paul Cemetery (2), Saint Marys Cemetery (3), Old Calvary Cemetery (4). Display/hide their locations on the map
Reservoirs: Stoughton Lake (A), Jennerstown Reservoir (B), Boswell Reservoir (C), Lake Gloria (D), Conemaugh Township Reservoir (E), Beverly Lake (F). Display/hide their locations on the map
Streams, rivers, and creeks: North Branch South Fork Bens Creek (A), Gum Run (B), Flat Run (C), Spruce Run (D), Beam Run (E), Bear Creek (F), Coal Run (G), Card Machine Run (H), Roaring Run (I). Display/hide their locations on the map
In group quarters: 1 (-1 institutionalized population)
Size of family households: 611 2-persons, 130 3-persons, 166 4-persons, 54 5-persons, 9 6-persons, 50 7-or-more-persons
Size of nonfamily households: 559 1-person, 42 2-persons, 1 4-persons
474 married couples with children.
147 single-parent households (37 men, 110 women).
99.0% of residents of 15531 zip code speak English at home.
0.6% of residents speak Spanish at home (100% very well).
0.1% of residents speak other Indo-European language at home (100% very well).
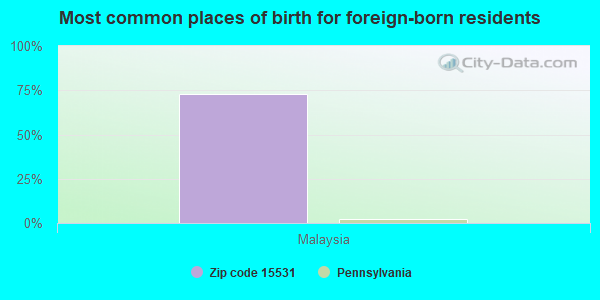
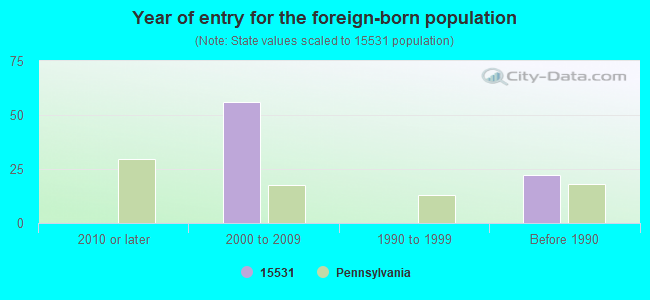
Foreign born population: 79 (2.2%) (15.9% of them are naturalized citizens)
This zip code:
2.2%
Whole state:
7.5%
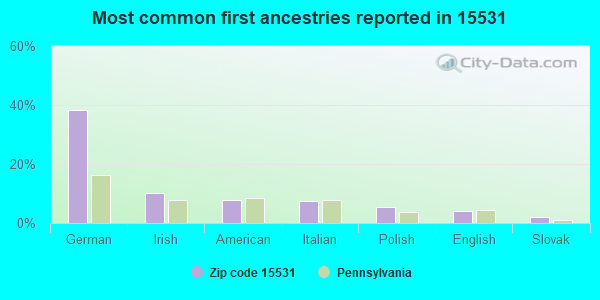
73%Malaysia
38%German
10%Irish
8%American
7%Italian
5%Polish
4%English
2%Slovak
Year of entry for the foreign-born population
02010 or later
562000 to 2009
01990 to 1999
22Before 1990
Facilities with environmental interests located in this zip code:
ADELPHOI GREYSTONE HOUSE (537 LINCOLN HWY in BOSWELL, PA)
STATE MASTER (Pennsylvania database) - PCS-PA0219274, National Pollutant Discharge Elimination System Permit National Pollutant Discharge Elimination System NON-MAJOR (Tracking pollutant discharge elimination systems) - permit Business SIC classification: SEWERAGE SYSTEMS Alternative names: ADELPHOI INC, ADELPHOI INC
AT & T LONG LINES EQUIP ENGR (RD 2 in BOSWELL, PA)
National Pollutant Discharge Elimination System NON-MAJOR (Tracking pollutant discharge elimination systems) - permit Business SIC classification: SEWERAGE SYSTEMS Alternative names: GRIZZLE INC/TA CASA NOVA, GRIZZLE INC/TA CASA NOVA BAR
Housing units lacking complete plumbing facilities: 3.8% Housing units lacking complete kitchen facilities: 4.3%
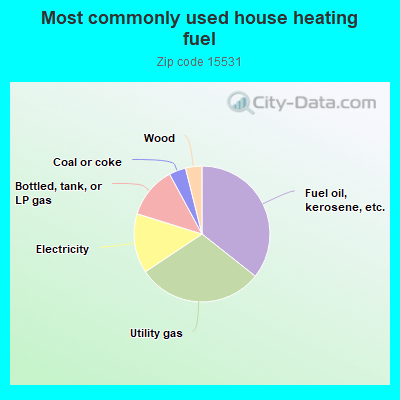
35.7%Fuel oil, kerosene, etc.
30.0%Utility gas
14.2%Electricity
12.3%Bottled, tank, or LP gas
4.0%Coal or coke
3.9%Wood
Population in 1990: 1,681. Population change in the 1990s: +2,505 (+149.0%).
Place of birth for U.S.-born residents:
This state: 3,168
Northeast: 113
Midwest: 48
South: 111
West: 17
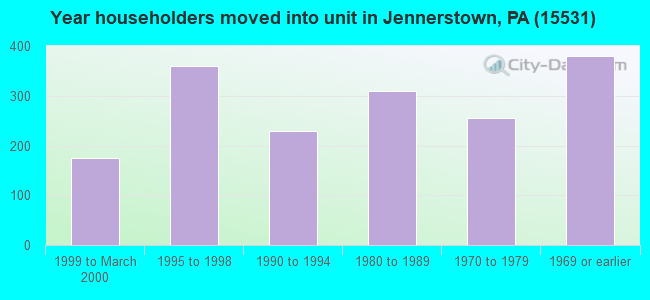
72% of the 15531 zip code residents lived in the same house 5 years ago. Out of people who lived in different houses, 76% lived in this county. Out of people who lived in different counties, 50% lived in Pennsylvania.
95% of the 15531 zip code residents lived in the same house 1 year ago. Out of people who lived in different houses, 96% moved from this county. Out of people who lived in different houses, 2% moved from different county within same state. Out of people who lived in different houses, 3% moved from different state.
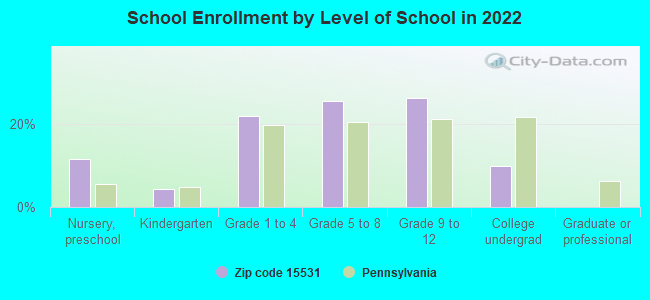
Private vs. public school enrollment:
Students in private schools in grades 1 to 8 (elementary and middle school): 27
Here:
10.2%
Pennsylvania:
15.7%
Students in private schools in grades 9 to 12 (high school):
Here:
0.0%
Pennsylvania:
13.4%
Students in private undergraduate colleges: 9
Here:
17.8%
Pennsylvania:
39.8%
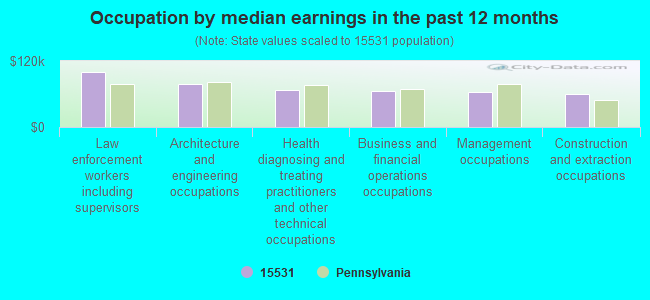
Occupation by median earnings in the past 12 months ($)
100,734Law enforcement workers including supervisors
78,662Architecture and engineering occupations
67,946Health diagnosing and treating practitioners and other technical occupations
64,765Business and financial operations occupations
62,814Management occupations
59,322Construction and extraction occupations
Companies with federal contracts located in this zip code:
STRAW CONSTRUCTION CO INC (429 FETTEROLF RD in BOSWELL, PA; small business)
$4,223,895 with Army for Maintenance, Repair or Alteration of Real Property -- Office Buildings. Signed on 2000-09-22. Completion date: 2001-10-30.
OUTDOOR ODYSSEY (BOY SCOUT ROAD in BOSWELL, PA) : $97,666 in 10 contractsfrom 2003 to 2006
Contracts for Reserve Training (Military), Other Education and Training Services, Lease or Rental of Equipment -- Recreational and Athletic Equipment, Lease or Rental of Equipment -- Miscellaneous, and moreby Navy, Army Signed by year:2000: $0; 2001: $0; 2002: $0; 2003: $4,500; 2004: $13,054; 2005: $25,112; 2006: $55,000.
Biggest contracts:
$50,000 with Navy for Reserve Training (Military). Taking place in VA. Signed on 2006-03-31. Completion date: 2006-09-30.
$22,000 with Army for Other Education and Training Services. Signed on 2005-06-16. Completion date: 2005-06-24.
$7,200 with Army for Lease or Rental of Equipment -- Recreational and Athletic Equipment. Signed on 2004-08-04. Completion date: 2004-09-26.
$6,654 with Navy for Lease or Rental of Equipment -- Miscellaneous. Signed on 2004-09-30. Completion date: 2004-10-01.
Top industries in this zip code by the number of employees in 2005:
Arts, Entertainment, and Recreation: Skiing Facilities (50-99 employees: 1 establishment)
Construction: Site Preparation Contractors (20-49: 1, 10-19: 1, 1-4: 1)
Accommodation and Food Services: Limited-Service Restaurants (20-49: 1, 10-19: 1)
Accommodation and Food Services: Full-Service Restaurants (20-49: 1, 1-4: 1)
Administrative and Support and Waste Management and Remediation Services: All Other Support Services (20-49: 1)
Administrative and Support and Waste Management and Remediation Services: Security Systems Services (except Locksmiths) (20-49: 1)
Fatal accident statistics in 2014:
Fatal accident count: 1
Vehicles involved in fatal accidents: 2
Fatal accidents caused by drunken drivers: 2
Fatalities: 1
Persons involved in fatal accidents: 2
Pedestrians involved in fatal accidents: 0
Fatal accident statistics in 2013:
Fatal accident count: 1
Vehicles involved in fatal accidents: 1
Fatal accidents caused by drunken drivers: 1
Fatalities: 1
Persons involved in fatal accidents: 1
Pedestrians involved in fatal accidents: 0
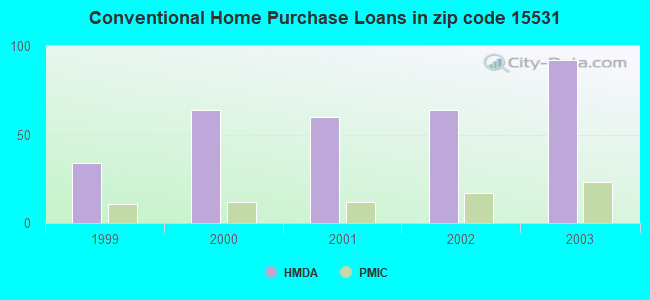
Home Mortgage Disclosure Act Aggregated Statistics For Year 2003 (Based on 2 partial tracts)
A) FHA, FSA/RHS & VA Home Purchase Loans
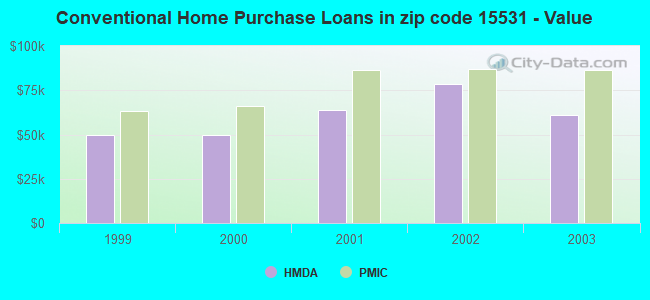
B) Conventional Home Purchase Loans
C) Refinancings
D) Home Improvement Loans
F) Non-occupant Loans on < 5 Family Dwellings (A B C & D)
Number
Average Value
Number
Average Value
Number
Average Value
Number
Average Value
Number
Average Value
LOANS ORIGINATED
14
$53,009
92
$61,030
350
$65,094
86
$27,628
23
$49,727
APPLICATIONS APPROVED, NOT ACCEPTED
0
$0
8
$44,665
64
$70,958
14
$26,614
3
$73,803
APPLICATIONS DENIED
2
$39,700
31
$60,390
160
$66,234
26
$17,325
9
$55,141
APPLICATIONS WITHDRAWN
0
$0
11
$82,042
92
$85,180
5
$13,132
5
$32,066
FILES CLOSED FOR INCOMPLETENESS
0
$0
3
$78,893
12
$84,112
2
$38,175
3
$53,953
Aggregated Statistics For Year 2002 (Based on 2 partial tracts)
A) FHA, FSA/RHS & VA Home Purchase Loans
B) Conventional Home Purchase Loans
C) Refinancings
D) Home Improvement Loans
F) Non-occupant Loans on < 5 Family Dwellings (A B C & D)
Number
Average Value
Number
Average Value
Number
Average Value
Number
Average Value
Number
Average Value
LOANS ORIGINATED
6
$73,042
64
$78,354
243
$56,241
81
$13,498
15
$75,739
APPLICATIONS APPROVED, NOT ACCEPTED
2
$46,575
8
$46,382
55
$57,998
8
$23,286
2
$64,135
APPLICATIONS DENIED
0
$0
27
$39,815
144
$69,680
20
$19,851
6
$37,412
APPLICATIONS WITHDRAWN
0
$0
8
$46,955
56
$71,551
6
$11,452
5
$52,834
FILES CLOSED FOR INCOMPLETENESS
0
$0
0
$0
24
$72,851
5
$33,288
0
$0
Aggregated Statistics For Year 2001 (Based on 2 partial tracts)
A) FHA, FSA/RHS & VA Home Purchase Loans
B) Conventional Home Purchase Loans
C) Refinancings
D) Home Improvement Loans
F) Non-occupant Loans on < 5 Family Dwellings (A B C & D)
Number
Average Value
Number
Average Value
Number
Average Value
Number
Average Value
Number
Average Value
LOANS ORIGINATED
17
$65,841
60
$63,905
191
$47,817
76
$16,174
21
$49,010
APPLICATIONS APPROVED, NOT ACCEPTED
3
$33,593
24
$55,608
40
$47,910
9
$14,591
2
$21,380
APPLICATIONS DENIED
0
$0
46
$36,947
125
$56,621
38
$10,568
11
$27,903
APPLICATIONS WITHDRAWN
0
$0
11
$80,654
52
$83,163
8
$22,332
3
$422,980
FILES CLOSED FOR INCOMPLETENESS
0
$0
0
$0
12
$45,938
2
$26,725
2
$122,160
Aggregated Statistics For Year 2000 (Based on 2 partial tracts)
A) FHA, FSA/RHS & VA Home Purchase Loans
B) Conventional Home Purchase Loans
C) Refinancings
D) Home Improvement Loans
F) Non-occupant Loans on < 5 Family Dwellings (A B C & D)
Number
Average Value
Number
Average Value
Number
Average Value
Number
Average Value
Number
Average Value
LOANS ORIGINATED
17
$59,374
64
$49,484
108
$49,373
82
$14,227
17
$48,325
APPLICATIONS APPROVED, NOT ACCEPTED
2
$35,120
21
$40,356
18
$34,527
20
$26,646
5
$32,372
APPLICATIONS DENIED
3
$58,533
52
$36,677
70
$49,737
41
$12,663
2
$7,635
APPLICATIONS WITHDRAWN
2
$53,445
11
$31,512
41
$53,669
9
$5,260
3
$45,810
FILES CLOSED FOR INCOMPLETENESS
0
$0
0
$0
3
$66,170
0
$0
0
$0
Aggregated Statistics For Year 1999 (Based on 1 partial tract)
A) FHA, FSA/RHS & VA Home Purchase Loans
B) Conventional Home Purchase Loans
C) Refinancings
D) Home Improvement Loans
F) Non-occupant Loans on < 5 Family Dwellings (A B C & D)
Detailed PMIC statistics for the following Tracts:0206.00
2004 - 2018 National Fire Incident Reporting System (NFIRS) incidents
Based on the data from the years 2004 - 2018 the average number of fires per year is 20. The highest number of reported fire incidents - 38 took place in 2010, and the least - 3 in 2018. The data has a declining trend.
When looking into fire subcategories, the most reports belonged to: Structure Fires (67.2%), and Outside Fires (15.2%).
Fire incident types reported to NFIRS in Zip Code 15531
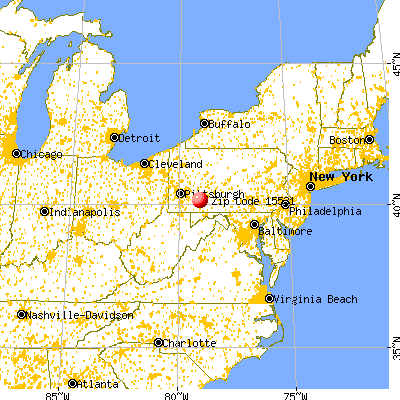


 Nearest zip codes: 15547, 15544, 15546, 15655, 15520, 15561.
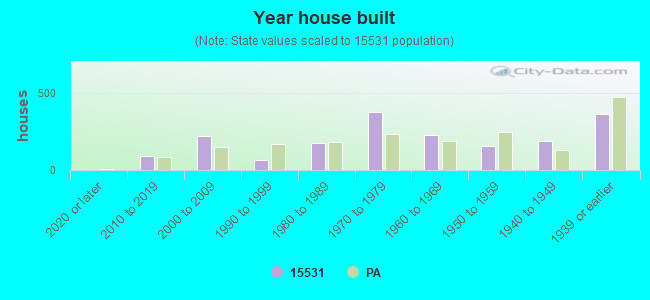


 Based on the data from the years 2004 - 2018 the average number of fires per year is 20. The highest number of reported fire incidents - 38 took place in 2010, and the least - 3 in 2018. The data has a declining trend.
 When looking into fire subcategories, the most reports belonged to: Structure Fires (67.2%), and Outside Fires (15.2%).