Estimated zip code population in 2022: 55,842 Zip code population in 2010: 59,483 Zip code population in 2000: 57,255
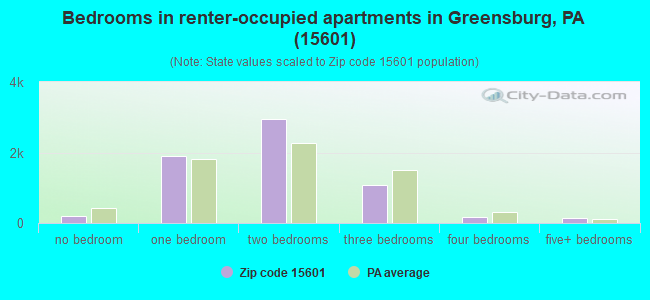
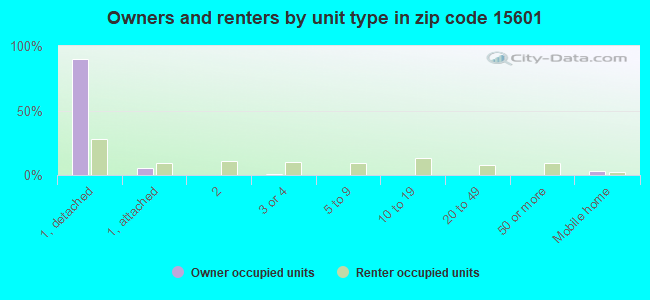
Houses and condos: 26,214 Renter-occupied apartments: 6,427
% of renters here:
26%
State:
31%
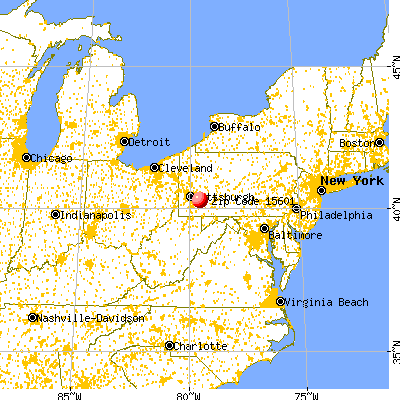
March 2022 cost of living index in zip code 15601: 89.8 (less than average, U.S. average is 100)
Land area: 86.2 sq. mi. Water area: 0.2 sq. mi.
Population density: 648 people per square mile
(low).
OSM Map
General Map
Google Map
MSN Map
OSM Map
General Map
Google Map
MSN Map
OSM Map
General Map
Google Map
MSN Map
OSM Map
General Map
Google Map
MSN Map
Please wait while loading the map...
Real estate property taxes paid for housing units in 2022:
This zip code:
1.3% ($2,706)
Pennsylvania:
1.3% ($3,094)
Median real estate property taxes paid for housing units with mortgages in 2022: $2,855 (1.2%) Median real estate property taxes paid for housing units with no mortgage in 2022: $2,512 (1.2%)
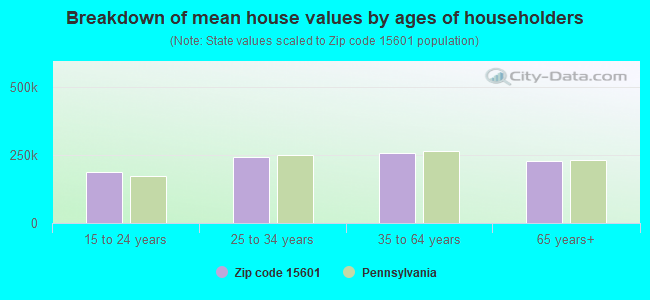
Estimated median house/condo value in 2022: $215,871
15601:
$215,871
Pennsylvania:
$245,500
According to our research of Pennsylvania and other state lists, there were 75 registered sex offenders living in 15601 zip code as of April 27, 2024. The ratio of all residents to sex offenders in zip code 15601 is 783 to 1. The ratio of registered sex offenders to all residents in this zip code is lower than the state average.
Median resident age:
This zip code:
46.2 years
Pennsylvania median age:
40.9 years
Average household size:
This zip code:
2.1 people
Pennsylvania:
2.4 people
Averages for the 2020 tax year for zip code 15601, filed in 2021:
Average Adjusted Gross Income (AGI) in 2020: $73,005 (Individual Income Tax Returns)
Here:
$73,005
State:
$75,707
Salary/wage: $59,138 (reported on 77.4% of returns)
Here:
$59,138
State:
$62,806
(% of AGI for various income ranges: 1035.7% for AGIs below $25k, 3318.4% for AGIs $25k-50k, 5739.1% for AGIs $50k-75k, 8510.3% for AGIs $75k-100k, 15968.3% for AGIs $100k-200k, 69175.6% for AGIs over 200k)
Taxable interest for individuals: $1,481 (reported on 36.1% of returns)
This zip code:
$1,481
Pennsylvania:
$1,633
(% of AGI for various income ranges: 22.4% for AGIs below $25k, 28.3% for AGIs $25k-50k, 60.6% for AGIs $50k-75k, 74.0% for AGIs $75k-100k, 121.2% for AGIs $100k-200k, 1399.1% for AGIs over 200k)
Ordinary dividends: $5,734 (reported on 25.3% of returns)
Here:
$5,734
State:
$7,382
(% of AGI for various income ranges: 37.5% for AGIs below $25k, 55.7% for AGIs $25k-50k, 122.0% for AGIs $50k-75k, 176.6% for AGIs $75k-100k, 340.1% for AGIs $100k-200k, 4733.3% for AGIs over 200k)
Net capital gain/loss in AGI: +$17,902 (reported on 20.9% of returns)
Here:
+$17,902
State:
+$23,522
(% of AGI for various income ranges: 17.5% for AGIs below $25k, 40.1% for AGIs $25k-50k, 113.0% for AGIs $50k-75k, 152.8% for AGIs $75k-100k, 512.1% for AGIs $100k-200k, 19787.2% for AGIs over 200k)
Profit/loss from business: +$18,025 (reported on 12.1% of returns)
Here:
+$18,025
State:
+$16,274
(% of AGI for various income ranges: 66.4% for AGIs below $25k, 110.5% for AGIs $25k-50k, 200.4% for AGIs $50k-75k, 298.0% for AGIs $75k-100k, 505.7% for AGIs $100k-200k, 6405.1% for AGIs over 200k)
Taxable individual retirement arrangement distribution: $19,245 (reported on 15.3% of returns)
15601:
$19,245
Pennsylvania:
$18,583
(% of AGI for various income ranges: 113.1% for AGIs below $25k, 179.1% for AGIs $25k-50k, 344.1% for AGIs $50k-75k, 602.1% for AGIs $75k-100k, 994.2% for AGIs $100k-200k, 4398.8% for AGIs over 200k)
Self-employed (Keogh) retirement plans: $19,186 (reported on 0.5% of returns)
15601:
$19,186
Pennsylvania:
$25,407
(% of AGI for various income ranges: 9.2% for AGIs $50k-75k, 19.8% for AGIs $100k-200k, 427.0% for AGIs over 200k)
Total itemized deductions: $37,019 (reported on 5.0% of returns)
Here:
$37,019
State:
$34,850
(% of AGI for various income ranges: 53.9% for AGIs below $25k, 78.0% for AGIs $25k-50k, 159.2% for AGIs $50k-75k, 286.9% for AGIs $75k-100k, 448.2% for AGIs $100k-200k, 5553.3% for AGIs over 200k)
Charity contributions: $10,904 (reported on 4.1% of returns)
Here:
$10,904
State:
$12,392
(% of AGI for various income ranges: 1.6% for AGIs below $25k, 7.6% for AGIs $25k-50k, 22.1% for AGIs $50k-75k, 57.3% for AGIs $75k-100k, 120.7% for AGIs $100k-200k, 1712.3% for AGIs over 200k)
Taxes paid: $7,389 (reported on 5.0% of returns)
15601:
$7,389
State:
$8,200
(% of AGI for various income ranges: 4.4% for AGIs below $25k, 11.1% for AGIs $25k-50k, 28.9% for AGIs $50k-75k, 74.8% for AGIs $75k-100k, 128.0% for AGIs $100k-200k, 907.4% for AGIs over 200k)
Earned income credit: $1,791 (reported on 9.2% of returns)
Here:
$1,791
State:
$2,100
(% of AGI for various income ranges: 48.5% for AGIs below $25k, 38.9% for AGIs $25k-50k, 0.8% for AGIs $50k-75k)
Percentage of individuals using paid preparers for their 2020 taxes: 89.8%
Here:
90%
State:
92%
(% for various income ranges: 87.5% for AGIs below $25k, 91.5% for AGIs $25k-50k, 90.0% for AGIs $50k-75k, 89.6% for AGIs $75k-100k, 90.7% for AGIs $100k-200k, 92.1% for AGIs over 200k)
Averages for the 2012 tax year for zip code 15601, filed in 2013:
Average Adjusted Gross Income (AGI) in 2012: $67,492 (Individual Income Tax Returns)
Here:
$67,492
State:
$61,346
Salary/wage: $51,625 (reported on 80.5% of returns)
Here:
$51,625
State:
$51,902
(% of AGI for various income ranges: 69.1% for AGIs below $25k, 73.9% for AGIs $25k-50k, 71.7% for AGIs $50k-75k, 73.1% for AGIs $75k-100k, 73.3% for AGIs $100k-200k, 37.1% for AGIs over 200k)
Taxable interest for individuals: $1,366 (reported on 41.4% of returns)
This zip code:
$1,366
Pennsylvania:
$1,588
(% of AGI for various income ranges: 1.8% for AGIs below $25k, 1.0% for AGIs $25k-50k, 0.8% for AGIs $50k-75k, 0.7% for AGIs $75k-100k, 0.7% for AGIs $100k-200k, 0.7% for AGIs over 200k)
Ordinary dividends: $4,377 (reported on 27.2% of returns)
Here:
$4,377
State:
$5,827
(% of AGI for various income ranges: 2.1% for AGIs below $25k, 1.4% for AGIs $25k-50k, 1.5% for AGIs $50k-75k, 1.5% for AGIs $75k-100k, 1.5% for AGIs $100k-200k, 2.2% for AGIs over 200k)
Net capital gain/loss in AGI: +$9,428 (reported on 18.5% of returns)
Here:
+$9,428
State:
+$14,495
(% of AGI for various income ranges: 0.2% for AGIs $25k-50k, 0.5% for AGIs $50k-75k, 0.5% for AGIs $75k-100k, 1.5% for AGIs $100k-200k, 6.6% for AGIs over 200k)
Profit/loss from business: +$21,005 (reported on 12.0% of returns)
Here:
+$21,005
State:
+$16,268
(% of AGI for various income ranges: 4.1% for AGIs below $25k, 2.7% for AGIs $25k-50k, 2.7% for AGIs $50k-75k, 2.8% for AGIs $75k-100k, 4.3% for AGIs $100k-200k, 4.4% for AGIs over 200k)
Taxable individual retirement arrangement distribution: $15,044 (reported on 14.9% of returns)
15601:
$15,044
Pennsylvania:
$14,550
(% of AGI for various income ranges: 5.4% for AGIs below $25k, 3.6% for AGIs $25k-50k, 3.7% for AGIs $50k-75k, 3.6% for AGIs $75k-100k, 3.3% for AGIs $100k-200k, 2.6% for AGIs over 200k)
Self-employment retirement plans: $18,348 (reported on 0.7% of returns)
15601:
$18,348
Pennsylvania:
$20,922
(% of AGI for various income ranges: 0.1% for AGIs $50k-75k, 0.3% for AGIs $100k-200k, 0.3% for AGIs over 200k)
Total itemized deductions: $21,333 (14% of AGI, reported on 28.4% of returns)
Here:
$21,333
State:
$23,538
Here:
14.1% of AGI
State:
18.4% of AGI
(% of AGI for various income ranges: 6.9% for AGIs below $25k, 7.6% for AGIs $25k-50k, 9.0% for AGIs $50k-75k, 10.0% for AGIs $75k-100k, 12.2% for AGIs $100k-200k, 6.9% for AGIs over 200k)
Charity contributions: $3,666 (reported on 24.1% of returns)
Here:
$3,666
State:
$4,025
(% of AGI for various income ranges: 0.5% for AGIs below $25k, 0.9% for AGIs $25k-50k, 1.2% for AGIs $50k-75k, 1.3% for AGIs $75k-100k, 1.8% for AGIs $100k-200k, 1.3% for AGIs over 200k)
Taxes paid: $8,913 (reported on 28.3% of returns)
15601:
$8,913
State:
$9,982
(% of AGI for various income ranges: 1.3% for AGIs below $25k, 2.4% for AGIs $25k-50k, 3.0% for AGIs $50k-75k, 3.8% for AGIs $75k-100k, 5.4% for AGIs $100k-200k, 3.7% for AGIs over 200k)
Earned income credit: $1,869 (reported on 10.8% of returns)
Here:
$1,869
State:
$2,106
(% of AGI for various income ranges: 3.5% for AGIs below $25k, 0.6% for AGIs $25k-50k)
Percentage of individuals using paid preparers for their 2012 taxes: 48.5%
Here:
49%
State:
53%
(% for various income ranges: 42.4% for AGIs below $25k, 46.1% for AGIs $25k-50k, 53.6% for AGIs $50k-75k, 50.9% for AGIs $75k-100k, 56.7% for AGIs $100k-200k, 76.8% for AGIs over 200k)
Averages for the 2004 tax year for zip code 15601, filed in 2005:
Average Adjusted Gross Income (AGI) in 2004: $47,731 (Individual Income Tax Returns)
Here:
$47,731
State:
$48,049
Salary/wage: $42,610 (reported on 81.7% of returns)
Here:
$42,610
State:
$42,646
(% of AGI for various income ranges: 110.8% for AGIs below $10k, 69.1% for AGIs $10k-25k, 76.2% for AGIs $25k-50k, 79.3% for AGIs $50k-75k, 80.0% for AGIs $75k-100k, 64.9% for AGIs over 100k)
Taxable interest for individuals: $1,757 (reported on 53.3% of returns)
This zip code:
$1,757
Pennsylvania:
$1,657
(% of AGI for various income ranges: 10.4% for AGIs below $10k, 3.9% for AGIs $10k-25k, 2.1% for AGIs $25k-50k, 1.6% for AGIs $50k-75k, 1.4% for AGIs $75k-100k, 1.6% for AGIs over 100k)
Taxable dividends: $3,058 (reported on 32.2% of returns)
Here:
$3,058
State:
$3,566
(% of AGI for various income ranges: 6.3% for AGIs below $10k, 2.3% for AGIs $10k-25k, 1.5% for AGIs $25k-50k, 1.3% for AGIs $50k-75k, 1.2% for AGIs $75k-100k, 2.8% for AGIs over 100k)
Net capital gain/loss: +$7,632 (reported on 23.6% of returns)
Here:
+$7,632
State:
+$9,716
(% of AGI for various income ranges: -1.3% for AGIs below $10k, 0.3% for AGIs $10k-25k, 0.5% for AGIs $25k-50k, 0.7% for AGIs $50k-75k, 0.8% for AGIs $75k-100k, 8.8% for AGIs over 100k)
Profit/loss from business: +$16,372 (reported on 12.8% of returns)
Here:
+$16,372
State:
+$14,267
(% of AGI for various income ranges: 8.5% for AGIs below $10k, 4.4% for AGIs $10k-25k, 2.9% for AGIs $25k-50k, 2.8% for AGIs $50k-75k, 3.2% for AGIs $75k-100k, 6.1% for AGIs over 100k)
IRA payment deduction: $2,939 (reported on 3.7% of returns)
15601:
$2,939
Pennsylvania:
$2,903
(% of AGI for various income ranges: 0.5% for AGIs below $10k, 0.3% for AGIs $10k-25k, 0.4% for AGIs $25k-50k, 0.3% for AGIs $50k-75k, 0.2% for AGIs $75k-100k, 0.1% for AGIs over 100k)
Self-employed pension: $12,694 (reported on 1.0% of returns)
Here:
$12,694
Pennsylvania:
$14,674
(% of AGI for various income ranges: 0.1% for AGIs $10k-25k, 0.1% for AGIs $25k-50k, 0.1% for AGIs $50k-75k, 0.2% for AGIs $75k-100k, 0.5% for AGIs over 100k)
Total itemized deductions: $17,396 (18% of AGI, reported on 30.7% of returns)
Here:
$17,396
State:
$18,804
Here:
18.1% of AGI
State:
19.5% of AGI
(% of AGI for various income ranges: 13.6% for AGIs below $10k, 7.7% for AGIs $10k-25k, 9.1% for AGIs $25k-50k, 11.5% for AGIs $50k-75k, 14.0% for AGIs $75k-100k, 11.5% for AGIs over 100k)
Charity contributions deductions: $2,965 (3% of AGI, reported on 27.6% of returns)
Here:
$2,965
State:
$3,337
Here:
3.0% of AGI
State:
3.3% of AGI
(% of AGI for various income ranges: 0.7% for AGIs below $10k, 0.8% for AGIs $10k-25k, 1.1% for AGIs $25k-50k, 1.5% for AGIs $50k-75k, 1.8% for AGIs $75k-100k, 2.3% for AGIs over 100k)
Total tax: $7,838 (reported on 76.3% of returns)
15601:
$7,838
State:
$8,008
(% of AGI for various income ranges: 2.7% for AGIs below $10k, 4.5% for AGIs $10k-25k, 7.5% for AGIs $25k-50k, 9.0% for AGIs $50k-75k, 10.6% for AGIs $75k-100k, 19.2% for AGIs over 100k)
Earned income credit: $1,441 (reported on 10.0% of returns)
Here:
$1,441
State:
$1,643
Percentage of individuals using paid preparers for their 2004 taxes: 51.1%
Here:
51%
State:
56%
(% for various income ranges: 46.2% for AGIs below $10k, 50.4% for AGIs $10k-25k, 50.9% for AGIs $25k-50k, 52.4% for AGIs $50k-75k, 50.7% for AGIs $75k-100k, 62.7% for AGIs over 100k)
Likely homosexual households (counted as self-reported same-sex unmarried-partner households)
Lesbian couples: 0.3% of all households
Gay men: 0.0% of all households
Household received Food Stamps/SNAP in the past 12 months: 2,611 Household did not receive Food Stamps/SNAP in the past 12 months: 21,866
Women who had a birth in the past 12 months: 515 (471 now married, 64 unmarried) Women who did not have a birth in the past 12 months: 11,101 (4,581 now married, 6,513 unmarried)
Housing units in zip code 15601 with a mortgage: 10,114 (1,336 second mortgage, 38 home equity loan, 1,208 both second mortgage and home equity loan) Houses without a mortgage: 455
Median monthly owner costs for units with a mortgage: $1,405 Median monthly owner costs for units without a mortgage: $548
Residents with income below the poverty level in 2022:
This zip code:
9.1%
Whole state:
11.8%
Residents with income below 50% of the poverty level in 2022:
This zip code:
5.2%
Whole state:
6.1%
Median number of rooms in houses and condos:
Here:
7.2
State:
6.8
Median number of rooms in apartments:
Here:
4.3
State:
4.3
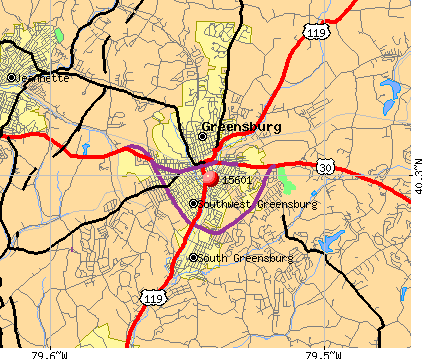
Notable locations in this zip code not listed on our city pages
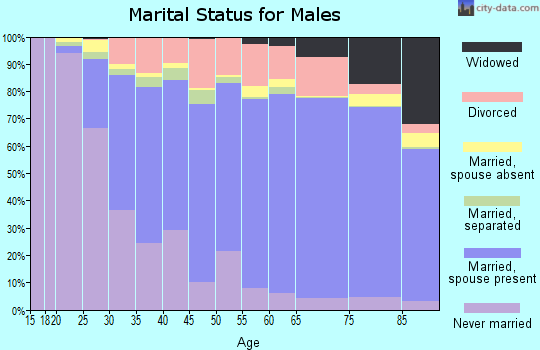
7,204 married couples with children.
1,764 single-parent households (540 men, 1,224 women).
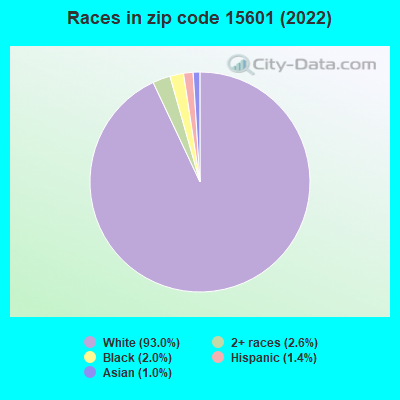
97.3% of residents of 15601 zip code speak English at home.
0.9% of residents speak Spanish at home (72% very well, 16% well, 9% not well, 3% not at all).
0.7% of residents speak other Indo-European language at home (91% very well, 9% well, 1% not well).
0.8% of residents speak Asian or Pacific Island language at home (53% very well, 14% well, 28% not well, 6% not at all).
0.1% of residents speak other language at home (64% very well, 36% well).
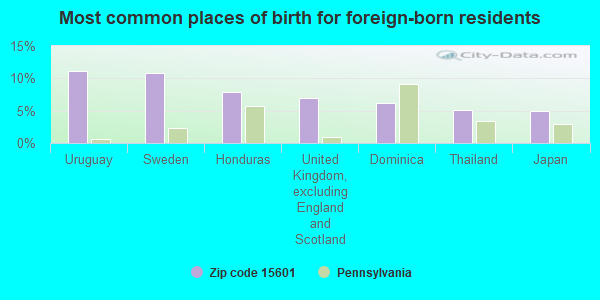
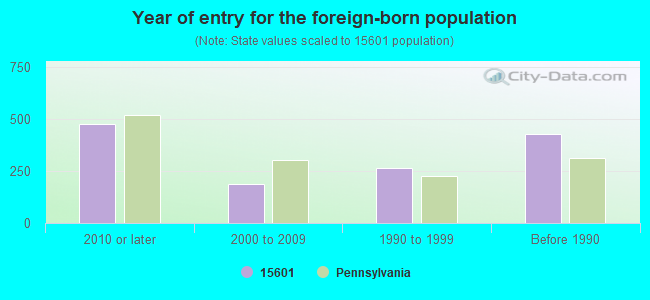
Foreign born population: 1,125 (2.0%) (54.9% of them are naturalized citizens)
Major facilities with environmental interests located in this zip code:
ASHLAND GREENSBURG BULK PLT 762 (1810 BROAD STREET EXT in GREENSBURG, PA)
AIR MINOR (AIRS/AFS) STATE MASTER (Pennsylvania database) - AFS-61-0122250-4, AIR PROGRAM Small Quantity Generators, between 100 kg and 1000 kg of hazardous waste/month (Resource Conservation and Recovery Act (tracking hazardous waste)) - notification Business SIC classification: PETROLEUM BULK STATIONS AND TERMINALS Organizations: ASHLAND BRANDED MARKETING INC (CONTACT/OWNER)
, ASHLAND INC. (OWNER/OPERATOR)
Alternative names: ASHLAND BRANDED #762-000, ASHLAND GREENSBURG BULK PLANT, BFS PETRO PROD GREENSBURG BULK PLANT 762
ALLEGHENY POWER GREENSBURG CORP CTR (800 CABIN HILL DR in GREENSBURG, PA)
STATE MASTER (Pennsylvania database) - RCRIS-PAR000512111, HAZARDOUS WASTE PROGRAM Conditionally Exempt Small Quantity Generators, less than 100 kg/month of hazardous waste (Resource Conservation and Recovery Act (tracking hazardous waste)) USED OIL PROGRAM (Resource Conservation and Recovery Act (tracking hazardous waste)) Organizations: WEST PENN POWER COMPANY DBA ALLEGHENY POWER (OWNER/OPERATOR)
ADAM EIDEMILLER INC (1611 ROSEYTOWN RD in GREENSBURG, PA)
STATE MASTER (Pennsylvania database) - RCRIS-PAR000527333, HAZARDOUS WASTE PROGRAM, WMHW WM HAZARDOUS WASTE Small Quantity Generators, between 100 kg and 1000 kg of hazardous waste/month (Resource Conservation and Recovery Act (tracking hazardous waste)) Organizations: ADAM EIDEMILLER, INC. (OWNER/OPERATOR)
BARR RES STP (2474 LONG ST in GREENSBURG, PA)
STATE MASTER (Pennsylvania database) - PCS-PAG046221, National Pollutant Discharge Elimination System Permit National Pollutant Discharge Elimination System NON-MAJOR (Tracking pollutant discharge elimination systems) - permit Business SIC classification: OPERATORS OF DWELLINGS OTHER THAN APARTMENT BUILDINGS Alternative names: BARR JR, PAUL, PAUL BARR JR
ANDERSON MACH (BEAVER RUN RD 200 YD W OF RT in GREENSBURG, PA)
STATE MASTER (Pennsylvania database) - RCRIS-PAR000008680, HAZARDOUS WASTE PROGRAM Conditionally Exempt Small Quantity Generators, less than 100 kg/month of hazardous waste (Resource Conservation and Recovery Act (tracking hazardous waste)) - notification Business SIC classification: INDUSTRIAL AND COMMERCIAL MACHINERY AND EQUIPMENT Organizations: ANDERSON BILL (CONTACT/OWNER)
AMOS K HUTCHINSON EL SCH ( in GREENSBURG, PA)
(National Center for Education Statistics) - STATE ID-7329 Organizations: GREENSBURG SALEM SD (SCHOOL DISTRICT)
AGE CRAFT MFG INC (45 MADISON AVE in GREENSBURG, PA)
(Resource Conservation and Recovery Act (tracking hazardous waste)) Business NAICS classification: SHEET METAL WORK MANUFACTURING. Organizations: OPERNAME (CONTACT/OPERATOR)
, OWNERNAME (CONTACT/OWNER)
ALLEGHENY POWER CHEMICAL LABORATORY (643 NORTH MAIN STREET in GREENSBURG, PA)
Conditionally Exempt Small Quantity Generators, less than 100 kg/month of hazardous waste (Resource Conservation and Recovery Act (tracking hazardous waste)) - notification USED OIL PROGRAM (Resource Conservation and Recovery Act (tracking hazardous waste)) Organizations: ALLEGHENY ENERGY SUPPLY CO., LLC (CONTACT/OPERATOR)
, ALLEGHENY ENERGY SUPPLY CO (CONTACT/OWNER)
Alternative names: ALLEGHENY ENERGY CHEM LAB
AMERICAN TRUCK CAP (15 RAINBOW DR in GREENSBURG, PA)
(Resource Conservation and Recovery Act (tracking hazardous waste)) Business NAICS classification: ALL OTHER PLASTICS PRODUCT MANUFACTURING.; MOTOR VEHICLE BODY MANUFACTURING. Organizations: OPERNAME (CONTACT/OPERATOR)
Alternative names: AMER TRUCK CAP MANUFACTURING
ATLANTIC SERVICE STATION (600 E PITTSBURGH ST in GREENSBURG, PA)
Small Quantity Generators, between 100 kg and 1000 kg of hazardous waste/month (Resource Conservation and Recovery Act (tracking hazardous waste)) - notification Organizations: OPERNAME (CONTACT/OPERATOR)
, THE LAMPLIGHTER INC (CONTACT/OWNER)
ALLEGHENY ENERGY SUP/HARRISON CITY CTG S (800 CABIN HILL DRIVE in GREENSBURG, PA)
AIR MAJOR (AIRS/AFS) AIR MAJOR ("Best Available" air pollution technologies tracking) Business SIC classification: ELECTRIC SERVICES Alternative names: ALLEGHENY ENERGY SUPPLY GANS CT POWER STATION, ALLEGHENY ENERGY SUP/HATFIELDS FERRY POWER STATION, ALLEGHENY ENERGY SUPPLY GANS CT POWER STATION, SPRINGDALE TOWNSHIP STATION, SPRINGDALE TOWNSHIP STATION
ALLEGHENY HIGHLIFT (GREENSBURG HEMPFIELD IND PARK in GREENSBURG, PA)
Conditionally Exempt Small Quantity Generators, less than 100 kg/month of hazardous waste (Resource Conservation and Recovery Act (tracking hazardous waste)) - notification Organizations: OPERNAME (CONTACT/OPERATOR)
, SCOTT WILLIAM (CONTACT/OWNER)
Housing units lacking complete plumbing facilities: 1.4% Housing units lacking complete kitchen facilities: 2.7%
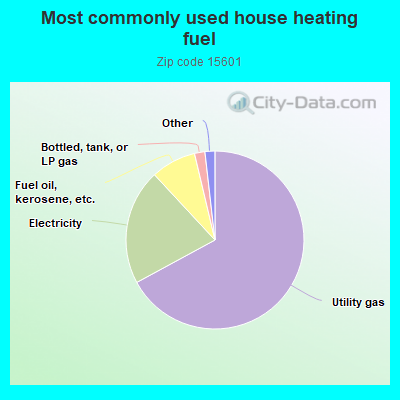
67.1%Utility gas
21.0%Electricity
8.2%Fuel oil, kerosene, etc.
1.9%Bottled, tank, or LP gas
0.7%Wood
0.6%Other fuel
Population in 1990: 52,186. Population change in the 1990s: +5,069 (+9.7%).
Place of birth for U.S.-born residents:
This state: 46,411
Northeast: 1,471
Midwest: 2,405
South: 3,062
West: 850
66% of the 15601 zip code residents lived in the same house 5 years ago. Out of people who lived in different houses, 67% lived in this county. Out of people who lived in different counties, 50% lived in Pennsylvania.
93% of the 15601 zip code residents lived in the same house 1 year ago. Out of people who lived in different houses, 63% moved from this county. Out of people who lived in different houses, 25% moved from different county within same state. Out of people who lived in different houses, 12% moved from different state. Out of people who lived in different houses, 0% moved from abroad.
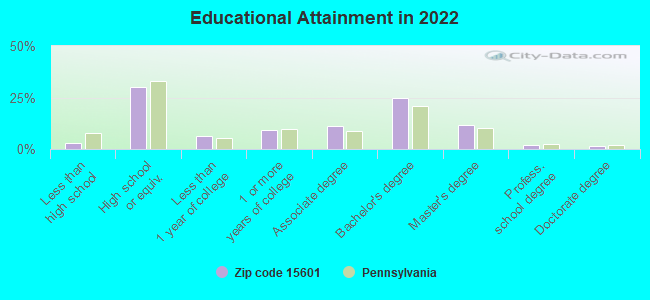
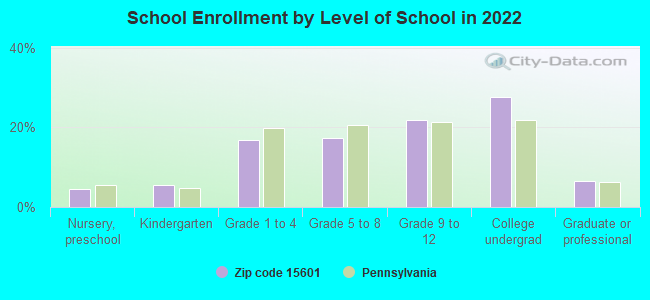
Private vs. public school enrollment:
Students in private schools in grades 1 to 8 (elementary and middle school): 485
Here:
11.9%
Pennsylvania:
15.7%
Students in private schools in grades 9 to 12 (high school): 222
Here:
8.5%
Pennsylvania:
13.4%
Students in private undergraduate colleges: 1,719
Here:
51.9%
Pennsylvania:
39.8%
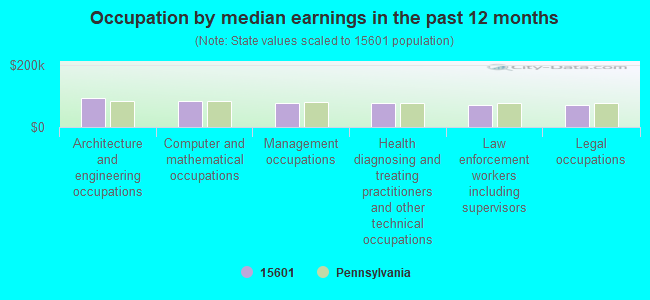
Occupation by median earnings in the past 12 months ($)
94,855Architecture and engineering occupations
84,333Computer and mathematical occupations
79,046Management occupations
76,022Health diagnosing and treating practitioners and other technical occupations
71,536Law enforcement workers including supervisors
70,792Legal occupations
Companies with biggest federal contracts located in this zip code (GREENSBURG, PA):
ALLEGHENY ENERGY SUPPLY LLC (ROSEYTOWN RD) : $18,451,694 in 73 contractsfrom 1999 to 2005
Contracts for Fuel Oils, Other Utilities, Electric Services, Gas Services, and moreby Defense Logistics Agency, Public Buildings Service, Federal Emergency Management Agency (disused code: now 7022), Federal Emergency Management Agency, and others Signed by year:2000: $11,180,200; 2001: $534,671; 2002: $425,000; 2003: $717,255; 2004: $1,461,068; 2005: $2,050,890; 2006: $0.
Biggest contracts:
$9,995,875 with Defense Logistics Agency for Fuel Oils. Taking place in MD. Signed on 2000-08-31. Completion date: 2001-05-30.
$1,944,610 with Defense Logistics Agency for Fuel Oils. Taking place in NJ. Signed on 1999-10-15. Completion date: 2001-02-28.
$1,461,068 with Public Buildings Service for Other Utilities. Signed on 2004-09-30. Completion date: 2004-09-30.
$702,594 with Public Buildings Service for Other Utilities. Taking place in WV. Signed on 2005-06-30. Completion date: 2005-06-30.
DONEGAL CONSTRUCTION CORPORATI (RD 8 BOX 340; small business) : $2,018,577 in 2 contractsin 2004
$2,026,554 with Air Force for Maintenance, Repair or Alteration of Real Property -- Other Non-Building Facilities. Signed on 2004-06-28. Completion date: 2004-10-05.
-$7,977, same as above.Signed on 2004-12-28. Completion date: 2004-10-05.
IRIS TECHNOLOGIES, INC. (WESTMORELAND INDUS PARK; small business) 50 employees, $5189761 revenue. : $1,739,578 in 71 contractsfrom 2001 to 2006
Contracts for Video Recording and Reproducing Equipment, ADP Supplies, Telephone and Telegraph Equipment, ADP Support Equipment, and moreby Army, Navy, Air Force, Defense Logistics Agency, and others Signed by year:2000: $0; 2001: $189,250; 2002: $404,922; 2003: $617,586; 2004: $297,721; 2005: $223,224; 2006: $6,875.
Biggest contracts:
$122,070 with Army for Video Recording and Reproducing Equipment. Taking place in VA. Signed on 2003-09-30. Completion date: 2003-12-30.
$81,700 with Navy for ADP Supplies. Taking place in MD. Signed on 2002-02-28. Completion date: 2002-02-28.
$78,335 with Air Force for Telephone and Telegraph Equipment. Signed on 2003-07-29. Completion date: 2003-10-27.
$75,863 with Air Force for ADP Support Equipment. Taking place in AL. Signed on 2005-09-28. Completion date: 2005-10-28.
OVERLY DOOR COMPANY (574 WEST OTTERMAN ST; small business) : $1,127,784 in 16 contractsfrom 2000 to 2006
Contracts for Cartridge and Propellant Actuated Devices and Components, Indoor and Outdoor Electric Lighting Fixtures, Office Furniture, Fencing, Fences, Gates and Components, and moreby Navy, Centers for Disease Control and Prevention, Air Force, Bureau of Engraving and Printing, and others Signed by year:2000: $599,909; 2001: $22,364; 2002: $369,099; 2003: $0; 2004: $25,236; 2005: $107,951; 2006: $3,225.
Biggest contracts:
$583,909 with Navy for Cartridge and Propellant Actuated Devices and Components. Signed on 2000-03-21. Completion date: 2000-10-31.
$369,099, same as above.Signed on 2002-10-01. Completion date: 2003-03-25.
$56,000 with Centers for Disease Control and Prevention for Indoor and Outdoor Electric Lighting Fixtures. Signed on 2005-06-27. Completion date: 2005-09-05.
$32,588 with Air Force for Office Furniture. Signed on 2005-06-30. Completion date: 2005-08-01.
NEW STANTON MACHINING & TOOLIN (RD 11 BOX 300; small business) : $644,540 in 74 contractsfrom 1999 to 2006
Contracts for Nuclear Reactors, Miscellaneous Items, Hose, Pipe, Tube, Lubrication, and Railing Fittings, Valves, Nonpowered, and moreby Navy, Defense Logistics Agency Signed by year:2000: $137,930; 2001: $0; 2002: $0; 2003: $57,650; 2004: $105,928; 2005: $229,133; 2006: $54,189.
Biggest contracts:
$137,930 with Navy for Nuclear Reactors. Signed on 2000-12-08. Completion date: 2001-06-06.
$59,710 with Navy for Miscellaneous Items. Signed on 1999-11-02. Completion date: 2000-04-02.
$57,650 with Navy for Nuclear Reactors. Signed on 2003-07-18. Completion date: 2003-12-05.
$31,779 with Navy for Hose, Pipe, Tube, Lubrication, and Railing Fittings. Signed on 2004-09-13. Completion date: 2005-01-13.
IRWIN AUTOMATION, INC (715 CLEVELAND ST; small business) : $547,690 in 44 contractsfrom 2004 to 2006
Contracts for Nuts and Washers, Studs, Screws, Hand Tools, Nonedged, Nonpowered, and moreby Navy Signed by year:2000: $0; 2001: $0; 2002: $0; 2003: $0; 2004: $197,114; 2005: $346,822; 2006: $3,754.
Biggest contracts:
$47,624 with Navy for Nuts and Washers. Signed on 2004-07-16. Completion date: 2004-11-30.
$43,546 with Navy for Studs. Signed on 2005-06-01. Completion date: 2005-12-30.
$34,877, same as above.Signed on 2005-06-03. Completion date: 2005-12-30.
$33,915 with Navy for Screws. Signed on 2005-05-12. Completion date: 2005-10-31.
STANKO PRODUCTS INC (RR 12, BOX 10; small business) : $160,160 in 5 contractsfrom 2001 to 2006
Contracts for Miscellaneous Materials Handling Equipment, Industrial Size Reduction Machinery, Earth Moving and Excavating Equipment, Nonferrous Scrap by Navy, Defense Logistics Agency, National Institute of Standards and Technology Signed by year:2000: $0; 2001: $64,625; 2002: $41,653; 2003: $0; 2004: $38,077; 2005: $0; 2006: $15,805.
Biggest contracts:
$41,653 with Navy for Miscellaneous Materials Handling Equipment. Taking place in CA. Signed on 2002-03-07. Completion date: 2002-04-26.
$38,077 with Navy for Industrial Size Reduction Machinery. Signed on 2004-01-09. Completion date: 2004-03-05.
$33,364 with Defense Logistics Agency for Earth Moving and Excavating Equipment. Signed on 2001-06-18. Completion date: 2001-08-11.
$31,261 with Navy for Miscellaneous Materials Handling Equipment. Taking place in CA. Signed on 2001-09-28. Completion date: 2001-11-12.
PENNA ASSN FOR THE BLIND WESTM (911 S MAIN ST)
$84,650 with Defense Logistics Agency for Badges and Insignia. Signed on 2001-07-20. Completion date: 2002-11-30.
RANGER TRAILER AND COACH SALES (125 THEOBOLD AVE; small business)
$68,412 with Army for Trailers. Signed on 2005-09-27. Completion date: 2005-11-28.
KNIGHTS INN (1215 S MAIN ST; small business) : $60,242 in 4 contractsfrom 2003 to 2004
$38,665 with Army for Lodging - Hotel/Motel. Signed on 2003-11-14. Completion date: 2003-12-05.
$36,108, same as above.Signed on 2004-10-22. Completion date: 2004-11-28.
$810, same as above.Signed on 2004-11-15. Completion date: 2004-11-28.
-$15,341, same as above.Signed on 2004-01-07. Completion date: 2003-12-05.
Top industries in this zip code by the number of employees in 2005:
Health Care and Social Assistance: Offices of Physicians (except Mental Health Specialists) (100-249: 1, 50-99: 1, 20-49: 6, 10-19: 16, 5-9: 28, 1-4: 29)
Educational Services: Colleges, Universities, and Professional Schools (500-999: 1, 100-249: 1)
Utilities: Electric Power Distribution (500-999: 1, 10-19: 1)
Accommodation and Food Services: Hotels (except Casino Hotels) and Motels (100-249: 3, 20-49: 3, 10-19: 1, 1-4: 2)
People in group quarters in 2010:
1,280 people in college/university student housing
978 people in state prisons
887 people in nursing facilities/skilled-nursing facilities
489 people in local jails and other municipal confinement facilities
158 people in group homes intended for adults
143 people in other noninstitutional facilities
13 people in emergency and transitional shelters (with sleeping facilities) for people experiencing homelessness
12 people in in-patient hospice facilities
7 people in residential treatment centers for juveniles (non-correctional)
4 people in residential treatment centers for adults
People in group quarters in 2000:
1,196 people in nursing homes
750 people in college dormitories (includes college quarters off campus)
418 people in local jails and other confinement facilities (including police lockups)
203 people in religious group quarters
71 people in homes for the mentally retarded
42 people in other noninstitutional group quarters
31 people in homes for the mentally ill
17 people in other group homes
16 people in short-term care, detention or diagnostic centers for delinquent children
11 people in homes or halfway houses for drug/alcohol abuse
9 people in other nonhousehold living situations
Home Mortgage Disclosure Act Aggregated Statistics For Year 2009 (Based on 12 full and 16 partial tracts)
A) FHA, FSA/RHS & VA Home Purchase Loans
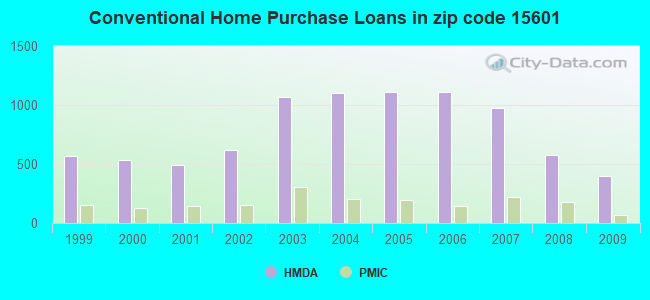
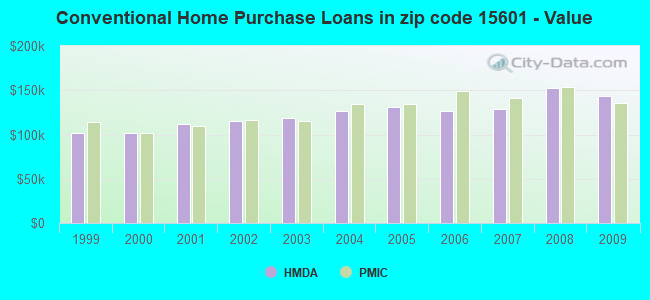
B) Conventional Home Purchase Loans
C) Refinancings
D) Home Improvement Loans
E) Loans on Dwellings For 5+ Families
F) Non-occupant Loans on < 5 Family Dwellings (A B C & D)
G) Loans On Manufactured Home Dwelling (A B C & D)
Number
Average Value
Number
Average Value
Number
Average Value
Number
Average Value
Number
Average Value
Number
Average Value
Number
Average Value
LOANS ORIGINATED
327
$130,114
401
$143,093
1,404
$147,849
263
$47,128
5
$642,668
50
$96,762
16
$51,669
APPLICATIONS APPROVED, NOT ACCEPTED
9
$119,602
40
$145,370
142
$144,584
30
$41,856
0
$0
14
$78,857
4
$55,138
APPLICATIONS DENIED
26
$129,332
48
$116,581
519
$139,434
137
$37,206
1
$2,170,110
36
$72,609
17
$35,485
APPLICATIONS WITHDRAWN
25
$137,491
32
$149,884
292
$152,550
29
$30,245
1
$588,000
16
$117,973
5
$67,562
FILES CLOSED FOR INCOMPLETENESS
6
$91,357
3
$62,747
68
$143,301
11
$68,407
0
$0
0
$0
2
$45,525
Aggregated Statistics For Year 2008 (Based on 12 full and 16 partial tracts)
A) FHA, FSA/RHS & VA Home Purchase Loans
B) Conventional Home Purchase Loans
C) Refinancings
D) Home Improvement Loans
E) Loans on Dwellings For 5+ Families
F) Non-occupant Loans on < 5 Family Dwellings (A B C & D)
G) Loans On Manufactured Home Dwelling (A B C & D)
Number
Average Value
Number
Average Value
Number
Average Value
Number
Average Value
Number
Average Value
Number
Average Value
Number
Average Value
LOANS ORIGINATED
203
$126,316
576
$152,171
791
$118,539
299
$39,283
5
$925,992
83
$92,109
23
$52,469
APPLICATIONS APPROVED, NOT ACCEPTED
12
$114,090
66
$130,960
106
$114,110
31
$42,651
0
$0
7
$49,679
12
$39,248
APPLICATIONS DENIED
26
$104,116
100
$117,947
654
$134,705
217
$47,971
0
$0
42
$100,303
30
$53,493
APPLICATIONS WITHDRAWN
14
$124,424
50
$189,304
191
$135,463
34
$47,669
1
$980,000
18
$113,929
0
$0
FILES CLOSED FOR INCOMPLETENESS
3
$125,503
7
$144,113
82
$122,148
7
$110,626
0
$0
6
$75,243
2
$122,900
Aggregated Statistics For Year 2007 (Based on 12 full and 16 partial tracts)
A) FHA, FSA/RHS & VA Home Purchase Loans
B) Conventional Home Purchase Loans
C) Refinancings
D) Home Improvement Loans
E) Loans on Dwellings For 5+ Families
F) Non-occupant Loans on < 5 Family Dwellings (A B C & D)
G) Loans On Manufactured Home Dwelling (A B C & D)
Number
Average Value
Number
Average Value
Number
Average Value
Number
Average Value
Number
Average Value
Number
Average Value
Number
Average Value
LOANS ORIGINATED
118
$133,770
972
$128,336
1,045
$104,257
454
$38,408
5
$948,800
99
$87,570
27
$38,706
APPLICATIONS APPROVED, NOT ACCEPTED
2
$141,710
95
$114,539
260
$112,854
81
$46,932
0
$0
13
$79,018
10
$60,043
APPLICATIONS DENIED
17
$122,392
139
$98,719
913
$114,366
269
$33,538
1
$520,000
47
$77,229
34
$37,500
APPLICATIONS WITHDRAWN
10
$179,683
75
$116,177
291
$124,145
37
$40,105
2
$414,000
12
$72,989
2
$79,500
FILES CLOSED FOR INCOMPLETENESS
4
$78,368
16
$102,031
92
$136,389
2
$57,000
0
$0
1
$105,000
2
$119,770
Aggregated Statistics For Year 2006 (Based on 12 full and 16 partial tracts)
A) FHA, FSA/RHS & VA Home Purchase Loans
B) Conventional Home Purchase Loans
C) Refinancings
D) Home Improvement Loans
E) Loans on Dwellings For 5+ Families
F) Non-occupant Loans on < 5 Family Dwellings (A B C & D)
G) Loans On Manufactured Home Dwelling (A B C & D)
Number
Average Value
Number
Average Value
Number
Average Value
Number
Average Value
Number
Average Value
Number
Average Value
Number
Average Value
LOANS ORIGINATED
99
$126,078
1,111
$126,342
1,290
$95,493
589
$36,655
7
$947,229
150
$92,523
26
$33,218
APPLICATIONS APPROVED, NOT ACCEPTED
1
$89,000
102
$115,074
287
$97,170
71
$33,753
0
$0
16
$58,571
2
$26,655
APPLICATIONS DENIED
4
$147,568
151
$97,071
1,030
$111,016
266
$33,867
2
$286,000
69
$82,615
49
$28,517
APPLICATIONS WITHDRAWN
12
$108,972
89
$127,471
497
$118,719
43
$55,446
1
$100,000
22
$89,592
9
$74,120
FILES CLOSED FOR INCOMPLETENESS
0
$0
17
$134,289
128
$142,794
9
$92,573
0
$0
4
$65,250
0
$0
Aggregated Statistics For Year 2005 (Based on 12 full and 16 partial tracts)
A) FHA, FSA/RHS & VA Home Purchase Loans
B) Conventional Home Purchase Loans
C) Refinancings
D) Home Improvement Loans
E) Loans on Dwellings For 5+ Families
F) Non-occupant Loans on < 5 Family Dwellings (A B C & D)
G) Loans On Manufactured Home Dwelling (A B C & D)
Number
Average Value
Number
Average Value
Number
Average Value
Number
Average Value
Number
Average Value
Number
Average Value
Number
Average Value
LOANS ORIGINATED
76
$116,337
1,114
$130,617
1,530
$100,116
567
$37,913
5
$141,200
151
$80,145
45
$43,766
APPLICATIONS APPROVED, NOT ACCEPTED
5
$91,980
151
$104,091
285
$94,839
67
$34,296
0
$0
20
$53,734
16
$52,957
APPLICATIONS DENIED
4
$111,342
185
$81,986
1,110
$107,711
303
$25,806
2
$184,000
124
$35,314
60
$36,885
APPLICATIONS WITHDRAWN
2
$93,065
131
$123,166
651
$124,302
86
$127,608
1
$100,000
23
$105,321
2
$43,770
FILES CLOSED FOR INCOMPLETENESS
0
$0
24
$99,660
116
$150,625
7
$26,780
0
$0
0
$0
1
$14,430
Aggregated Statistics For Year 2004 (Based on 12 full and 16 partial tracts)
A) FHA, FSA/RHS & VA Home Purchase Loans
B) Conventional Home Purchase Loans
C) Refinancings
D) Home Improvement Loans
E) Loans on Dwellings For 5+ Families
F) Non-occupant Loans on < 5 Family Dwellings (A B C & D)
G) Loans On Manufactured Home Dwelling (A B C & D)
Number
Average Value
Number
Average Value
Number
Average Value
Number
Average Value
Number
Average Value
Number
Average Value
Number
Average Value
LOANS ORIGINATED
112
$105,168
1,099
$126,073
1,949
$100,695
588
$35,893
3
$118,000
178
$74,668
44
$47,929
APPLICATIONS APPROVED, NOT ACCEPTED
4
$132,750
109
$104,761
345
$105,014
102
$32,774
5
$296,600
28
$42,714
18
$52,784
APPLICATIONS DENIED
16
$129,527
160
$95,264
1,075
$107,417
382
$27,277
1
$270,000
112
$26,770
61
$38,585
APPLICATIONS WITHDRAWN
4
$103,250
94
$126,753
585
$118,311
77
$50,600
2
$486,380
17
$107,492
4
$88,678
FILES CLOSED FOR INCOMPLETENESS
1
$72,000
19
$144,076
261
$133,271
17
$33,346
0
$0
7
$71,000
1
$20,040
Aggregated Statistics For Year 2003 (Based on 12 full and 16 partial tracts)
A) FHA, FSA/RHS & VA Home Purchase Loans
B) Conventional Home Purchase Loans
C) Refinancings
D) Home Improvement Loans
E) Loans on Dwellings For 5+ Families
F) Non-occupant Loans on < 5 Family Dwellings (A B C & D)
Number
Average Value
Number
Average Value
Number
Average Value
Number
Average Value
Number
Average Value
Number
Average Value
LOANS ORIGINATED
110
$107,495
1,069
$119,176
4,026
$106,150
595
$36,476
7
$443,430
173
$64,246
APPLICATIONS APPROVED, NOT ACCEPTED
2
$125,500
136
$111,052
710
$100,483
108
$31,050
0
$0
22
$74,224
APPLICATIONS DENIED
14
$92,994
149
$104,129
1,280
$100,017
276
$26,527
1
$158,000
63
$45,970
APPLICATIONS WITHDRAWN
9
$88,403
107
$114,561
682
$108,916
59
$24,478
0
$0
8
$98,211
FILES CLOSED FOR INCOMPLETENESS
0
$0
25
$105,715
100
$135,395
14
$50,460
0
$0
2
$80,500
Aggregated Statistics For Year 2002 (Based on 8 full and 8 partial tracts)
A) FHA, FSA/RHS & VA Home Purchase Loans
B) Conventional Home Purchase Loans
C) Refinancings
D) Home Improvement Loans
E) Loans on Dwellings For 5+ Families
F) Non-occupant Loans on < 5 Family Dwellings (A B C & D)
Number
Average Value
Number
Average Value
Number
Average Value
Number
Average Value
Number
Average Value
Number
Average Value
LOANS ORIGINATED
69
$101,590
620
$115,018
1,542
$103,269
238
$30,549
6
$328,928
85
$62,649
APPLICATIONS APPROVED, NOT ACCEPTED
5
$72,348
56
$92,272
311
$90,410
65
$38,763
0
$0
18
$68,527
APPLICATIONS DENIED
3
$58,667
69
$64,254
636
$112,351
150
$21,453
0
$0
19
$59,908
APPLICATIONS WITHDRAWN
2
$67,435
64
$121,737
377
$95,320
28
$18,598
0
$0
10
$60,698
FILES CLOSED FOR INCOMPLETENESS
4
$76,355
37
$88,343
116
$157,372
6
$53,652
0
$0
7
$57,714
Aggregated Statistics For Year 2001 (Based on 8 full and 8 partial tracts)
A) FHA, FSA/RHS & VA Home Purchase Loans
B) Conventional Home Purchase Loans
C) Refinancings
D) Home Improvement Loans
E) Loans on Dwellings For 5+ Families
F) Non-occupant Loans on < 5 Family Dwellings (A B C & D)
Number
Average Value
Number
Average Value
Number
Average Value
Number
Average Value
Number
Average Value
Number
Average Value
LOANS ORIGINATED
92
$88,244
491
$111,339
1,185
$90,043
316
$28,796
2
$516,000
62
$58,100
APPLICATIONS APPROVED, NOT ACCEPTED
5
$59,940
62
$80,005
237
$74,675
37
$25,718
0
$0
14
$58,754
APPLICATIONS DENIED
7
$70,087
134
$57,150
612
$77,343
141
$20,101
0
$0
35
$54,876
APPLICATIONS WITHDRAWN
8
$83,529
41
$81,727
340
$87,470
37
$30,105
0
$0
14
$67,764
FILES CLOSED FOR INCOMPLETENESS
1
$104,980
4
$120,065
50
$118,103
8
$75,195
0
$0
3
$33,093
Aggregated Statistics For Year 2000 (Based on 8 full and 8 partial tracts)
A) FHA, FSA/RHS & VA Home Purchase Loans
B) Conventional Home Purchase Loans
C) Refinancings
D) Home Improvement Loans
E) Loans on Dwellings For 5+ Families
F) Non-occupant Loans on < 5 Family Dwellings (A B C & D)
Number
Average Value
Number
Average Value
Number
Average Value
Number
Average Value
Number
Average Value
Number
Average Value
LOANS ORIGINATED
81
$74,637
535
$101,937
467
$65,599
286
$24,509
5
$353,920
53
$44,683
APPLICATIONS APPROVED, NOT ACCEPTED
8
$66,035
63
$79,883
161
$68,156
53
$22,361
0
$0
8
$80,465
APPLICATIONS DENIED
4
$63,250
155
$46,996
320
$71,462
140
$19,272
0
$0
16
$41,688
APPLICATIONS WITHDRAWN
6
$73,383
57
$91,259
145
$75,377
28
$28,326
0
$0
6
$52,550
FILES CLOSED FOR INCOMPLETENESS
2
$56,500
9
$57,801
41
$75,032
2
$8,005
0
$0
1
$65,000
Aggregated Statistics For Year 1999 (Based on 8 full and 7 partial tracts)
A) FHA, FSA/RHS & VA Home Purchase Loans
B) Conventional Home Purchase Loans
C) Refinancings
D) Home Improvement Loans
E) Loans on Dwellings For 5+ Families
F) Non-occupant Loans on < 5 Family Dwellings (A B C & D)
2004 - 2018 National Fire Incident Reporting System (NFIRS) incidents
According to the data from the years 2004 - 2018 the average number of fire incidents per year is 452. The highest number of reported fires - 789 took place in 2008, and the least - 43 in 2013. The data has a declining trend.
When looking into fire subcategories, the most incidents belonged to: Structure Fires (70.1%), and Outside Fires (12.2%).
Fire incident types reported to NFIRS in Zip Code 15601


 Nearest zip codes: 15633, 15635, 15662, 15634, 15624, 15644.
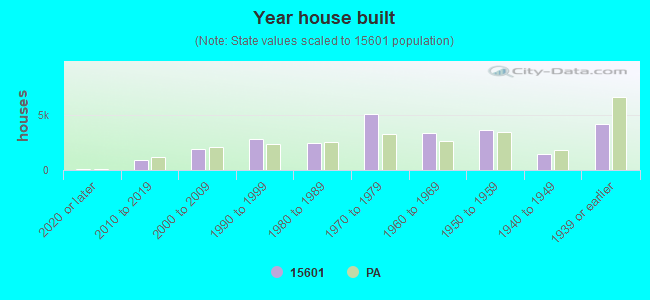


 According to the data from the years 2004 - 2018 the average number of fire incidents per year is 452. The highest number of reported fires - 789 took place in 2008, and the least - 43 in 2013. The data has a declining trend.
 When looking into fire subcategories, the most incidents belonged to: Structure Fires (70.1%), and Outside Fires (12.2%).