Estimated zip code population in 2022: 19,855 Zip code population in 2010: 21,226 Zip code population in 2000: 22,935
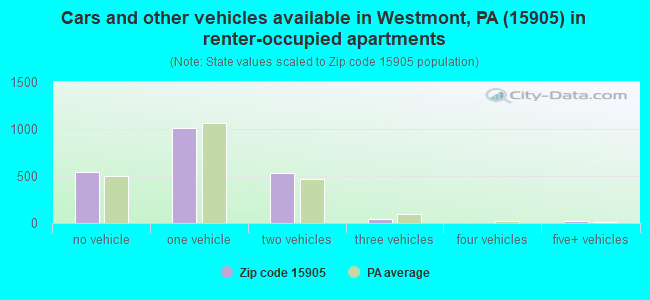
Houses and condos: 10,090 Renter-occupied apartments: 2,150
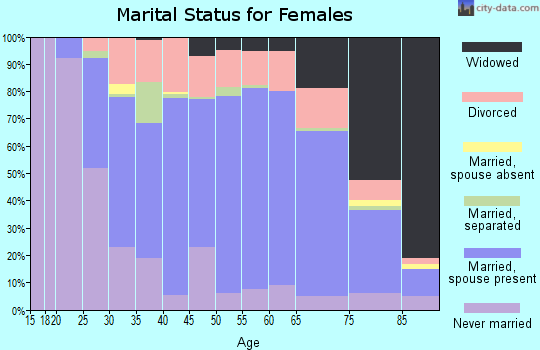
% of renters here:
25%
State:
31%
March 2022 cost of living index in zip code 15905: 89.5 (less than average, U.S. average is 100)
Land area: 35.8 sq. mi. Water area: 0.3 sq. mi.
Population density: 554 people per square mile
(low).
OSM Map
General Map
Google Map
MSN Map
OSM Map
General Map
Google Map
MSN Map
OSM Map
General Map
Google Map
MSN Map
OSM Map
General Map
Google Map
MSN Map
Please wait while loading the map...
Real estate property taxes paid for housing units in 2022:
This zip code:
1.8% ($2,248)
Pennsylvania:
1.3% ($3,094)
Median real estate property taxes paid for housing units with mortgages in 2022: $2,464 (1.6%) Median real estate property taxes paid for housing units with no mortgage in 2022: $1,962 (1.9%)
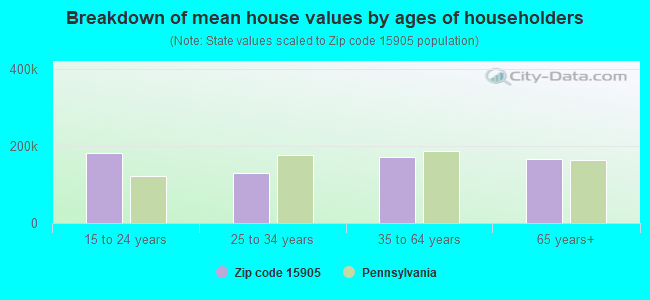
Estimated median house/condo value in 2022: $126,549
15905:
$126,549
Pennsylvania:
$245,500
According to our research of Pennsylvania and other state lists, there were 31 registered sex offenders living in 15905 zip code as of April 27, 2024. The ratio of all residents to sex offenders in zip code 15905 is 665 to 1. The ratio of registered sex offenders to all residents in this zip code is near the state average.
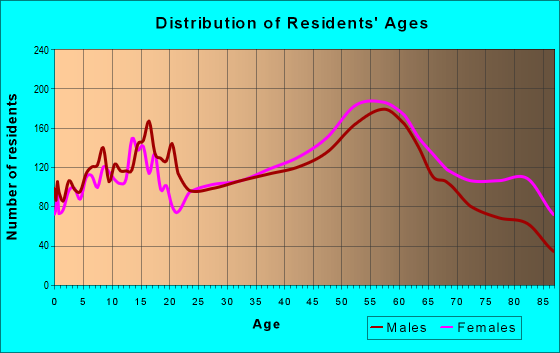
Median resident age:
This zip code:
46.9 years
Pennsylvania median age:
40.9 years
Average household size:
This zip code:
2.2 people
Pennsylvania:
2.4 people
Averages for the 2020 tax year for zip code 15905, filed in 2021:
Average Adjusted Gross Income (AGI) in 2020: $64,074 (Individual Income Tax Returns)
Here:
$64,074
State:
$75,707
Salary/wage: $53,792 (reported on 75.1% of returns)
Here:
$53,792
State:
$62,806
(% of AGI for various income ranges: 948.0% for AGIs below $25k, 3111.1% for AGIs $25k-50k, 5760.2% for AGIs $50k-75k, 8176.5% for AGIs $75k-100k, 14705.6% for AGIs $100k-200k, 71754.5% for AGIs over 200k)
Taxable interest for individuals: $1,501 (reported on 39.3% of returns)
This zip code:
$1,501
Pennsylvania:
$1,633
(% of AGI for various income ranges: 34.2% for AGIs below $25k, 44.9% for AGIs $25k-50k, 58.9% for AGIs $50k-75k, 77.2% for AGIs $75k-100k, 144.3% for AGIs $100k-200k, 1712.7% for AGIs over 200k)
Ordinary dividends: $5,611 (reported on 24.4% of returns)
Here:
$5,611
State:
$7,382
(% of AGI for various income ranges: 37.0% for AGIs below $25k, 50.0% for AGIs $25k-50k, 108.1% for AGIs $50k-75k, 136.2% for AGIs $75k-100k, 341.1% for AGIs $100k-200k, 6296.4% for AGIs over 200k)
Net capital gain/loss in AGI: +$10,526 (reported on 18.4% of returns)
Here:
+$10,526
State:
+$23,522
(% of AGI for various income ranges: 13.8% for AGIs below $25k, 39.4% for AGIs $25k-50k, 82.6% for AGIs $50k-75k, 151.4% for AGIs $75k-100k, 522.4% for AGIs $100k-200k, 10870.0% for AGIs over 200k)
Profit/loss from business: +$16,352 (reported on 11.1% of returns)
Here:
+$16,352
State:
+$16,274
(% of AGI for various income ranges: 49.8% for AGIs below $25k, 91.5% for AGIs $25k-50k, 153.7% for AGIs $50k-75k, 231.7% for AGIs $75k-100k, 432.3% for AGIs $100k-200k, 7616.4% for AGIs over 200k)
Taxable individual retirement arrangement distribution: $17,766 (reported on 17.0% of returns)
15905:
$17,766
Pennsylvania:
$18,583
(% of AGI for various income ranges: 135.3% for AGIs below $25k, 169.9% for AGIs $25k-50k, 321.3% for AGIs $50k-75k, 560.8% for AGIs $75k-100k, 1151.4% for AGIs $100k-200k, 6246.4% for AGIs over 200k)
Self-employed (Keogh) retirement plans: $17,075 (reported on 0.4% of returns)
15905:
$17,075
Pennsylvania:
$25,407
(% of AGI for various income ranges: 81.3% for AGIs $100k-200k)
Total itemized deductions: $35,717 (reported on 3.6% of returns)
Here:
$35,717
State:
$34,850
(% of AGI for various income ranges: 36.1% for AGIs below $25k, 60.5% for AGIs $25k-50k, 137.7% for AGIs $50k-75k, 186.1% for AGIs $75k-100k, 390.1% for AGIs $100k-200k, 4387.3% for AGIs over 200k)
Charity contributions: $13,420 (reported on 3.0% of returns)
Here:
$13,420
State:
$12,392
(% of AGI for various income ranges: 6.8% for AGIs $25k-50k, 30.7% for AGIs $50k-75k, 45.5% for AGIs $75k-100k, 135.2% for AGIs $100k-200k, 1913.6% for AGIs over 200k)
Taxes paid: $7,266 (reported on 3.5% of returns)
15905:
$7,266
State:
$8,200
(% of AGI for various income ranges: 2.4% for AGIs below $25k, 8.5% for AGIs $25k-50k, 27.2% for AGIs $50k-75k, 39.4% for AGIs $75k-100k, 99.8% for AGIs $100k-200k, 832.7% for AGIs over 200k)
Earned income credit: $2,106 (reported on 11.2% of returns)
Here:
$2,106
State:
$2,100
(% of AGI for various income ranges: 63.1% for AGIs below $25k, 51.2% for AGIs $25k-50k)
Percentage of individuals using paid preparers for their 2020 taxes: 92.2%
Here:
92%
State:
92%
(% for various income ranges: 90.3% for AGIs below $25k, 93.3% for AGIs $25k-50k, 94.0% for AGIs $50k-75k, 93.9% for AGIs $75k-100k, 91.9% for AGIs $100k-200k, 91.7% for AGIs over 200k)
Averages for the 2012 tax year for zip code 15905, filed in 2013:
Average Adjusted Gross Income (AGI) in 2012: $59,916 (Individual Income Tax Returns)
Here:
$59,916
State:
$61,346
Salary/wage: $50,312 (reported on 78.6% of returns)
Here:
$50,312
State:
$51,902
(% of AGI for various income ranges: 66.0% for AGIs below $25k, 74.0% for AGIs $25k-50k, 74.6% for AGIs $50k-75k, 73.0% for AGIs $75k-100k, 72.8% for AGIs $100k-200k, 48.4% for AGIs over 200k)
Taxable interest for individuals: $1,594 (reported on 46.6% of returns)
This zip code:
$1,594
Pennsylvania:
$1,588
(% of AGI for various income ranges: 2.5% for AGIs below $25k, 1.2% for AGIs $25k-50k, 0.9% for AGIs $50k-75k, 1.0% for AGIs $75k-100k, 0.8% for AGIs $100k-200k, 1.6% for AGIs over 200k)
Ordinary dividends: $5,739 (reported on 28.1% of returns)
Here:
$5,739
State:
$5,827
(% of AGI for various income ranges: 2.6% for AGIs below $25k, 1.4% for AGIs $25k-50k, 1.2% for AGIs $50k-75k, 1.6% for AGIs $75k-100k, 1.9% for AGIs $100k-200k, 5.4% for AGIs over 200k)
Net capital gain/loss in AGI: +$9,435 (reported on 17.7% of returns)
Here:
+$9,435
State:
+$14,495
(% of AGI for various income ranges: 0.2% for AGIs $25k-50k, 0.4% for AGIs $50k-75k, 0.3% for AGIs $75k-100k, 1.2% for AGIs $100k-200k, 8.7% for AGIs over 200k)
Profit/loss from business: +$13,705 (reported on 12.1% of returns)
Here:
+$13,705
State:
+$16,268
(% of AGI for various income ranges: 3.3% for AGIs below $25k, 2.2% for AGIs $25k-50k, 2.5% for AGIs $50k-75k, 2.2% for AGIs $75k-100k, 4.1% for AGIs $100k-200k, 2.2% for AGIs over 200k)
Taxable individual retirement arrangement distribution: $13,686 (reported on 15.1% of returns)
15905:
$13,686
Pennsylvania:
$14,550
(% of AGI for various income ranges: 5.2% for AGIs below $25k, 3.5% for AGIs $25k-50k, 3.0% for AGIs $50k-75k, 4.1% for AGIs $75k-100k, 3.5% for AGIs $100k-200k, 2.8% for AGIs over 200k)
Self-employment retirement plans: $13,400 (reported on 0.8% of returns)
15905:
$13,400
Pennsylvania:
$20,922
(% of AGI for various income ranges: 0.3% for AGIs below $25k, 0.3% for AGIs $100k-200k, 0.3% for AGIs over 200k)
Total itemized deductions: $22,849 (16% of AGI, reported on 23.2% of returns)
Here:
$22,849
State:
$23,538
Here:
15.9% of AGI
State:
18.4% of AGI
(% of AGI for various income ranges: 6.1% for AGIs below $25k, 6.3% for AGIs $25k-50k, 6.8% for AGIs $50k-75k, 8.6% for AGIs $75k-100k, 11.3% for AGIs $100k-200k, 10.1% for AGIs over 200k)
Charity contributions: $4,376 (reported on 19.4% of returns)
Here:
$4,376
State:
$4,025
(% of AGI for various income ranges: 0.5% for AGIs below $25k, 0.8% for AGIs $25k-50k, 0.9% for AGIs $50k-75k, 1.2% for AGIs $75k-100k, 2.2% for AGIs $100k-200k, 1.7% for AGIs over 200k)
Taxes paid: $9,600 (reported on 23.1% of returns)
15905:
$9,600
State:
$9,982
(% of AGI for various income ranges: 1.5% for AGIs below $25k, 1.8% for AGIs $25k-50k, 2.4% for AGIs $50k-75k, 3.1% for AGIs $75k-100k, 5.2% for AGIs $100k-200k, 5.0% for AGIs over 200k)
Earned income credit: $1,893 (reported on 11.9% of returns)
Here:
$1,893
State:
$2,106
(% of AGI for various income ranges: 3.6% for AGIs below $25k, 0.8% for AGIs $25k-50k)
Percentage of individuals using paid preparers for their 2012 taxes: 53.4%
Here:
53%
State:
53%
(% for various income ranges: 47.4% for AGIs below $25k, 49.6% for AGIs $25k-50k, 58.0% for AGIs $50k-75k, 58.6% for AGIs $75k-100k, 64.4% for AGIs $100k-200k, 87.1% for AGIs over 200k)
Averages for the 2004 tax year for zip code 15905, filed in 2005:
Average Adjusted Gross Income (AGI) in 2004: $46,321 (Individual Income Tax Returns)
Here:
$46,321
State:
$48,049
Salary/wage: $43,231 (reported on 77.5% of returns)
Here:
$43,231
State:
$42,646
(% of AGI for various income ranges: 599.1% for AGIs below $10k, 60.4% for AGIs $10k-25k, 75.3% for AGIs $25k-50k, 78.6% for AGIs $50k-75k, 77.0% for AGIs $75k-100k, 65.2% for AGIs over 100k)
Taxable interest for individuals: $2,113 (reported on 59.6% of returns)
This zip code:
$2,113
Pennsylvania:
$1,657
(% of AGI for various income ranges: 59.4% for AGIs below $10k, 4.8% for AGIs $10k-25k, 2.6% for AGIs $25k-50k, 1.9% for AGIs $50k-75k, 2.2% for AGIs $75k-100k, 2.5% for AGIs over 100k)
Taxable dividends: $3,819 (reported on 35.3% of returns)
Here:
$3,819
State:
$3,566
(% of AGI for various income ranges: 38.3% for AGIs below $10k, 2.7% for AGIs $10k-25k, 1.4% for AGIs $25k-50k, 1.4% for AGIs $50k-75k, 1.9% for AGIs $75k-100k, 4.6% for AGIs over 100k)
Net capital gain/loss: +$4,073 (reported on 24.6% of returns)
Here:
+$4,073
State:
+$9,716
(% of AGI for various income ranges: 8.7% for AGIs below $10k, 0.2% for AGIs $10k-25k, 0.8% for AGIs $25k-50k, 1.0% for AGIs $50k-75k, 1.2% for AGIs $75k-100k, 4.1% for AGIs over 100k)
Profit/loss from business: +$13,218 (reported on 13.6% of returns)
Here:
+$13,218
State:
+$14,267
(% of AGI for various income ranges: -12.1% for AGIs below $10k, 3.3% for AGIs $10k-25k, 2.7% for AGIs $25k-50k, 2.4% for AGIs $50k-75k, 3.5% for AGIs $75k-100k, 5.6% for AGIs over 100k)
IRA payment deduction: $2,912 (reported on 4.1% of returns)
15905:
$2,912
Pennsylvania:
$2,903
(% of AGI for various income ranges: 1.7% for AGIs below $10k, 0.4% for AGIs $10k-25k, 0.5% for AGIs $25k-50k, 0.3% for AGIs $50k-75k, 0.2% for AGIs $75k-100k, 0.1% for AGIs over 100k)
Self-employed pension: $12,454 (reported on 1.0% of returns)
Here:
$12,454
Pennsylvania:
$14,674
(% of AGI for various income ranges: 0.2% for AGIs $50k-75k, 0.2% for AGIs $75k-100k, 0.5% for AGIs over 100k)
Total itemized deductions: $17,780 (17% of AGI, reported on 25.0% of returns)
Here:
$17,780
State:
$18,804
Here:
17.1% of AGI
State:
19.5% of AGI
(% of AGI for various income ranges: 64.1% for AGIs below $10k, 7.5% for AGIs $10k-25k, 6.8% for AGIs $25k-50k, 8.5% for AGIs $50k-75k, 10.8% for AGIs $75k-100k, 11.1% for AGIs over 100k)
Charity contributions deductions: $4,048 (4% of AGI, reported on 22.7% of returns)
Here:
$4,048
State:
$3,337
Here:
3.7% of AGI
State:
3.3% of AGI
(% of AGI for various income ranges: 4.5% for AGIs below $10k, 0.9% for AGIs $10k-25k, 1.0% for AGIs $25k-50k, 1.4% for AGIs $50k-75k, 2.0% for AGIs $75k-100k, 3.0% for AGIs over 100k)
Total tax: $8,080 (reported on 74.8% of returns)
15905:
$8,080
State:
$8,008
(% of AGI for various income ranges: 12.5% for AGIs below $10k, 4.0% for AGIs $10k-25k, 7.0% for AGIs $25k-50k, 8.8% for AGIs $50k-75k, 10.9% for AGIs $75k-100k, 21.0% for AGIs over 100k)
Earned income credit: $1,566 (reported on 9.7% of returns)
Here:
$1,566
State:
$1,643
Percentage of individuals using paid preparers for their 2004 taxes: 54.4%
Here:
54%
State:
56%
(% for various income ranges: 50.9% for AGIs below $10k, 50.7% for AGIs $10k-25k, 53.2% for AGIs $25k-50k, 54.3% for AGIs $50k-75k, 58.5% for AGIs $75k-100k, 74.3% for AGIs over 100k)
Likely homosexual households (counted as self-reported same-sex unmarried-partner households)
Lesbian couples: 0.3% of all households
Gay men: 0.0% of all households
Household received Food Stamps/SNAP in the past 12 months: 1,232 Household did not receive Food Stamps/SNAP in the past 12 months: 7,544
Women who had a birth in the past 12 months: 147 (97 now married, 48 unmarried) Women who did not have a birth in the past 12 months: 3,976 (1,812 now married, 2,155 unmarried)
Housing units in zip code 15905 with a mortgage: 3,404 (361 second mortgage, 2 home equity loan, 293 both second mortgage and home equity loan) Houses without a mortgage: 394
Median monthly owner costs for units with a mortgage: $1,162 Median monthly owner costs for units without a mortgage: $571
Residents with income below the poverty level in 2022:
This zip code:
12.0%
Whole state:
11.8%
Residents with income below 50% of the poverty level in 2022:
This zip code:
6.6%
Whole state:
6.1%
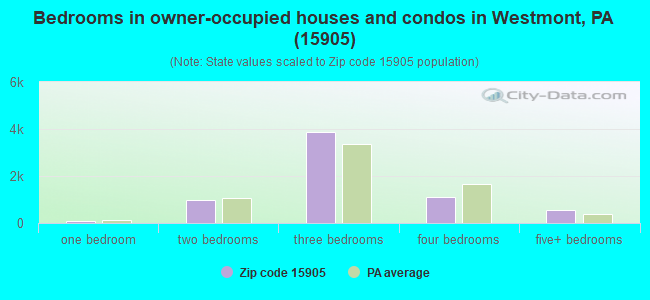
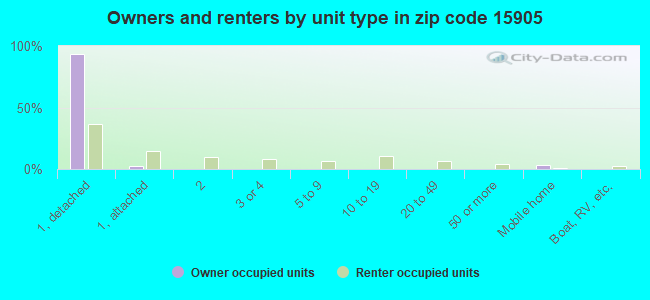
Median number of rooms in houses and condos:
Here:
7.0
State:
6.8
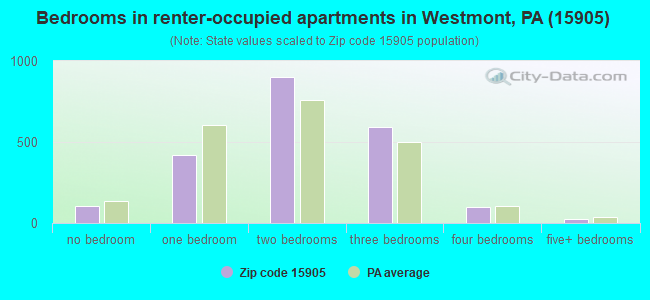
Median number of rooms in apartments:
Here:
5.0
State:
4.3
Notable locations in this zip code not listed on our city pages
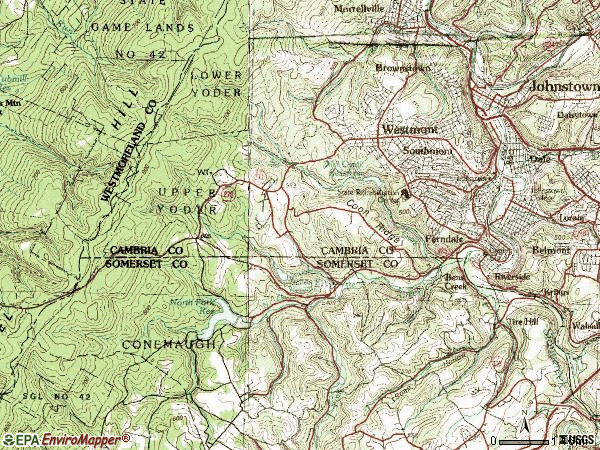
Notable locations in zip code 15905: Johnstown Municipal Golf Course (A), North Fork Country Club (B), Sunnehanna Country Club (C), Mishler (D), Riverside Volunteer Fire Department (E), Southmont Volunteer Fire Company (F), Westwood Volunteer Fire Company (G), Menoher Heights Volunteer Fire Company (H), West Hills Regional Fire Department Station 1 (I), Conemaugh Township Volunteer Fire Department (J), Ferndale Volunteer Fire Company (K), Upper Yoder Volunteer Fire Company (L), Ideal Volunteer Fire Company (M). Display/hide their locations on the map
Churches in zip code 15905 include: Berkley Hills Church (A), Christ Church (B), Faith Chapel (C), Stahl Church (D). Display/hide their locations on the map
Cemeteries: Berkley Hills Cemetery (1), Saint Casmirs Cemetery (2), Saint Francis Cemetery (3), Grandview Cemetery (4). Display/hide their locations on the map
Streams, rivers, and creeks: O'Connor Run (A), Mill Creek (B), Gray Run (C), Dalton Run (D), Cherry Run (E), Cheney Run (F), Riffle Run (G), Bens Creek (H), Allwine Creek (I). Display/hide their locations on the map
2,645 married couples with children.
836 single-parent households (227 men, 609 women).
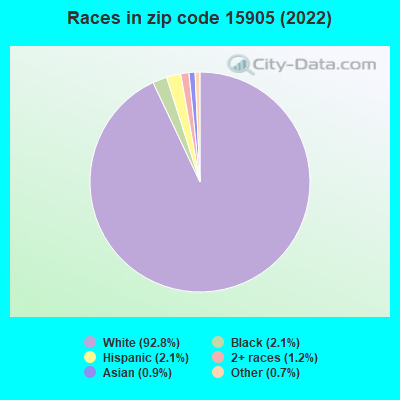
97.1% of residents of 15905 zip code speak English at home.
1.3% of residents speak Spanish at home (70% very well, 28% well, 2% not well).
0.8% of residents speak other Indo-European language at home (85% very well, 15% well).
0.5% of residents speak Asian or Pacific Island language at home (70% very well, 30% well).
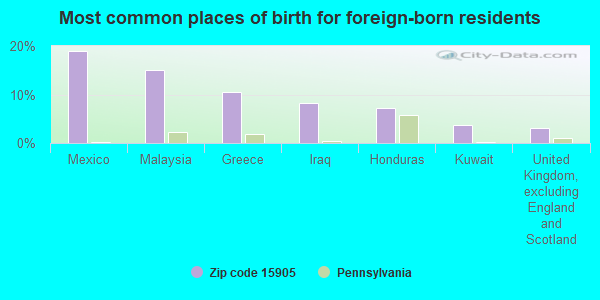
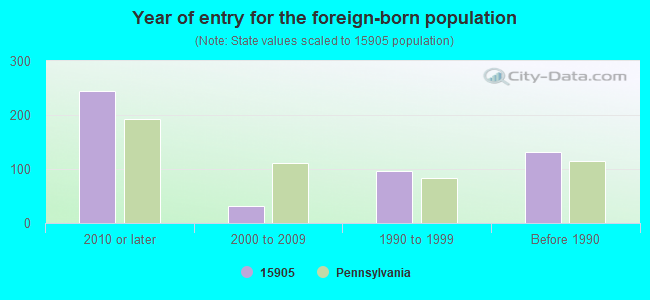
Foreign born population: 429 (2.2%) (58.9% of them are naturalized citizens)
Facilities with environmental interests located in this zip code:
BISHOP MCCORT HIGH SCH (25 OSBORNE STREET in JOHNSTOWN, PA)
AIR MINOR (AIRS/AFS) STATE MASTER (Pennsylvania database) - AFS-25-0969456-1, AIR PROGRAM Business SIC classification: ELEMENTARY AND SECONDARY SCHOOLS Organizations: DIOCESE OF ALTOONA-JOHNSTOWN (OWNER/OPERATOR)
Alternative names: BISHOP-MC CORT HIGH SCHOOL
A. K. AUTO REPAIR (1513 TIRE HILL ROAD in JOHNSTOWN, PA)
AIR MINOR (AIRS/AFS)
AMOCO OIL CO (PA RTE 403 N in JOHNSTOWN, PA)
Conditionally Exempt Small Quantity Generators, less than 100 kg/month of hazardous waste (Resource Conservation and Recovery Act (tracking hazardous waste)) - notification Organizations: OPERNAME (CONTACT/OPERATOR)
BAUMGARDNER CO (RD 3 NEIL ST in JOHNSTOWN, PA)
USED OIL PROGRAM (Resource Conservation and Recovery Act (tracking hazardous waste)) Organizations: OPERNAME (CONTACT/OPERATOR)
, BAUMGARDNER, ELMER (CONTACT/OWNER)
BENSHOFF PRINTING COMPANY INCORPORATED (46 VALLEY PIKE in JOHNSTOWN, PA)
Conditionally Exempt Small Quantity Generators, less than 100 kg/month of hazardous waste (Resource Conservation and Recovery Act (tracking hazardous waste)) - notification Business NAICS classification: MANIFOLD BUSINESS FORMS PRINTING.; BOOKS PRINTING.; OTHER COMMERCIAL PRINTING. Organizations: OPERNAME (CONTACT/OPERATOR)
, BENSHOFF PRINTING CO INC (CONTACT/OWNER)
BILLS AMOCO (680 GOUCHER ST in JOHNSTOWN, PA)
Small Quantity Generators, between 100 kg and 1000 kg of hazardous waste/month (Resource Conservation and Recovery Act (tracking hazardous waste)) - notification Organizations: WILLIAM MCVICKER (CONTACT/OWNER)
Housing units lacking complete plumbing facilities: 3.7% Housing units lacking complete kitchen facilities: 6.4%
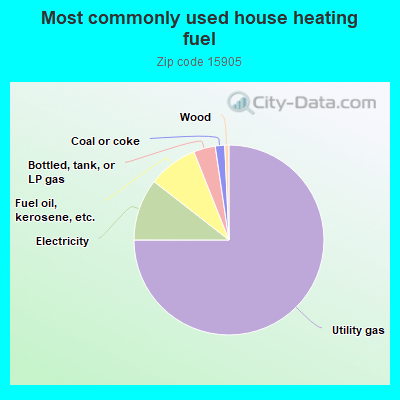
74.7%Utility gas
10.5%Electricity
8.4%Fuel oil, kerosene, etc.
3.7%Bottled, tank, or LP gas
1.6%Coal or coke
0.7%Wood
Population in 1990: 22,509. Population change in the 1990s: +426 (+1.9%).
Place of birth for U.S.-born residents:
This state: 16,418
Northeast: 594
Midwest: 672
South: 1,106
West: 482
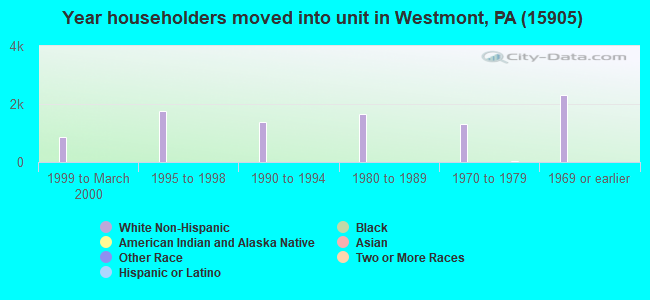
72% of the 15905 zip code residents lived in the same house 5 years ago. Out of people who lived in different houses, 63% lived in this county. Out of people who lived in different counties, 50% lived in Pennsylvania.
91% of the 15905 zip code residents lived in the same house 1 year ago. Out of people who lived in different houses, 58% moved from this county. Out of people who lived in different houses, 14% moved from different county within same state. Out of people who lived in different houses, 21% moved from different state. Out of people who lived in different houses, 8% moved from abroad.
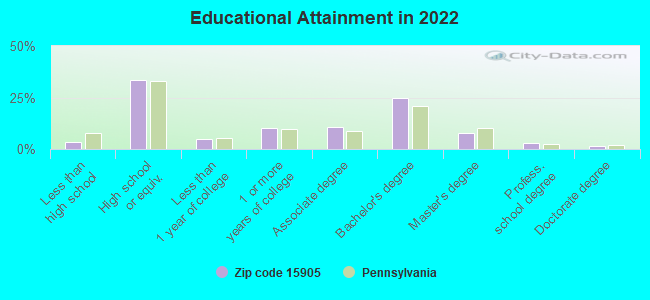
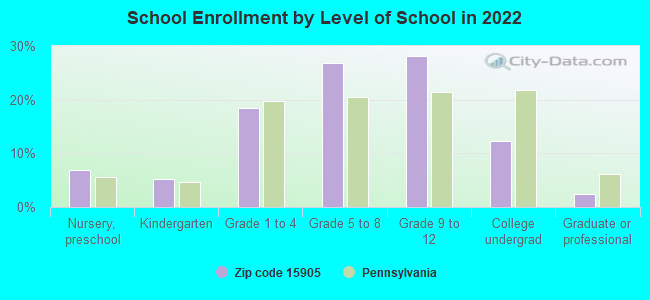
Private vs. public school enrollment:
Students in private schools in grades 1 to 8 (elementary and middle school): 279
Here:
16.3%
Pennsylvania:
15.7%
Students in private schools in grades 9 to 12 (high school): 117
Here:
11.1%
Pennsylvania:
13.4%
Students in private undergraduate colleges: 79
Here:
17.0%
Pennsylvania:
39.8%
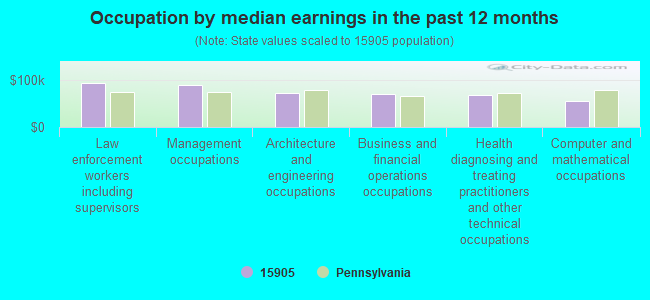
Occupation by median earnings in the past 12 months ($)
92,995Law enforcement workers including supervisors
89,407Management occupations
71,272Architecture and engineering occupations
69,217Business and financial operations occupations
67,344Health diagnosing and treating practitioners and other technical occupations
54,538Computer and mathematical occupations
Companies with federal contracts located in this zip code:
HIRAM G ANDREWS CENTER (727 GOUCHER STREET in JOHNSTOWN, PA; small business)
$12,000 with Army for Maintenance, Repair and Rebuilding of Equipment -- Miscellaneous. Signed on 2003-04-08. Completion date: 2003-05-09.
STANTON CLEANING SERVICE (184 SELL in JOHNSTOWN, PA; small business) : $8,280 in 4 contractsin 2005
$4,560 with Army for Custodial Janitorial Services. Signed on 2005-11-20. Completion date: 2006-09-30.
$3,720, same as above.Signed on 2005-11-20. Completion date: 2006-09-30.
$0, same as above.Signed on 2005-11-20. Completion date: 2006-09-30.
$0, same as above.Signed on 2005-11-20. Completion date: 2006-09-30.
C R BIRD INDUSTRIAL SALES (100 STATION STREET in JOHNSTOWN, PA; small business) : $7,446 in 3 contractsfrom 2004 to 2005
$3,637 with Army for Power and Hand Pumps. Signed on 2005-05-17. Completion date: 2005-07-01.
$3,479, same as above.Signed on 2004-10-25. Completion date: 2004-12-17.
$330, same as above.Signed on 2005-06-01. Completion date: 2005-07-01.
Top industries in this zip code by the number of employees in 2005:
Health Care and Social Assistance: General Medical and Surgical Hospitals (over 1000 employees: 1 establishment)
Information: Cable and Other Program Distribution (500-999: 1, 1-4: 1)
Administrative and Support and Waste Management and Remediation Services: Temporary Help Services (500-999: 1)
Health Care and Social Assistance: Offices of Physicians (except Mental Health Specialists) (20-49: 9, 10-19: 3, 5-9: 13, 1-4: 34)
2003 - 2018 National Fire Incident Reporting System (NFIRS) incidents
Based on the data from the years 2003 - 2018 the average number of fire incidents per year is 61. The highest number of fire incidents - 98 took place in 2016, and the least - 0 in 2006. The data has an increasing trend.
When looking into fire subcategories, the most incidents belonged to: Structure Fires (65.8%), and Outside Fires (14.8%).
Fire incident types reported to NFIRS in Zip Code 15905
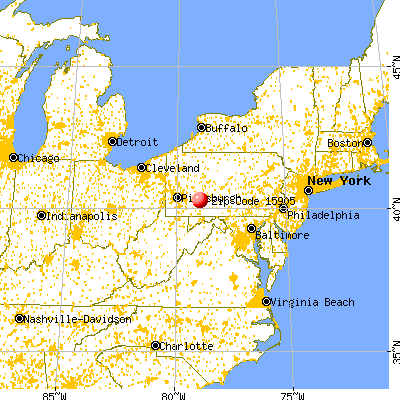


 Nearest zip codes: 15901, 15928, 15935, 15937, 15906, 15902.


 Based on the data from the years 2003 - 2018 the average number of fire incidents per year is 61. The highest number of fire incidents - 98 took place in 2016, and the least - 0 in 2006. The data has an increasing trend.
 When looking into fire subcategories, the most incidents belonged to: Structure Fires (65.8%), and Outside Fires (14.8%).