Estimated zip code population in 2022: 2,072 Zip code population in 2010: 1,974 Zip code population in 2000: 1,786
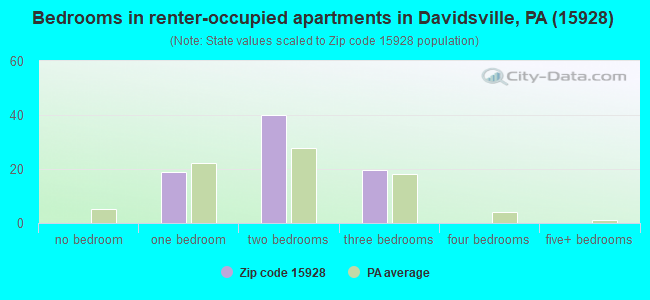
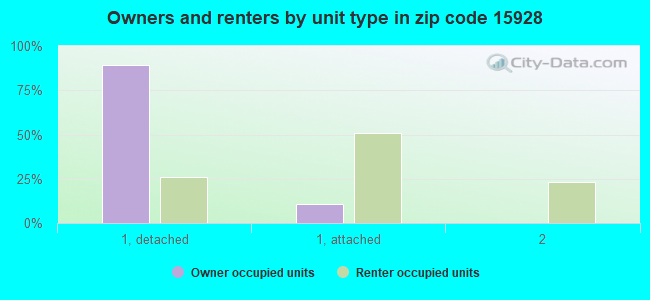
Houses and condos: 975 Renter-occupied apartments: 78
% of renters here:
8%
State:
31%
March 2022 cost of living index in zip code 15928: 91.4 (less than average, U.S. average is 100)
Land area: 6.2 sq. mi. Water area: 0.0 sq. mi.
Population density: 332 people per square mile
(very low).
OSM Map
General Map
Google Map
MSN Map
OSM Map
General Map
Google Map
MSN Map
OSM Map
General Map
Google Map
MSN Map
OSM Map
General Map
Google Map
MSN Map
Please wait while loading the map...
Real estate property taxes paid for housing units in 2022:
This zip code:
1.3% ($2,918)
Pennsylvania:
1.3% ($3,094)
Median real estate property taxes paid for housing units with mortgages in 2022: $3,028 (1.3%) Median real estate property taxes paid for housing units with no mortgage in 2022: $2,573 (1.2%)
Business Search- 14 Million verified businesses
Males: 1,006
(48.6%)
Females: 1,065
(51.4%)
For population 25 years and over in 15928:
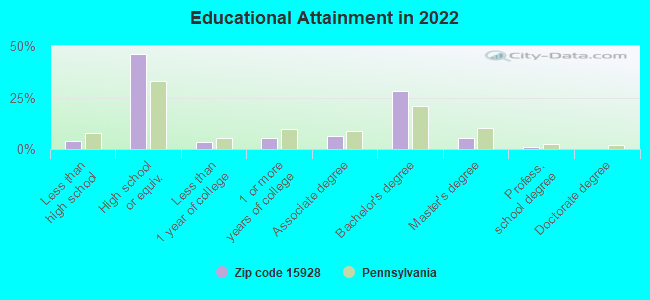
High school or higher: 95.5%
Bachelor's degree or higher: 34.2%
Graduate or professional degree: 6.4%
Mean travel time to work (commute): 19.5 minutes
For population 15 years and over in 15928:
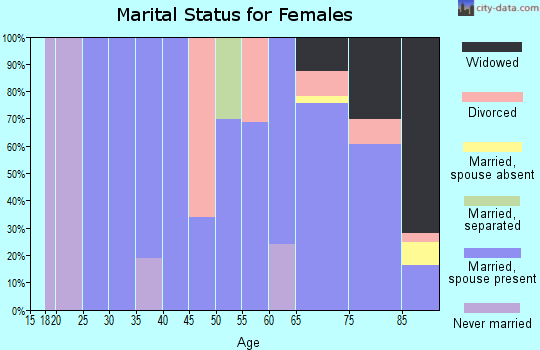
Never married: 16.0%
Now married: 63.6%
Separated: 0.6%
Widowed: 15.8%
Divorced: 3.9%
Zip code 15928 compared to state average:
Unemployed percentage significantly below state average.
Black race population percentage significantly below state average.
Hispanic race population percentage significantly below state average.
Median age significantly above state average.
Foreign-born population percentage significantly below state average.
Renting percentage significantly below state average.
Length of stay since moving in significantly above state average.
Number of college students significantly below state average.
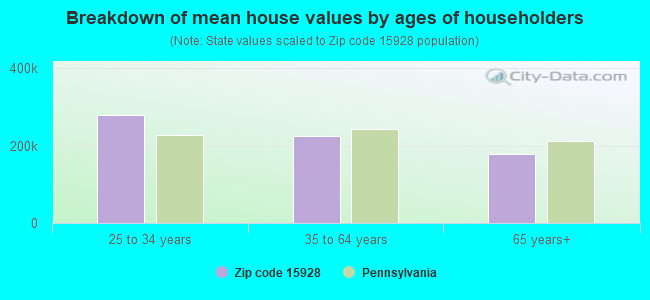
Estimated median house/condo value in 2022: $223,251
15928:
$223,251
Pennsylvania:
$245,500
According to our research of Pennsylvania and other state lists, there was 1 registered sex offender living in 15928 zip code as of April 27, 2024. The ratio of all residents to sex offenders in zip code 15928 is 2,018 to 1. The ratio of registered sex offenders to all residents in this zip code is much lower than the state average.
Median resident age:
This zip code:
60.3 years
Pennsylvania median age:
40.9 years
Average household size:
This zip code:
2.1 people
Pennsylvania:
2.4 people
Averages for the 2020 tax year for zip code 15928, filed in 2021:
Average Adjusted Gross Income (AGI) in 2020: $66,893 (Individual Income Tax Returns)
Here:
$66,893
State:
$75,707
Salary/wage: $58,654 (reported on 63.0% of returns)
Here:
$58,654
State:
$62,806
(% of AGI for various income ranges: 942.2% for AGIs below $25k, 2544.7% for AGIs $25k-50k, 4956.4% for AGIs $50k-75k, 7630.0% for AGIs $75k-100k, 12753.6% for AGIs $100k-200k)
Taxable interest for individuals: $1,358 (reported on 52.0% of returns)
This zip code:
$1,358
Pennsylvania:
$1,633
(% of AGI for various income ranges: 65.6% for AGIs below $25k, 80.0% for AGIs $25k-50k, 128.2% for AGIs $50k-75k, 107.5% for AGIs $75k-100k, 168.2% for AGIs $100k-200k)
Ordinary dividends: $4,208 (reported on 39.0% of returns)
Here:
$4,208
State:
$7,382
(% of AGI for various income ranges: 60.0% for AGIs below $25k, 90.7% for AGIs $25k-50k, 221.8% for AGIs $50k-75k, 261.2% for AGIs $75k-100k, 529.1% for AGIs $100k-200k)
Net capital gain/loss in AGI: +$6,421 (reported on 28.0% of returns)
Here:
+$6,421
State:
+$23,522
(% of AGI for various income ranges: 8.3% for AGIs below $25k, 46.0% for AGIs $25k-50k, 237.3% for AGIs $50k-75k, 416.2% for AGIs $75k-100k, 520.9% for AGIs $100k-200k)
Profit/loss from business: +$13,745 (reported on 11.0% of returns)
Here:
+$13,745
State:
+$16,274
(% of AGI for various income ranges: 261.1% for AGIs below $25k, 66.4% for AGIs $50k-75k, 880.9% for AGIs $100k-200k)
Taxable individual retirement arrangement distribution: $14,181 (reported on 26.0% of returns)
15928:
$14,181
Pennsylvania:
$18,583
(% of AGI for various income ranges: 258.3% for AGIs below $25k, 404.0% for AGIs $25k-50k, 387.3% for AGIs $50k-75k, 826.2% for AGIs $75k-100k, 1390.0% for AGIs $100k-200k)
Total itemized deductions: $45,175 (reported on 4.0% of returns)
Here:
$45,175
State:
$34,850
(% of AGI for various income ranges: 1642.7% for AGIs $100k-200k)
Charity contributions: $13,400 (reported on 3.0% of returns)
Here:
$13,400
State:
$12,392
(% of AGI for various income ranges: 365.5% for AGIs $100k-200k)
Taxes paid: $5,225 (reported on 4.0% of returns)
15928:
$5,225
State:
$8,200
(% of AGI for various income ranges: 190.0% for AGIs $100k-200k)
Earned income credit: $2,140 (reported on 5.0% of returns)
Here:
$2,140
State:
$2,100
(% of AGI for various income ranges: 59.4% for AGIs below $25k)
Percentage of individuals using paid preparers for their 2020 taxes: 92.0%
Here:
92%
State:
92%
(% for various income ranges: 90.3% for AGIs below $25k, 85.7% for AGIs $25k-50k, 93.8% for AGIs $50k-75k, 100.0% for AGIs $75k-100k, 100.0% for AGIs $100k-200k, 75.0% for AGIs over 200k)
Averages for the 2012 tax year for zip code 15928, filed in 2013:
Average Adjusted Gross Income (AGI) in 2012: $52,250 (Individual Income Tax Returns)
Here:
$52,250
State:
$61,346
Salary/wage: $47,652 (reported on 66.3% of returns)
Here:
$47,652
State:
$51,902
(% of AGI for various income ranges: 51.9% for AGIs below $25k, 54.4% for AGIs $25k-50k, 64.0% for AGIs $50k-75k, 56.7% for AGIs $75k-100k, 64.8% for AGIs $100k-200k)
Taxable interest for individuals: $1,252 (reported on 57.4% of returns)
This zip code:
$1,252
Pennsylvania:
$1,588
(% of AGI for various income ranges: 3.9% for AGIs below $25k, 2.0% for AGIs $25k-50k, 1.4% for AGIs $50k-75k, 0.9% for AGIs $75k-100k, 0.8% for AGIs $100k-200k)
Ordinary dividends: $2,962 (reported on 36.6% of returns)
Here:
$2,962
State:
$5,827
(% of AGI for various income ranges: 4.7% for AGIs below $25k, 2.3% for AGIs $25k-50k, 0.9% for AGIs $50k-75k, 3.0% for AGIs $75k-100k, 1.6% for AGIs $100k-200k)
Net capital gain/loss in AGI: +$3,220 (reported on 24.8% of returns)
Here:
+$3,220
State:
+$14,495
(% of AGI for various income ranges: 1.0% for AGIs $25k-50k, 0.4% for AGIs $50k-75k, 0.5% for AGIs $75k-100k, 3.3% for AGIs $100k-200k)
Profit/loss from business: +$13,777 (reported on 12.9% of returns)
Here:
+$13,777
State:
+$16,268
(% of AGI for various income ranges: 5.7% for AGIs below $25k, 5.4% for AGIs $25k-50k, 5.6% for AGIs $50k-75k, 2.7% for AGIs $100k-200k)
Taxable individual retirement arrangement distribution: $12,518 (reported on 21.8% of returns)
15928:
$12,518
Pennsylvania:
$14,550
(% of AGI for various income ranges: 10.0% for AGIs below $25k, 6.0% for AGIs $25k-50k, 5.5% for AGIs $50k-75k, 6.6% for AGIs $75k-100k, 2.9% for AGIs $100k-200k)
Total itemized deductions: $20,817 (21% of AGI, reported on 23.8% of returns)
Here:
$20,817
State:
$23,538
Here:
21.5% of AGI
State:
18.4% of AGI
(% of AGI for various income ranges: 8.2% for AGIs below $25k, 8.2% for AGIs $25k-50k, 7.0% for AGIs $50k-75k, 10.7% for AGIs $75k-100k, 11.0% for AGIs $100k-200k)
Charity contributions: $4,937 (reported on 18.8% of returns)
Here:
$4,937
State:
$4,025
(% of AGI for various income ranges: 1.5% for AGIs $25k-50k, 1.2% for AGIs $50k-75k, 2.1% for AGIs $75k-100k, 2.4% for AGIs $100k-200k)
Taxes paid: $5,909 (reported on 22.8% of returns)
15928:
$5,909
State:
$9,982
(% of AGI for various income ranges: 0.8% for AGIs below $25k, 1.3% for AGIs $25k-50k, 1.7% for AGIs $50k-75k, 2.3% for AGIs $75k-100k, 4.1% for AGIs $100k-200k)
Earned income credit: $1,529 (reported on 6.9% of returns)
Here:
$1,529
State:
$2,106
(% of AGI for various income ranges: 1.9% for AGIs below $25k, 0.3% for AGIs $25k-50k)
Percentage of individuals using paid preparers for their 2012 taxes: 59.4%
Here:
59%
State:
53%
(% for various income ranges: 53.8% for AGIs below $25k, 60.0% for AGIs $25k-50k, 58.8% for AGIs $50k-75k, 66.7% for AGIs $75k-100k, 69.2% for AGIs $100k-200k)
Averages for the 2004 tax year for zip code 15928, filed in 2005:
Average Adjusted Gross Income (AGI) in 2004: $40,452 (Individual Income Tax Returns)
Here:
$40,452
State:
$48,049
Salary/wage: $38,235 (reported on 72.3% of returns)
Here:
$38,235
State:
$42,646
(% of AGI for various income ranges: 84.8% for AGIs below $10k, 50.1% for AGIs $10k-25k, 66.2% for AGIs $25k-50k, 73.5% for AGIs $50k-75k, 79.1% for AGIs $75k-100k, 61.4% for AGIs over 100k)
Taxable interest for individuals: $1,832 (reported on 65.4% of returns)
This zip code:
$1,832
Pennsylvania:
$1,657
(% of AGI for various income ranges: 7.0% for AGIs below $10k, 6.5% for AGIs $10k-25k, 3.9% for AGIs $25k-50k, 2.5% for AGIs $50k-75k, 1.4% for AGIs $75k-100k, 1.8% for AGIs over 100k)
Taxable dividends: $2,065 (reported on 39.0% of returns)
Here:
$2,065
State:
$3,566
(% of AGI for various income ranges: 5.2% for AGIs below $10k, 4.4% for AGIs $10k-25k, 2.3% for AGIs $25k-50k, 1.2% for AGIs $50k-75k, 0.8% for AGIs $75k-100k, 2.3% for AGIs over 100k)
Net capital gain/loss: +$1,080 (reported on 24.7% of returns)
Here:
+$1,080
State:
+$9,716
(% of AGI for various income ranges: 2.2% for AGIs below $10k, 0.4% for AGIs $10k-25k, -0.0% for AGIs $25k-50k, 1.8% for AGIs $50k-75k, 0.2% for AGIs $75k-100k, 0.3% for AGIs over 100k)
Profit/loss from business: +$12,059 (reported on 14.9% of returns)
Here:
+$12,059
State:
+$14,267
(% of AGI for various income ranges: 3.9% for AGIs below $10k, 7.1% for AGIs $10k-25k, 2.2% for AGIs $25k-50k, 1.3% for AGIs $50k-75k, 13.7% for AGIs over 100k)
IRA payment deduction: $2,622 (reported on 4.1% of returns)
15928:
$2,622
Pennsylvania:
$2,903
Total itemized deductions: $16,122 (23% of AGI, reported on 28.0% of returns)
Here:
$16,122
State:
$18,804
Here:
22.7% of AGI
State:
19.5% of AGI
(% of AGI for various income ranges: 8.8% for AGIs $10k-25k, 11.3% for AGIs $25k-50k, 10.5% for AGIs $50k-75k, 12.1% for AGIs $75k-100k, 13.0% for AGIs over 100k)
Charity contributions deductions: $3,754 (5% of AGI, reported on 25.9% of returns)
Here:
$3,754
State:
$3,337
Here:
5.1% of AGI
State:
3.3% of AGI
(% of AGI for various income ranges: 1.5% for AGIs $10k-25k, 2.3% for AGIs $25k-50k, 1.8% for AGIs $50k-75k, 2.7% for AGIs $75k-100k, 3.7% for AGIs over 100k)
Total tax: $5,020 (reported on 78.0% of returns)
15928:
$5,020
State:
$8,008
(% of AGI for various income ranges: 2.5% for AGIs below $10k, 4.5% for AGIs $10k-25k, 6.7% for AGIs $25k-50k, 8.4% for AGIs $50k-75k, 9.9% for AGIs $75k-100k, 17.4% for AGIs over 100k)
Earned income credit: $1,567 (reported on 6.6% of returns)
Here:
$1,567
State:
$1,643
Percentage of individuals using paid preparers for their 2004 taxes: 58.3%
Here:
58%
State:
56%
(% for various income ranges: 56.6% for AGIs below $10k, 53.9% for AGIs $10k-25k, 61.5% for AGIs $25k-50k, 57.0% for AGIs $50k-75k, 57.3% for AGIs $75k-100k, 76.5% for AGIs over 100k)
Household received Food Stamps/SNAP in the past 12 months: 56 Household did not receive Food Stamps/SNAP in the past 12 months: 876
Women who had a birth in the past 12 months: 54 (57 now married, 0 unmarried) Women who did not have a birth in the past 12 months: 209 (86 now married, 123 unmarried)
Housing units in zip code 15928 with a mortgage: 339 Houses without a mortgage: 26
Median monthly owner costs for units with a mortgage: $1,562 Median monthly owner costs for units without a mortgage: $558
Residents with income below the poverty level in 2022:
This zip code:
5.3%
Whole state:
11.8%
Residents with income below 50% of the poverty level in 2022:
This zip code:
3.7%
Whole state:
6.1%
Median number of rooms in houses and condos:
Here:
6.8
State:
6.8
Median number of rooms in apartments:
Here:
5.6
State:
4.3
Notable locations in this zip code not listed on our city pages
In group quarters: 67 (-1 institutionalized population)
Size of family households: 470 2-persons, 34 3-persons, 83 4-persons, 14 5-persons, 15 6-persons, 13 7-or-more-persons
Size of nonfamily households: 284 1-person, 25 2-persons
270 married couples with children.
24 single-parent households (24 women).
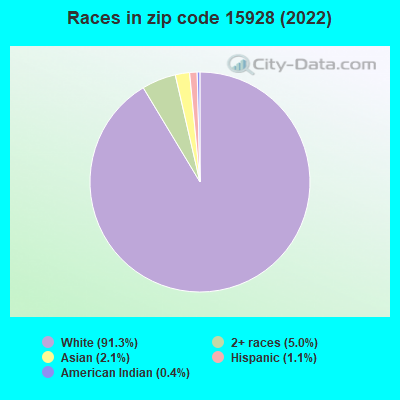
98.6% of residents of 15928 zip code speak English at home.
2.3% of residents speak Asian or Pacific Island language at home (100% very well).
Foreign born population: 20 (1.0%) (100.0% of them are naturalized citizens)
This zip code:
1.0%
Whole state:
7.5%
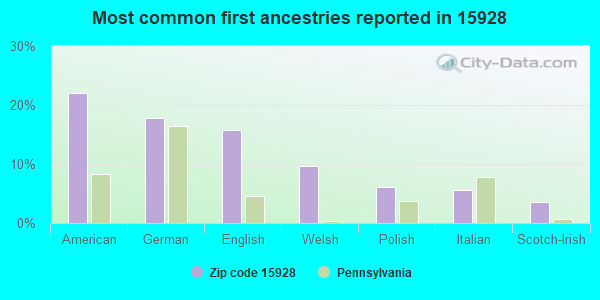
22%American
18%German
16%English
10%Welsh
6%Polish
6%Italian
4%Scotch-Irish
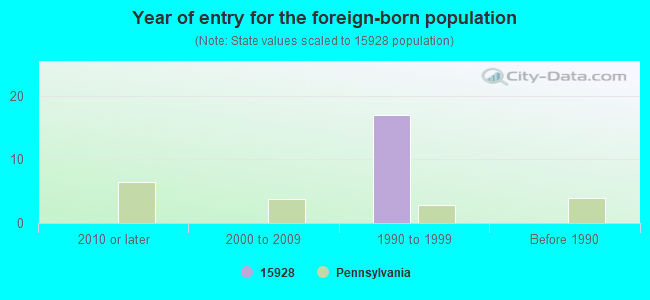
Year of entry for the foreign-born population
02010 or later
02000 to 2009
171990 to 1999
0Before 1990
Facilities with environmental interests located in this zip code:
ADVANCED CUTTING SYS (200 E CAMPUS AVE in DAVIDSVILLE, PA)
STATE MASTER (Pennsylvania database) - RCRIS-PAR000005082, HAZARDOUS WASTE PROGRAM Conditionally Exempt Small Quantity Generators, less than 100 kg/month of hazardous waste (Resource Conservation and Recovery Act (tracking hazardous waste)) - notification Business SIC classification: MINING MACHINERY AND EQUIPMENT, EXCEPT OIL AND GAS FIELD MACHINERY AND EQUIPMENT
Housing units lacking complete kitchen facilities: 2.8%
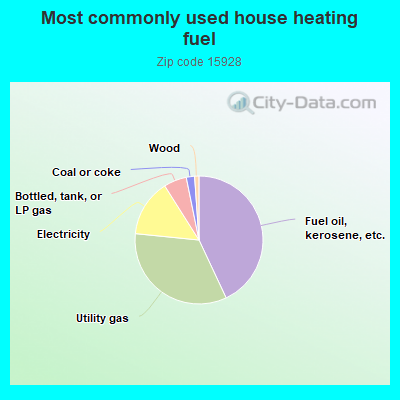
43.2%Fuel oil, kerosene, etc.
33.7%Utility gas
14.5%Electricity
5.8%Bottled, tank, or LP gas
2.1%Coal or coke
1.1%Wood
Population in 1990: 244. Population change in the 1990s: +1,542 (+632.0%).
Place of birth for U.S.-born residents:
This state: 1,877
Northeast: 64
Midwest: 14
South: 56
West: 23
67% of the 15928 zip code residents lived in the same house 5 years ago. Out of people who lived in different houses, 49% lived in this county. Out of people who lived in different counties, 50% lived in Pennsylvania.
94% of the 15928 zip code residents lived in the same house 1 year ago. Out of people who lived in different houses, 35% moved from this county. Out of people who lived in different houses, 50% moved from different county within same state. Out of people who lived in different houses, 18% moved from different state.
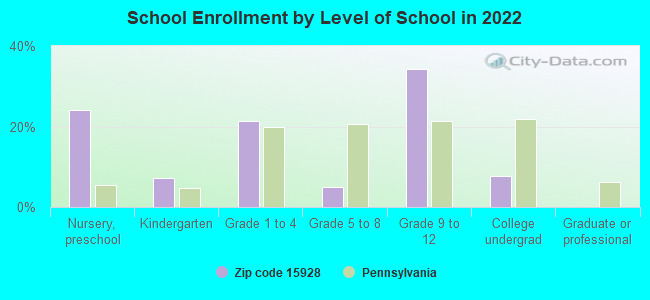
Private vs. public school enrollment:
Students in private schools in grades 1 to 8 (elementary and middle school):
Here:
0.0%
Pennsylvania:
15.7%
Students in private schools in grades 9 to 12 (high school):
Here:
0.0%
Pennsylvania:
13.4%
Students in private undergraduate colleges:
Here:
0.0%
Pennsylvania:
39.8%
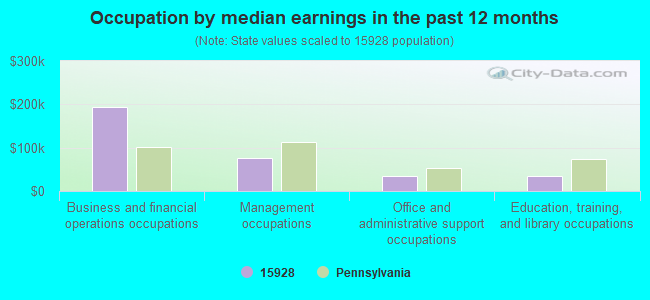
Occupation by median earnings in the past 12 months ($)
193,980Business and financial operations occupations
77,151Management occupations
35,542Office and administrative support occupations
33,863Education, training, and library occupations
Top industries in this zip code by the number of employees in 2005:
Other Services (except Public Administration): Religious Organizations (100-249 employees: 1 establishment, 5-9 employees: 1 establishment, 1-4 employees: 3 establishments)
Administrative and Support and Waste Management and Remediation Services: Solid Waste Collection (100-249: 1)
Accommodation and Food Services: Limited-Service Restaurants (10-19: 1)
Finance and Insurance: Insurance Agencies and Brokerages (5-9: 1, 1-4: 2)
Health Care and Social Assistance: Child Day Care Services (5-9: 1, 1-4: 1)
Finance and Insurance: Commercial Banking (5-9: 1)
Other Services (except Public Administration): Funeral Homes and Funeral Services (5-9: 1)
People in group quarters in 2010:
60 people in nursing facilities/skilled-nursing facilities
People in group quarters in 2000:
110 people in nursing homes
Fatal accident statistics in 2014:
Fatal accident count: 1
Vehicles involved in fatal accidents: 1
Fatal accidents caused by drunken drivers: 0
Fatalities: 2
Persons involved in fatal accidents: 6
Pedestrians involved in fatal accidents: 0
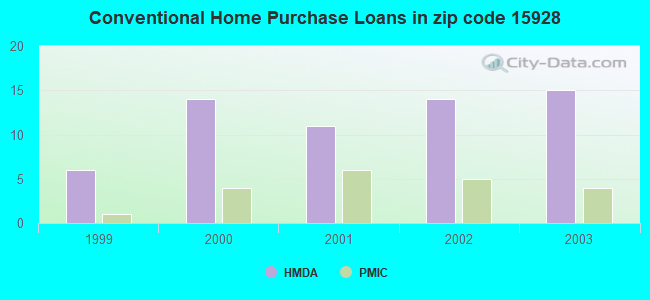
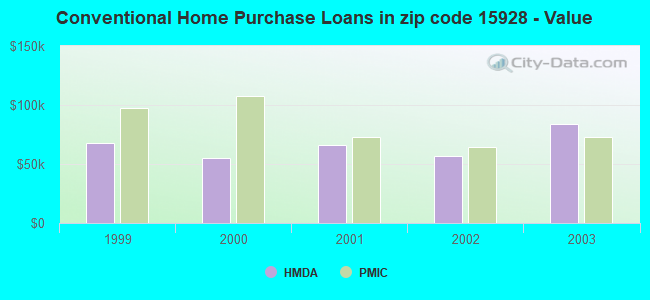
Home Mortgage Disclosure Act Aggregated Statistics For Year 2003 (Based on 2 partial tracts)
A) FHA, FSA/RHS & VA Home Purchase Loans
B) Conventional Home Purchase Loans
C) Refinancings
D) Home Improvement Loans
F) Non-occupant Loans on < 5 Family Dwellings (A B C & D)
Number
Average Value
Number
Average Value
Number
Average Value
Number
Average Value
Number
Average Value
LOANS ORIGINATED
2
$46,030
15
$83,831
59
$75,855
15
$34,277
3
$42,343
APPLICATIONS APPROVED, NOT ACCEPTED
0
$0
0
$0
8
$86,781
0
$0
0
$0
APPLICATIONS DENIED
0
$0
4
$54,170
20
$69,566
4
$32,965
0
$0
APPLICATIONS WITHDRAWN
0
$0
3
$39,263
11
$84,675
0
$0
1
$41,810
FILES CLOSED FOR INCOMPLETENESS
0
$0
0
$0
0
$0
0
$0
0
$0
Aggregated Statistics For Year 2002 (Based on 2 partial tracts)
A) FHA, FSA/RHS & VA Home Purchase Loans
B) Conventional Home Purchase Loans
C) Refinancings
D) Home Improvement Loans
F) Non-occupant Loans on < 5 Family Dwellings (A B C & D)
Number
Average Value
Number
Average Value
Number
Average Value
Number
Average Value
Number
Average Value
LOANS ORIGINATED
4
$84,620
14
$56,768
41
$63,065
10
$25,406
1
$19,300
APPLICATIONS APPROVED, NOT ACCEPTED
0
$0
2
$46,835
7
$69,374
3
$20,770
0
$0
APPLICATIONS DENIED
0
$0
4
$45,828
29
$62,698
4
$8,742
1
$43,820
APPLICATIONS WITHDRAWN
0
$0
0
$0
12
$60,769
0
$0
0
$0
FILES CLOSED FOR INCOMPLETENESS
0
$0
0
$0
2
$93,265
0
$0
0
$0
Aggregated Statistics For Year 2001 (Based on 2 partial tracts)
A) FHA, FSA/RHS & VA Home Purchase Loans
B) Conventional Home Purchase Loans
C) Refinancings
D) Home Improvement Loans
F) Non-occupant Loans on < 5 Family Dwellings (A B C & D)
Number
Average Value
Number
Average Value
Number
Average Value
Number
Average Value
Number
Average Value
LOANS ORIGINATED
3
$58,827
11
$65,818
32
$56,582
11
$17,140
2
$31,760
APPLICATIONS APPROVED, NOT ACCEPTED
0
$0
2
$26,735
5
$68,742
0
$0
0
$0
APPLICATIONS DENIED
1
$30,150
9
$38,637
17
$53,111
6
$19,832
2
$32,160
APPLICATIONS WITHDRAWN
1
$57,890
0
$0
6
$52,863
0
$0
0
$0
FILES CLOSED FOR INCOMPLETENESS
0
$0
1
$57,080
3
$54,403
0
$0
0
$0
Aggregated Statistics For Year 2000 (Based on 2 partial tracts)
A) FHA, FSA/RHS & VA Home Purchase Loans
B) Conventional Home Purchase Loans
C) Refinancings
D) Home Improvement Loans
F) Non-occupant Loans on < 5 Family Dwellings (A B C & D)
Number
Average Value
Number
Average Value
Number
Average Value
Number
Average Value
Number
Average Value
LOANS ORIGINATED
2
$55,275
14
$54,816
10
$47,918
13
$8,752
1
$28,140
APPLICATIONS APPROVED, NOT ACCEPTED
0
$0
1
$58,290
3
$43,953
3
$11,123
0
$0
APPLICATIONS DENIED
0
$0
6
$48,508
8
$43,165
2
$14,070
0
$0
APPLICATIONS WITHDRAWN
0
$0
0
$0
7
$47,149
1
$5,630
0
$0
FILES CLOSED FOR INCOMPLETENESS
0
$0
0
$0
1
$50,250
0
$0
0
$0
Aggregated Statistics For Year 1999 (Based on 1 partial tract)
A) FHA, FSA/RHS & VA Home Purchase Loans
B) Conventional Home Purchase Loans
C) Refinancings
D) Home Improvement Loans
F) Non-occupant Loans on < 5 Family Dwellings (A B C & D)
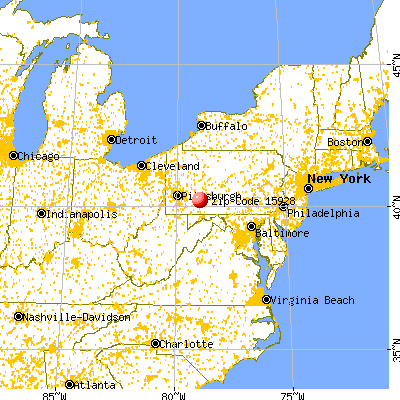


 Nearest zip codes: 15953, 15935, 15905, 15937, 15936, 15901.