Estimated zip code population in 2022: 8,117 Zip code population in 2010: 6,559 Zip code population in 2000: 6,802
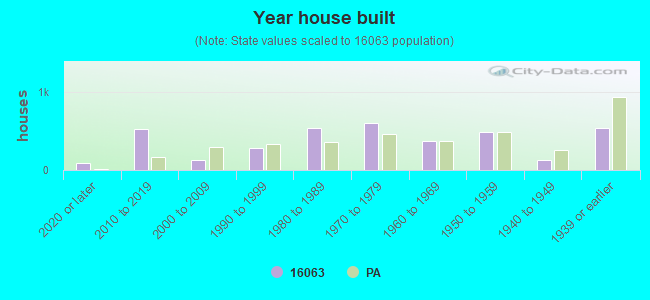
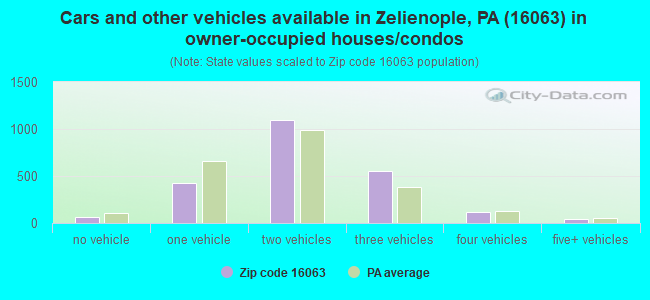
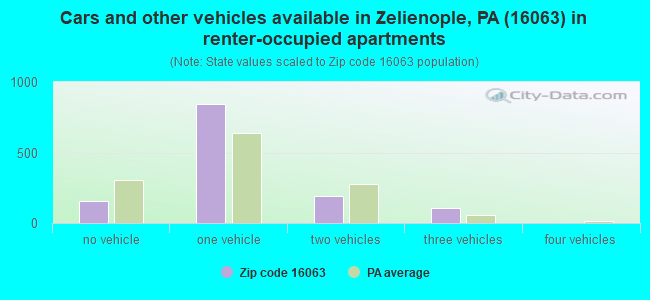
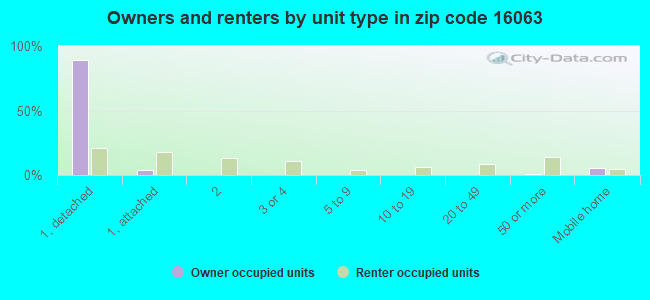
Houses and condos: 3,612 Renter-occupied apartments: 1,293
% of renters here:
36%
State:
31%
March 2022 cost of living index in zip code 16063: 91.4 (less than average, U.S. average is 100)
Land area: 17.8 sq. mi. Water area: 0.1 sq. mi.
Population density: 456 people per square mile
(low).
OSM Map
General Map
Google Map
MSN Map
OSM Map
General Map
Google Map
MSN Map
OSM Map
General Map
Google Map
MSN Map
OSM Map
General Map
Google Map
MSN Map
Please wait while loading the map...
Real estate property taxes paid for housing units in 2022:
This zip code:
1.0% ($3,031)
Pennsylvania:
1.3% ($3,094)
Median real estate property taxes paid for housing units with mortgages in 2022: $3,144 (1.0%) Median real estate property taxes paid for housing units with no mortgage in 2022: $2,784 (1.0%)
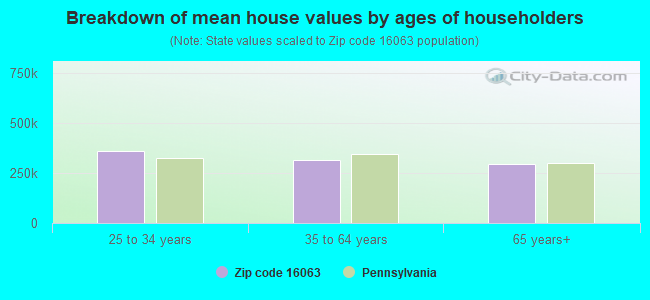
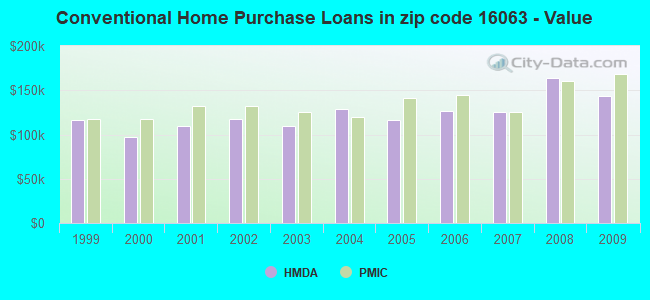
Estimated median house/condo value in 2022: $298,464
16063:
$298,464
Pennsylvania:
$245,500
According to our research of Pennsylvania and other state lists, there were 4 registered sex offenders living in 16063 zip code as of April 27, 2024. The ratio of all residents to sex offenders in zip code 16063 is 1,677 to 1. The ratio of registered sex offenders to all residents in this zip code is much lower than the state average.
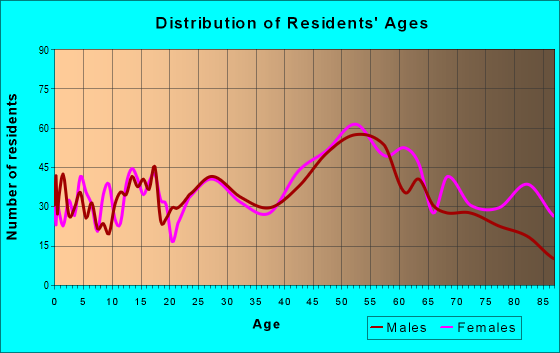
Median resident age:
This zip code:
41.6 years
Pennsylvania median age:
40.9 years
Average household size:
This zip code:
2.2 people
Pennsylvania:
2.4 people
Averages for the 2020 tax year for zip code 16063, filed in 2021:
Average Adjusted Gross Income (AGI) in 2020: $83,525 (Individual Income Tax Returns)
Here:
$83,525
State:
$75,707
Salary/wage: $73,578 (reported on 77.1% of returns)
Here:
$73,578
State:
$62,806
(% of AGI for various income ranges: 1001.8% for AGIs below $25k, 3411.8% for AGIs $25k-50k, 5670.0% for AGIs $50k-75k, 8406.7% for AGIs $75k-100k, 17576.1% for AGIs $100k-200k, 65645.0% for AGIs over 200k)
Taxable interest for individuals: $1,342 (reported on 39.0% of returns)
This zip code:
$1,342
Pennsylvania:
$1,633
(% of AGI for various income ranges: 29.9% for AGIs below $25k, 32.5% for AGIs $25k-50k, 68.4% for AGIs $50k-75k, 98.5% for AGIs $75k-100k, 105.7% for AGIs $100k-200k, 636.0% for AGIs over 200k)
Ordinary dividends: $5,905 (reported on 30.3% of returns)
Here:
$5,905
State:
$7,382
(% of AGI for various income ranges: 47.5% for AGIs below $25k, 81.2% for AGIs $25k-50k, 121.4% for AGIs $50k-75k, 267.9% for AGIs $75k-100k, 390.4% for AGIs $100k-200k, 3280.0% for AGIs over 200k)
Net capital gain/loss in AGI: +$11,785 (reported on 25.4% of returns)
Here:
+$11,785
State:
+$23,522
(% of AGI for various income ranges: 31.8% for AGIs below $25k, 55.7% for AGIs $25k-50k, 98.6% for AGIs $50k-75k, 233.9% for AGIs $75k-100k, 317.7% for AGIs $100k-200k, 9400.0% for AGIs over 200k)
Profit/loss from business: +$18,203 (reported on 14.3% of returns)
Here:
+$18,203
State:
+$16,274
(% of AGI for various income ranges: 53.5% for AGIs below $25k, 148.3% for AGIs $25k-50k, 280.7% for AGIs $50k-75k, 233.6% for AGIs $75k-100k, 645.0% for AGIs $100k-200k, 4340.0% for AGIs over 200k)
Taxable individual retirement arrangement distribution: $21,576 (reported on 16.4% of returns)
16063:
$21,576
Pennsylvania:
$18,583
(% of AGI for various income ranges: 153.7% for AGIs below $25k, 215.8% for AGIs $25k-50k, 315.9% for AGIs $50k-75k, 540.9% for AGIs $75k-100k, 1034.6% for AGIs $100k-200k, 3902.0% for AGIs over 200k)
Self-employed (Keogh) retirement plans: $23,000 (reported on 0.7% of returns)
16063:
$23,000
Pennsylvania:
$25,407
(% of AGI for various income ranges: 123.2% for AGIs $100k-200k)
Total itemized deductions: $32,474 (reported on 8.8% of returns)
Here:
$32,474
State:
$34,850
(% of AGI for various income ranges: 217.5% for AGIs $25k-50k, 278.4% for AGIs $50k-75k, 339.7% for AGIs $75k-100k, 890.9% for AGIs $100k-200k, 3591.0% for AGIs over 200k)
Charity contributions: $11,416 (reported on 7.2% of returns)
Here:
$11,416
State:
$12,392
(% of AGI for various income ranges: 15.1% for AGIs $25k-50k, 38.4% for AGIs $50k-75k, 68.2% for AGIs $75k-100k, 244.1% for AGIs $100k-200k, 1680.0% for AGIs over 200k)
Taxes paid: $7,647 (reported on 8.8% of returns)
16063:
$7,647
State:
$8,200
(% of AGI for various income ranges: 15.1% for AGIs $25k-50k, 40.9% for AGIs $50k-75k, 87.0% for AGIs $75k-100k, 249.8% for AGIs $100k-200k, 942.0% for AGIs over 200k)
Earned income credit: $1,796 (reported on 6.0% of returns)
Here:
$1,796
State:
$2,100
(% of AGI for various income ranges: 33.4% for AGIs below $25k, 36.9% for AGIs $25k-50k)
Percentage of individuals using paid preparers for their 2020 taxes: 91.5%
Here:
91%
State:
92%
(% for various income ranges: 88.4% for AGIs below $25k, 91.1% for AGIs $25k-50k, 93.3% for AGIs $50k-75k, 93.6% for AGIs $75k-100k, 92.6% for AGIs $100k-200k, 93.1% for AGIs over 200k)
Averages for the 2012 tax year for zip code 16063, filed in 2013:
Average Adjusted Gross Income (AGI) in 2012: $58,815 (Individual Income Tax Returns)
Here:
$58,815
State:
$61,346
Salary/wage: $51,482 (reported on 77.4% of returns)
Here:
$51,482
State:
$51,902
(% of AGI for various income ranges: 64.7% for AGIs below $25k, 71.2% for AGIs $25k-50k, 75.6% for AGIs $50k-75k, 73.8% for AGIs $75k-100k, 72.6% for AGIs $100k-200k, 51.2% for AGIs over 200k)
Taxable interest for individuals: $1,405 (reported on 41.0% of returns)
This zip code:
$1,405
Pennsylvania:
$1,588
(% of AGI for various income ranges: 2.3% for AGIs below $25k, 1.2% for AGIs $25k-50k, 0.6% for AGIs $50k-75k, 1.2% for AGIs $75k-100k, 0.7% for AGIs $100k-200k, 0.9% for AGIs over 200k)
Ordinary dividends: $4,934 (reported on 28.5% of returns)
Here:
$4,934
State:
$5,827
(% of AGI for various income ranges: 2.9% for AGIs below $25k, 2.1% for AGIs $25k-50k, 1.3% for AGIs $50k-75k, 1.5% for AGIs $75k-100k, 2.7% for AGIs $100k-200k, 3.5% for AGIs over 200k)
Net capital gain/loss in AGI: +$8,859 (reported on 20.2% of returns)
Here:
+$8,859
State:
+$14,495
(% of AGI for various income ranges: 0.2% for AGIs $25k-50k, 0.4% for AGIs $50k-75k, 1.0% for AGIs $75k-100k, 1.9% for AGIs $100k-200k, 10.4% for AGIs over 200k)
Profit/loss from business: +$15,962 (reported on 12.8% of returns)
Here:
+$15,962
State:
+$16,268
(% of AGI for various income ranges: 4.7% for AGIs below $25k, 3.4% for AGIs $25k-50k, 1.9% for AGIs $50k-75k, 4.0% for AGIs $75k-100k, 3.9% for AGIs $100k-200k, 3.3% for AGIs over 200k)
Taxable individual retirement arrangement distribution: $12,218 (reported on 16.5% of returns)
16063:
$12,218
Pennsylvania:
$14,550
(% of AGI for various income ranges: 6.5% for AGIs below $25k, 4.7% for AGIs $25k-50k, 3.4% for AGIs $50k-75k, 3.4% for AGIs $75k-100k, 3.8% for AGIs $100k-200k, 1.2% for AGIs over 200k)
Self-employment retirement plans: $14,600 (reported on 0.8% of returns)
16063:
$14,600
Pennsylvania:
$20,922
Total itemized deductions: $20,603 (18% of AGI, reported on 29.5% of returns)
Here:
$20,603
State:
$23,538
Here:
17.7% of AGI
State:
18.4% of AGI
(% of AGI for various income ranges: 7.3% for AGIs below $25k, 8.5% for AGIs $25k-50k, 10.2% for AGIs $50k-75k, 10.1% for AGIs $75k-100k, 12.9% for AGIs $100k-200k, 9.8% for AGIs over 200k)
Charity contributions: $4,537 (reported on 25.3% of returns)
Here:
$4,537
State:
$4,025
(% of AGI for various income ranges: 0.8% for AGIs below $25k, 1.2% for AGIs $25k-50k, 1.3% for AGIs $50k-75k, 1.5% for AGIs $75k-100k, 2.6% for AGIs $100k-200k, 2.8% for AGIs over 200k)
Taxes paid: $7,657 (reported on 29.3% of returns)
16063:
$7,657
State:
$9,982
(% of AGI for various income ranges: 1.5% for AGIs below $25k, 1.8% for AGIs $25k-50k, 3.0% for AGIs $50k-75k, 3.4% for AGIs $75k-100k, 5.3% for AGIs $100k-200k, 4.9% for AGIs over 200k)
Earned income credit: $1,609 (reported on 8.5% of returns)
Here:
$1,609
State:
$2,106
(% of AGI for various income ranges: 2.4% for AGIs below $25k, 0.5% for AGIs $25k-50k)
Percentage of individuals using paid preparers for their 2012 taxes: 55.1%
Here:
55%
State:
53%
(% for various income ranges: 51.1% for AGIs below $25k, 52.8% for AGIs $25k-50k, 54.5% for AGIs $50k-75k, 60.0% for AGIs $75k-100k, 60.5% for AGIs $100k-200k, 83.3% for AGIs over 200k)
Averages for the 2004 tax year for zip code 16063, filed in 2005:
Average Adjusted Gross Income (AGI) in 2004: $46,254 (Individual Income Tax Returns)
Here:
$46,254
State:
$48,049
Salary/wage: $43,811 (reported on 78.9% of returns)
Here:
$43,811
State:
$42,646
(% of AGI for various income ranges: 91.5% for AGIs below $10k, 62.9% for AGIs $10k-25k, 75.5% for AGIs $25k-50k, 80.8% for AGIs $50k-75k, 79.5% for AGIs $75k-100k, 70.6% for AGIs over 100k)
Taxable interest for individuals: $1,821 (reported on 57.0% of returns)
This zip code:
$1,821
Pennsylvania:
$1,657
(% of AGI for various income ranges: 11.4% for AGIs below $10k, 6.0% for AGIs $10k-25k, 1.8% for AGIs $25k-50k, 2.1% for AGIs $50k-75k, 1.3% for AGIs $75k-100k, 1.7% for AGIs over 100k)
Taxable dividends: $3,013 (reported on 34.2% of returns)
Here:
$3,013
State:
$3,566
(% of AGI for various income ranges: 7.3% for AGIs below $10k, 3.1% for AGIs $10k-25k, 1.9% for AGIs $25k-50k, 1.4% for AGIs $50k-75k, 1.3% for AGIs $75k-100k, 2.8% for AGIs over 100k)
Net capital gain/loss: +$5,191 (reported on 24.6% of returns)
Here:
+$5,191
State:
+$9,716
(% of AGI for various income ranges: -1.4% for AGIs below $10k, 0.5% for AGIs $10k-25k, 0.6% for AGIs $25k-50k, 0.7% for AGIs $50k-75k, 1.6% for AGIs $75k-100k, 6.4% for AGIs over 100k)
Profit/loss from business: +$16,285 (reported on 12.0% of returns)
Here:
+$16,285
State:
+$14,267
(% of AGI for various income ranges: -6.6% for AGIs below $10k, 4.3% for AGIs $10k-25k, 3.9% for AGIs $25k-50k, 2.6% for AGIs $50k-75k, 4.1% for AGIs $75k-100k, 5.9% for AGIs over 100k)
IRA payment deduction: $2,950 (reported on 3.3% of returns)
16063:
$2,950
Pennsylvania:
$2,903
(% of AGI for various income ranges: 0.4% for AGIs $10k-25k, 0.4% for AGIs $25k-50k, 0.1% for AGIs $50k-75k, 0.2% for AGIs $75k-100k, 0.2% for AGIs over 100k)
Self-employed pension: $12,098 (reported on 1.1% of returns)
Here:
$12,098
Pennsylvania:
$14,674
Total itemized deductions: $18,657 (21% of AGI, reported on 31.2% of returns)
Here:
$18,657
State:
$18,804
Here:
20.7% of AGI
State:
19.5% of AGI
(% of AGI for various income ranges: 10.0% for AGIs below $10k, 10.1% for AGIs $10k-25k, 12.6% for AGIs $25k-50k, 13.2% for AGIs $50k-75k, 14.1% for AGIs $75k-100k, 12.2% for AGIs over 100k)
Charity contributions deductions: $3,272 (4% of AGI, reported on 28.1% of returns)
Here:
$3,272
State:
$3,337
Here:
3.5% of AGI
State:
3.3% of AGI
(% of AGI for various income ranges: 0.5% for AGIs below $10k, 1.1% for AGIs $10k-25k, 1.4% for AGIs $25k-50k, 2.0% for AGIs $50k-75k, 2.1% for AGIs $75k-100k, 2.6% for AGIs over 100k)
Total tax: $7,501 (reported on 76.0% of returns)
16063:
$7,501
State:
$8,008
(% of AGI for various income ranges: 2.6% for AGIs below $10k, 4.5% for AGIs $10k-25k, 7.6% for AGIs $25k-50k, 9.2% for AGIs $50k-75k, 10.6% for AGIs $75k-100k, 19.7% for AGIs over 100k)
Earned income credit: $1,347 (reported on 7.8% of returns)
Here:
$1,347
State:
$1,643
Percentage of individuals using paid preparers for their 2004 taxes: 55.4%
Here:
55%
State:
56%
(% for various income ranges: 48.3% for AGIs below $10k, 57.9% for AGIs $10k-25k, 55.8% for AGIs $25k-50k, 57.8% for AGIs $50k-75k, 54.0% for AGIs $75k-100k, 63.0% for AGIs over 100k)
Household received Food Stamps/SNAP in the past 12 months: 189 Household did not receive Food Stamps/SNAP in the past 12 months: 3,402
Women who had a birth in the past 12 months: 87 (67 now married, 20 unmarried) Women who did not have a birth in the past 12 months: 1,664 (827 now married, 831 unmarried)
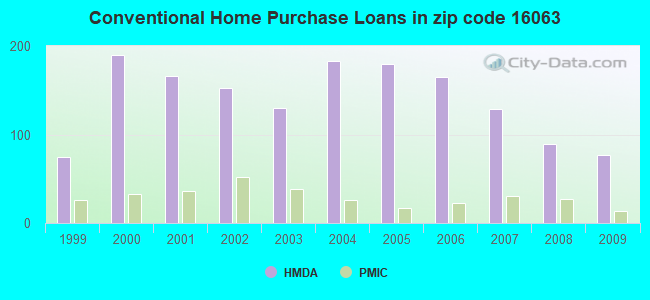
Housing units in zip code 16063 with a mortgage: 1,612 (207 second mortgage, 196 both second mortgage and home equity loan) Houses without a mortgage: 157
Median monthly owner costs for units with a mortgage: $1,713 Median monthly owner costs for units without a mortgage: $643
Residents with income below the poverty level in 2022:
This zip code:
4.6%
Whole state:
11.8%
Residents with income below 50% of the poverty level in 2022:
This zip code:
2.6%
Whole state:
6.1%
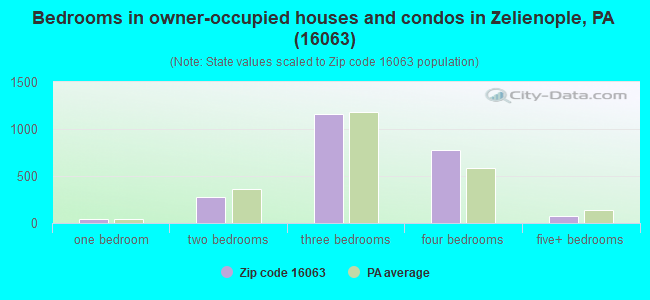
Median number of rooms in houses and condos:
Here:
7.4
State:
6.8
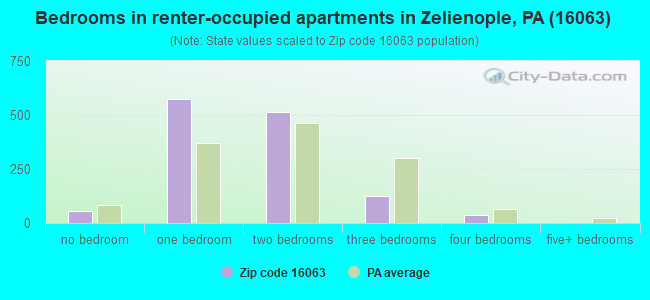
Median number of rooms in apartments:
Here:
4.0
State:
4.3
Notable locations in this zip code not listed on our city pages
In group quarters: 47 (-1 institutionalized population)
Size of family households: 1,098 2-persons, 509 3-persons, 251 4-persons, 247 5-persons, 40 6-persons, 25 7-or-more-persons
Size of nonfamily households: 1,229 1-person, 182 2-persons, 33 3-persons
1,376 married couples with children.
316 single-parent households (50 men, 266 women).
97.9% of residents of 16063 zip code speak English at home.
0.6% of residents speak Spanish at home (94% very well, 4% not well, 2% not at all).
1.0% of residents speak other Indo-European language at home (67% very well, 33% well).
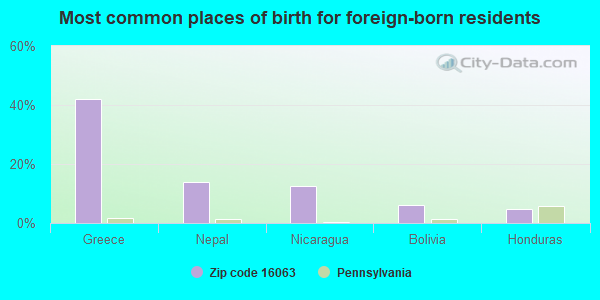
Foreign born population: 65 (0.8%) (84.4% of them are naturalized citizens)
This zip code:
0.8%
Whole state:
7.5%
42%Greece
14%Nepal
12%Nicaragua
6%Bolivia
5%Honduras
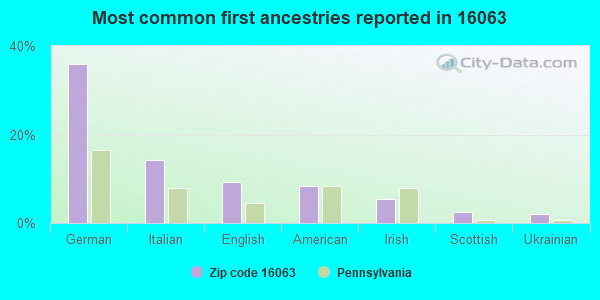
36%German
14%Italian
9%English
8%American
5%Irish
2%Scottish
2%Ukrainian
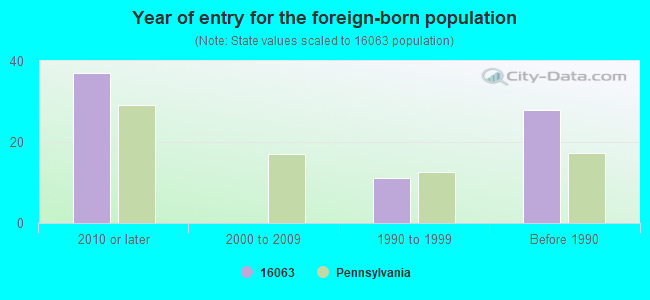
Year of entry for the foreign-born population
372010 or later
02000 to 2009
111990 to 1999
28Before 1990
Facilities with environmental interests located in this zip code:
BNZ MATERIALS (191 FRONT ST in ZELIENOPLE, PA)
AIR MAJOR (AIRS/AFS) CRITERIA AND HAZARDOUS AIR POLLUTANT INVENTORY (Inventory of air pollution sources) STATE MASTER (Pennsylvania database) - AFS-25-1560314-1, AIR PROGRAM, PCS-PAR218305, National Pollutant Discharge Elimination System Permit National Pollutant Discharge Elimination System NON-MAJOR (Tracking pollutant discharge elimination systems) - permit TRI REPORTER (Tracking of toxic chemicals releasing facilities) Business SIC classification: CLAY REFRACTORIES Organizations: BNZ MATERIALS INC (CONTACT/OWNER)
AMERICAN PLATING COMPANY (510 WEST GRANDVIEW AVENUE in ZELIENOPLE, PA)
STATE MASTER (Pennsylvania database) - RCRIS-PAD990752099, HAZARDOUS WASTE PROGRAM (Resource Conservation and Recovery Act (tracking hazardous waste)) TRI REPORTER (Tracking of toxic chemicals releasing facilities) Business SIC and NAICS classification: ELECTROPLATING, PLATING, POLISHING, ANODIZING, AND COLORING Organizations: OPERNAME (CONTACT/OPERATOR)
Alternative names: AMERICAN PLATING CO#
AIR TURBINE PROPELLER (22329 PERRY HWY in ZELIENOPLE, PA)
STATE MASTER (Pennsylvania database) - RCRIS-PAR000510339, HAZARDOUS WASTE PROGRAM Small Quantity Generators, between 100 kg and 1000 kg of hazardous waste/month (Resource Conservation and Recovery Act (tracking hazardous waste)) Business SIC classification: METAL STAMPINGS Organizations: AIR TURBINE PROPELLER CO (CONTACT/OPERATOR)
, AIR TURBINE PROPELLER CO. (CONTACT/OWNER)
BILLCO MFG (100 GRANDVIEW BLVD in ZELIENOPLE, PA)
STATE MASTER (Pennsylvania database) - RCRIS-PAD004372371, HAZARDOUS WASTE PROGRAM Small Quantity Generators, between 100 kg and 1000 kg of hazardous waste/month (Resource Conservation and Recovery Act (tracking hazardous waste)) - notification Organizations: OPERNAME (CONTACT/OPERATOR)
, BILLCO CORP (CONTACT/OWNER)
Alternative names: BILLCO INC
AMERICAN ASBESTOS (60 PROGRESS AVE in ZELIENOPLE, PA)
(Integrated Compliance Information System) - ICIS-05-1994-0284, FORMAL ENFORCEMENT ACTION
BELL TELEPHONE CO OF PA (234 CLAY ST in ZELIENOPLE, PA)
(Resource Conservation and Recovery Act (tracking hazardous waste)) Organizations: OPERNAME (CONTACT/OPERATOR)
, BELL OF PA (CONTACT/OWNER)
ABBEY WOODS (ST IVES WAY in ZELIENOPLE, PA)
National Pollutant Discharge Elimination System NON-MAJOR (Tracking pollutant discharge elimination systems) - permit Business SIC classification: LAND SUBDIVIDERS AND DEVELOPERS, EXCEPT CEMETERIES Alternative names: ABBEY WOODS HOMEOWNERS ASSOC
BESCO MANUFACTURING COMP (P O BOX 68 in ZELIENOPLE, PA)
National Pollutant Discharge Elimination System NON-MAJOR (Tracking pollutant discharge elimination systems) - permit Business SIC classification: ALUMINUM FOUNDRIES
BILLCO MFG INC PLT 2 (MADISON DR ST RT 588 in ZELIENOPLE, PA)
Small Quantity Generators, between 100 kg and 1000 kg of hazardous waste/month (Resource Conservation and Recovery Act (tracking hazardous waste)) - notification
Housing units lacking complete kitchen facilities: 1.5%
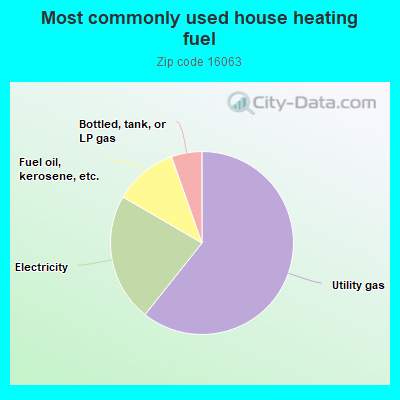
60.7%Utility gas
22.7%Electricity
11.2%Fuel oil, kerosene, etc.
5.4%Bottled, tank, or LP gas
Population in 1990: 18,300.
Place of birth for U.S.-born residents:
This state: 6,529
Northeast: 248
Midwest: 483
South: 545
West: 207
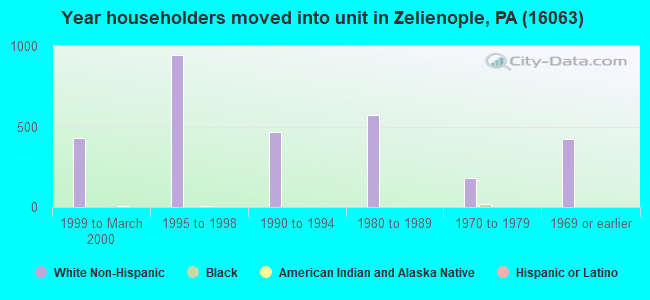
60% of the 16063 zip code residents lived in the same house 5 years ago. Out of people who lived in different houses, 45% lived in this county. Out of people who lived in different counties, 50% lived in Pennsylvania.
87% of the 16063 zip code residents lived in the same house 1 year ago. Out of people who lived in different houses, 59% moved from this county. Out of people who lived in different houses, 25% moved from different county within same state. Out of people who lived in different houses, 13% moved from different state.
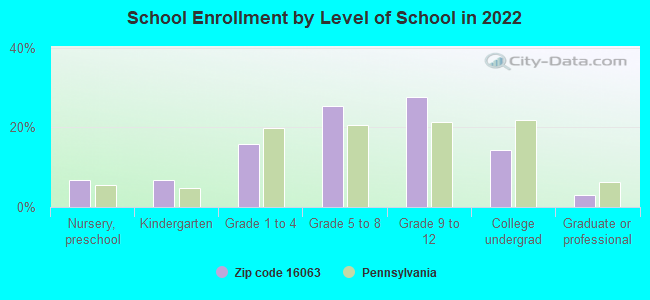
Private vs. public school enrollment:
Students in private schools in grades 1 to 8 (elementary and middle school): 66
Here:
9.2%
Pennsylvania:
15.7%
Students in private schools in grades 9 to 12 (high school):
Here:
0.0%
Pennsylvania:
13.4%
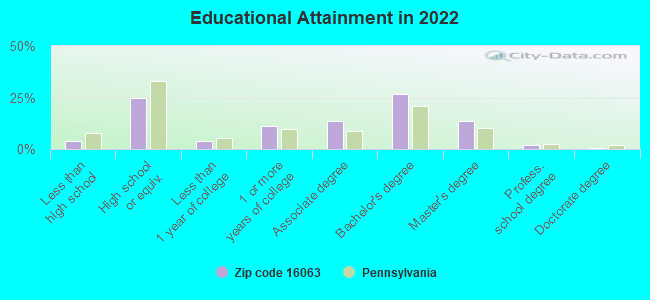
Students in private undergraduate colleges: 60
Here:
24.3%
Pennsylvania:
39.8%
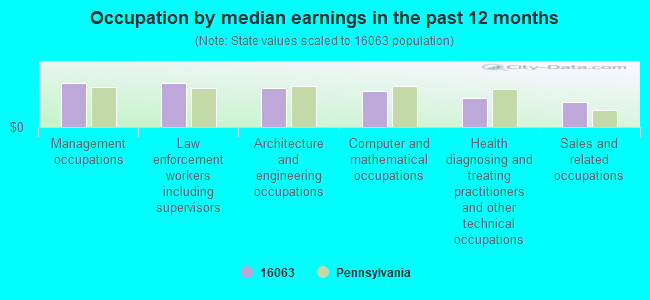
Occupation by median earnings in the past 12 months ($)
101,400Management occupations
100,662Law enforcement workers including supervisors
90,168Architecture and engineering occupations
83,840Computer and mathematical occupations
66,298Health diagnosing and treating practitioners and other technical occupations
58,592Sales and related occupations
Companies with federal contracts located in this zip code (ZELIENOPLE, PA):
RITTER TECHNOLOGY LLC (100 WILLIAMS DRIVE; small business) : $435,425 in 9 contractsfrom 2000 to 2003
Contracts for Lubrication and Fuel Dispensing Equipment, Hose and Flexible Tubing by Navy, Defense Logistics Agency Signed by year:2000: $35,565; 2001: $249,240; 2002: $75,310; 2003: $75,310; 2004: $0; 2005: $0; 2006: $0.
Biggest contracts:
$75,310 with Navy for Lubrication and Fuel Dispensing Equipment. Taking place in NY. Signed on 2003-07-31. Completion date: 2004-01-07.
$75,310, same as above.Signed on 2002-03-14. Completion date: 2002-07-11.
$54,500 with Defense Logistics Agency for Lubrication and Fuel Dispensing Equipment. Signed on 2001-04-05. Completion date: 2001-11-05.
$44,840, same as above.Signed on 2001-09-15. Completion date: 2002-02-01.
UNION CHILL MAT CO (RR 588; small business) 25 employees, $2500000 revenue. Woman Owned Business: $58,005 in 13 contractsfrom 2003 to 2004
Contracts for Miscellaneous Service and Trade Equipment by Bureau of Prisoners/Federal Prison System Signed by year:2000: $0; 2001: $0; 2002: $0; 2003: $21,000; 2004: $37,005; 2005: $0; 2006: $0.
Biggest contracts:
$8,670 with Bureau of Prisoners/Federal Prison System for Miscellaneous Service and Trade Equipment. Signed on 2004-08-24. Completion date: 2004-12-31.
$5,000, same as above.Signed on 2003-05-15. Completion date: 2004-04-15.
$4,335, same as above.Signed on 2004-08-24. Completion date: 2004-12-31.
$4,000, same as above.Signed on 2003-10-30. Completion date: 2004-04-30.
RITTER TECHNOLOGY LLC (100 WILLIAMS DRIVE; small business) : $56,012 in 5 contractsfrom 2004 to 2005
Contracts for Aircraft Launching Equipment, Miscellaneous Special Industry Machinery, Power and Hand Pumps by Navy, Army Signed by year:2000: $0; 2001: $0; 2002: $0; 2003: $0; 2004: $31,054; 2005: $24,958; 2006: $0.
Biggest contracts:
$27,919 with Navy for Aircraft Launching Equipment. Signed on 2004-08-30. Completion date: 2004-10-08.
$10,284 with Army for Miscellaneous Special Industry Machinery. Signed on 2005-09-20. Completion date: 2005-10-21.
$7,419 with Navy for Miscellaneous Special Industry Machinery. Signed on 2005-01-24. Completion date: 2005-02-28.
$7,255, same as above.Signed on 2005-05-25. Completion date: 2005-02-28.
UNITED DOMINION INDUSTRIES INC (U S RTE 19N)
$45,040 with Navy for Plastics Fabricated Materials. Signed on 2000-11-13. Completion date: 2001-03-31.
IN-SYNCH SYSTEMS LLC (119 WEST NEW CASTLE STREET; small business) : $42,670 in 2 contractsin 2006
$41,470 with Army for Office Information System Equipment. Signed on 2006-03-02. Completion date: 2006-09-30.
$1,200, same as above.Signed on 2006-04-06. Completion date: 2006-09-30.
MARKOVITZ ENTERPRISES INC (100 BADGER DR) : $29,235 in 3 contractsfrom 2003 to 2004
$19,188 with Army for Metal Finishing Equipment. Signed on 2004-07-01. Completion date: 2004-08-02.
$5,808 with U.S. Army Corps of Engineers - civil program financing only for Iron and Steel Scrap. Signed on 2003-09-25. Completion date: 2003-11-07.
$4,239 with NASA for . Signed on 2004-06-10. Completion date: 2004-07-10.
C M R USA LLC (129 MC CARRELL LANE)
$8,822 with Navy for Non-nuclear Ship Repair (West) Ship repair (including overhauls and conversions) performed on. non-nuclear propelled and nonpropelled ships west of the 108th meridian. Taking place in CA. Signed on 2005-01-31. Completion date: 2005-04-25.
ROBINSON INDUSTRIES INC (400 ROBINSON DR)
$7,650 with Army for Fans, Air Circulators, and Blower Equipment. Taking place in UT. Signed on 2004-04-13. Completion date: 2004-05-21.
Top industries in this zip code by the number of employees in 2005:
Health Care and Social Assistance: Residential Mental Health and Substance Abuse Facilities (250-499 employees: 1 establishment)
Health Care and Social Assistance: Continuing Care Retirement Communities (250-499: 1)


 Nearest zip codes: 16066, 16033, 16037, 16024, 15086, 15074.