Estimated zip code population in 2022: 15,784 Zip code population in 2010: 17,185 Zip code population in 2000: 17,821
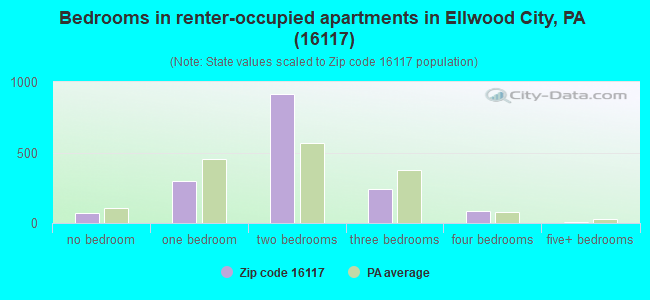
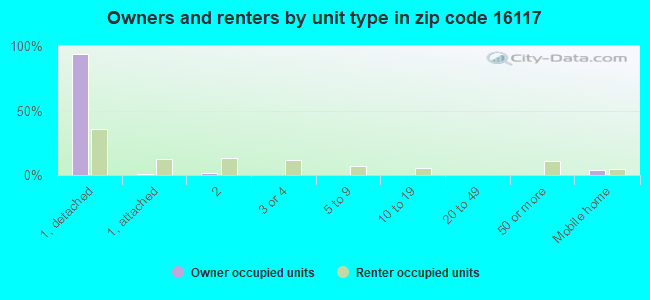
Houses and condos: 7,978 Renter-occupied apartments: 1,608
% of renters here:
22%
State:
31%
March 2022 cost of living index in zip code 16117: 83.8 (less than average, U.S. average is 100)
Land area: 36.8 sq. mi. Water area: 0.6 sq. mi.
Population density: 429 people per square mile
(low).
OSM Map
General Map
Google Map
MSN Map
OSM Map
General Map
Google Map
MSN Map
OSM Map
General Map
Google Map
MSN Map
OSM Map
General Map
Google Map
MSN Map
Please wait while loading the map...
Real estate property taxes paid for housing units in 2022:
This zip code:
1.3% ($1,934)
Pennsylvania:
1.3% ($3,094)
Median real estate property taxes paid for housing units with mortgages in 2022: $2,027 (1.3%) Median real estate property taxes paid for housing units with no mortgage in 2022: $1,832 (1.4%)
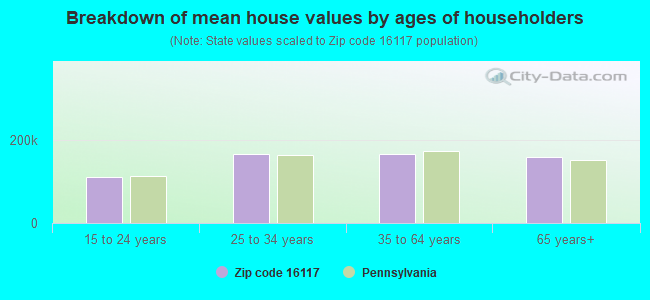
Estimated median house/condo value in 2022: $144,022
16117:
$144,022
Pennsylvania:
$245,500
According to our research of Pennsylvania and other state lists, there were 23 registered sex offenders living in 16117 zip code as of April 27, 2024. The ratio of all residents to sex offenders in zip code 16117 is 762 to 1. The ratio of registered sex offenders to all residents in this zip code is lower than the state average.
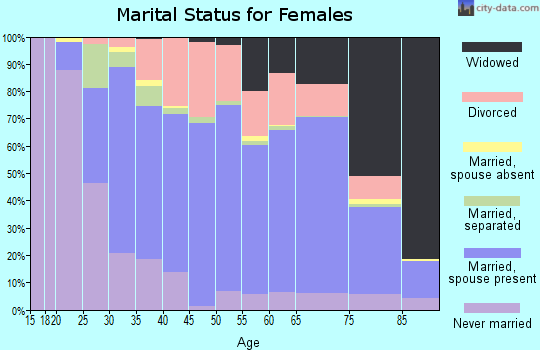
Median resident age:
This zip code:
48.6 years
Pennsylvania median age:
40.9 years
Average household size:
This zip code:
2.1 people
Pennsylvania:
2.4 people
Averages for the 2020 tax year for zip code 16117, filed in 2021:
Average Adjusted Gross Income (AGI) in 2020: $53,191 (Individual Income Tax Returns)
Here:
$53,191
State:
$75,707
Salary/wage: $46,100 (reported on 81.2% of returns)
Here:
$46,100
State:
$62,806
(% of AGI for various income ranges: 973.0% for AGIs below $25k, 3322.0% for AGIs $25k-50k, 5931.7% for AGIs $50k-75k, 8656.3% for AGIs $75k-100k, 14821.2% for AGIs $100k-200k, 50642.5% for AGIs over 200k)
Taxable interest for individuals: $855 (reported on 23.8% of returns)
This zip code:
$855
Pennsylvania:
$1,633
(% of AGI for various income ranges: 14.5% for AGIs below $25k, 10.5% for AGIs $25k-50k, 26.5% for AGIs $50k-75k, 35.2% for AGIs $75k-100k, 51.5% for AGIs $100k-200k, 1017.5% for AGIs over 200k)
Ordinary dividends: $3,378 (reported on 16.2% of returns)
Here:
$3,378
State:
$7,382
(% of AGI for various income ranges: 28.4% for AGIs below $25k, 21.0% for AGIs $25k-50k, 48.6% for AGIs $50k-75k, 54.8% for AGIs $75k-100k, 279.7% for AGIs $100k-200k, 2487.5% for AGIs over 200k)
Net capital gain/loss in AGI: +$12,296 (reported on 12.5% of returns)
Here:
+$12,296
State:
+$23,522
(% of AGI for various income ranges: 12.0% for AGIs below $25k, 19.4% for AGIs $25k-50k, 58.0% for AGIs $50k-75k, 129.5% for AGIs $75k-100k, 420.0% for AGIs $100k-200k, 20650.0% for AGIs over 200k)
Profit/loss from business: +$11,437 (reported on 10.6% of returns)
Here:
+$11,437
State:
+$16,274
(% of AGI for various income ranges: 74.8% for AGIs below $25k, 91.5% for AGIs $25k-50k, 137.9% for AGIs $50k-75k, 183.0% for AGIs $75k-100k, 487.5% for AGIs $100k-200k, 3230.0% for AGIs over 200k)
Taxable individual retirement arrangement distribution: $13,836 (reported on 11.6% of returns)
16117:
$13,836
Pennsylvania:
$18,583
(% of AGI for various income ranges: 110.6% for AGIs below $25k, 100.7% for AGIs $25k-50k, 222.6% for AGIs $50k-75k, 284.9% for AGIs $75k-100k, 817.8% for AGIs $100k-200k)
Total itemized deductions: $29,029 (reported on 2.0% of returns)
Here:
$29,029
State:
$34,850
(% of AGI for various income ranges: 41.4% for AGIs $25k-50k, 90.5% for AGIs $50k-75k, 95.7% for AGIs $75k-100k, 210.3% for AGIs $100k-200k, 2982.5% for AGIs over 200k)
Charity contributions: $11,538 (reported on 1.5% of returns)
Here:
$11,538
State:
$12,392
(% of AGI for various income ranges: 18.0% for AGIs $50k-75k, 26.3% for AGIs $75k-100k, 63.4% for AGIs $100k-200k, 1822.5% for AGIs over 200k)
Taxes paid: $6,050 (reported on 2.1% of returns)
16117:
$6,050
State:
$8,200
(% of AGI for various income ranges: 4.8% for AGIs below $25k, 18.9% for AGIs $50k-75k, 25.1% for AGIs $75k-100k, 62.9% for AGIs $100k-200k, 572.5% for AGIs over 200k)
Earned income credit: $2,023 (reported on 13.0% of returns)
Here:
$2,023
State:
$2,100
(% of AGI for various income ranges: 62.8% for AGIs below $25k, 52.2% for AGIs $25k-50k, 1.3% for AGIs $50k-75k)
Percentage of individuals using paid preparers for their 2020 taxes: 94.0%
Here:
94%
State:
92%
(% for various income ranges: 91.8% for AGIs below $25k, 95.7% for AGIs $25k-50k, 94.2% for AGIs $50k-75k, 94.1% for AGIs $75k-100k, 95.0% for AGIs $100k-200k, 100.0% for AGIs over 200k)
Averages for the 2012 tax year for zip code 16117, filed in 2013:
Average Adjusted Gross Income (AGI) in 2012: $47,234 (Individual Income Tax Returns)
Here:
$47,234
State:
$61,346
Salary/wage: $40,527 (reported on 83.4% of returns)
Here:
$40,527
State:
$51,902
(% of AGI for various income ranges: 69.2% for AGIs below $25k, 80.5% for AGIs $25k-50k, 81.4% for AGIs $50k-75k, 80.0% for AGIs $75k-100k, 76.3% for AGIs $100k-200k, 28.9% for AGIs over 200k)
Taxable interest for individuals: $809 (reported on 30.7% of returns)
This zip code:
$809
Pennsylvania:
$1,588
(% of AGI for various income ranges: 1.4% for AGIs below $25k, 0.4% for AGIs $25k-50k, 0.4% for AGIs $50k-75k, 0.3% for AGIs $75k-100k, 0.5% for AGIs $100k-200k, 0.4% for AGIs over 200k)
Ordinary dividends: $6,139 (reported on 19.0% of returns)
Here:
$6,139
State:
$5,827
(% of AGI for various income ranges: 1.6% for AGIs below $25k, 0.7% for AGIs $25k-50k, 0.5% for AGIs $50k-75k, 0.6% for AGIs $75k-100k, 1.2% for AGIs $100k-200k, 12.6% for AGIs over 200k)
Net capital gain/loss in AGI: +$2,809 (reported on 10.9% of returns)
Here:
+$2,809
State:
+$14,495
(% of AGI for various income ranges: 0.2% for AGIs $25k-50k, 0.5% for AGIs $75k-100k, 0.7% for AGIs $100k-200k, 2.7% for AGIs over 200k)
Profit/loss from business: +$12,206 (reported on 11.3% of returns)
Here:
+$12,206
State:
+$16,268
(% of AGI for various income ranges: 4.4% for AGIs below $25k, 2.4% for AGIs $25k-50k, 1.1% for AGIs $50k-75k, 2.1% for AGIs $75k-100k, 3.3% for AGIs $100k-200k, 5.6% for AGIs over 200k)
Taxable individual retirement arrangement distribution: $9,714 (reported on 11.9% of returns)
16117:
$9,714
Pennsylvania:
$14,550
(% of AGI for various income ranges: 4.7% for AGIs below $25k, 2.6% for AGIs $25k-50k, 2.2% for AGIs $50k-75k, 2.1% for AGIs $75k-100k, 2.3% for AGIs $100k-200k, 1.7% for AGIs over 200k)
Self-employment retirement plans: $13,950 (reported on 0.2% of returns)
16117:
$13,950
Pennsylvania:
$20,922
Total itemized deductions: $18,052 (17% of AGI, reported on 17.9% of returns)
Here:
$18,052
State:
$23,538
Here:
17.1% of AGI
State:
18.4% of AGI
(% of AGI for various income ranges: 4.2% for AGIs below $25k, 4.9% for AGIs $25k-50k, 6.0% for AGIs $50k-75k, 7.7% for AGIs $75k-100k, 9.4% for AGIs $100k-200k, 7.9% for AGIs over 200k)
Charity contributions: $3,662 (reported on 13.7% of returns)
Here:
$3,662
State:
$4,025
(% of AGI for various income ranges: 0.4% for AGIs below $25k, 0.6% for AGIs $25k-50k, 0.8% for AGIs $50k-75k, 1.0% for AGIs $75k-100k, 1.6% for AGIs $100k-200k, 1.9% for AGIs over 200k)
Taxes paid: $6,700 (reported on 17.9% of returns)
16117:
$6,700
State:
$9,982
(% of AGI for various income ranges: 0.8% for AGIs below $25k, 1.3% for AGIs $25k-50k, 1.9% for AGIs $50k-75k, 2.9% for AGIs $75k-100k, 4.2% for AGIs $100k-200k, 3.7% for AGIs over 200k)
Earned income credit: $2,021 (reported on 15.7% of returns)
Here:
$2,021
State:
$2,106
(% of AGI for various income ranges: 4.7% for AGIs below $25k, 1.1% for AGIs $25k-50k)
Percentage of individuals using paid preparers for their 2012 taxes: 62.3%
Here:
62%
State:
53%
(% for various income ranges: 59.2% for AGIs below $25k, 61.7% for AGIs $25k-50k, 64.7% for AGIs $50k-75k, 67.6% for AGIs $75k-100k, 65.1% for AGIs $100k-200k, 90.9% for AGIs over 200k)
Averages for the 2004 tax year for zip code 16117, filed in 2005:
Average Adjusted Gross Income (AGI) in 2004: $34,638 (Individual Income Tax Returns)
Here:
$34,638
State:
$48,049
Salary/wage: $32,555 (reported on 84.1% of returns)
Here:
$32,555
State:
$42,646
(% of AGI for various income ranges: 79.1% for AGIs below $10k, 70.8% for AGIs $10k-25k, 82.8% for AGIs $25k-50k, 85.4% for AGIs $50k-75k, 84.0% for AGIs $75k-100k, 65.5% for AGIs over 100k)
Taxable interest for individuals: $1,148 (reported on 45.1% of returns)
This zip code:
$1,148
Pennsylvania:
$1,657
(% of AGI for various income ranges: 4.8% for AGIs below $10k, 2.9% for AGIs $10k-25k, 1.2% for AGIs $25k-50k, 1.0% for AGIs $50k-75k, 0.8% for AGIs $75k-100k, 1.5% for AGIs over 100k)
Taxable dividends: $2,016 (reported on 24.0% of returns)
Here:
$2,016
State:
$3,566
(% of AGI for various income ranges: 2.4% for AGIs below $10k, 1.4% for AGIs $10k-25k, 0.8% for AGIs $25k-50k, 0.7% for AGIs $50k-75k, 1.3% for AGIs $75k-100k, 3.4% for AGIs over 100k)
Net capital gain/loss: +$2,596 (reported on 15.7% of returns)
Here:
+$2,596
State:
+$9,716
(% of AGI for various income ranges: -0.6% for AGIs below $10k, 0.7% for AGIs $10k-25k, 0.4% for AGIs $25k-50k, 0.7% for AGIs $50k-75k, 1.2% for AGIs $75k-100k, 4.0% for AGIs over 100k)
Profit/loss from business: +$9,797 (reported on 12.8% of returns)
Here:
+$9,797
State:
+$14,267
(% of AGI for various income ranges: 4.6% for AGIs below $10k, 4.3% for AGIs $10k-25k, 2.7% for AGIs $25k-50k, 1.3% for AGIs $50k-75k, 3.5% for AGIs $75k-100k, 7.9% for AGIs over 100k)
IRA payment deduction: $2,603 (reported on 2.9% of returns)
16117:
$2,603
Pennsylvania:
$2,903
(% of AGI for various income ranges: 0.3% for AGIs below $10k, 0.2% for AGIs $10k-25k, 0.3% for AGIs $25k-50k, 0.2% for AGIs $50k-75k, 0.1% for AGIs $75k-100k, 0.1% for AGIs over 100k)
Self-employed pension: $14,300 (reported on 0.4% of returns)
Here:
$14,300
Pennsylvania:
$14,674
Total itemized deductions: $15,268 (22% of AGI, reported on 17.9% of returns)
Here:
$15,268
State:
$18,804
Here:
21.5% of AGI
State:
19.5% of AGI
(% of AGI for various income ranges: 4.0% for AGIs below $10k, 4.7% for AGIs $10k-25k, 6.8% for AGIs $25k-50k, 7.9% for AGIs $50k-75k, 10.2% for AGIs $75k-100k, 11.1% for AGIs over 100k)
Charity contributions deductions: $2,573 (3% of AGI, reported on 14.9% of returns)
Here:
$2,573
State:
$3,337
Here:
3.4% of AGI
State:
3.3% of AGI
(% of AGI for various income ranges: 0.2% for AGIs below $10k, 0.4% for AGIs $10k-25k, 0.7% for AGIs $25k-50k, 1.0% for AGIs $50k-75k, 1.5% for AGIs $75k-100k, 2.3% for AGIs over 100k)
Total tax: $4,378 (reported on 71.9% of returns)
16117:
$4,378
State:
$8,008
(% of AGI for various income ranges: 2.0% for AGIs below $10k, 4.1% for AGIs $10k-25k, 6.7% for AGIs $25k-50k, 8.5% for AGIs $50k-75k, 10.5% for AGIs $75k-100k, 17.9% for AGIs over 100k)
Earned income credit: $1,544 (reported on 14.7% of returns)
Here:
$1,544
State:
$1,643
Percentage of individuals using paid preparers for their 2004 taxes: 61.1%
Here:
61%
State:
56%
(% for various income ranges: 53.4% for AGIs below $10k, 61.8% for AGIs $10k-25k, 62.8% for AGIs $25k-50k, 64.9% for AGIs $50k-75k, 64.4% for AGIs $75k-100k, 73.4% for AGIs over 100k)
Likely homosexual households (counted as self-reported same-sex unmarried-partner households)
Lesbian couples: 0.1% of all households
Gay men: 0.0% of all households
Household received Food Stamps/SNAP in the past 12 months: 1,145 Household did not receive Food Stamps/SNAP in the past 12 months: 6,252
Women who had a birth in the past 12 months: 200 (115 now married, 79 unmarried) Women who did not have a birth in the past 12 months: 2,608 (1,134 now married, 1,470 unmarried)
Housing units in zip code 16117 with a mortgage: 3,154 (334 second mortgage, 4 home equity loan, 318 both second mortgage and home equity loan) Houses without a mortgage: 317
Median monthly owner costs for units with a mortgage: $1,164 Median monthly owner costs for units without a mortgage: $539
Residents with income below the poverty level in 2022:
This zip code:
7.8%
Whole state:
11.8%
Residents with income below 50% of the poverty level in 2022:
This zip code:
3.9%
Whole state:
6.1%
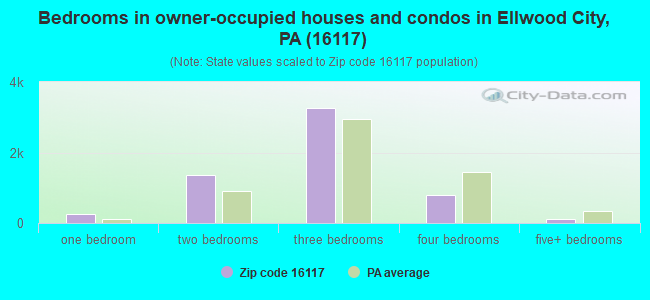
Median number of rooms in houses and condos:
Here:
6.2
State:
6.8
Median number of rooms in apartments:
Here:
4.3
State:
4.3
Notable locations in this zip code not listed on our city pages
Notable locations in zip code 16117: Slippery Rock (A), Heinz Camp (B), Camp Allegheny (C), Pine Valley Bible Camp (D), Ellwood Junction (E), Ellwood City Volunteer Fire Department (F), Wayne Township Volunteer Fire Company (G), Wurtemburg - Perry Volunteer Fire Department (H), Franklin Township Volunteer Fire Department Station 70 - 1 (I), North Sewickley Fire Department 2 Station 13 (J). Display/hide their locations on the map
Cemeteries: Locust Grove Cemetery (1), Wurtemburg Cemetery (2), Saint Agatha Cemetery (3), Providence Cemetery (4), Mount Hope Cemetery (5). Display/hide their locations on the map
Streams, rivers, and creeks: Hell Run (A), Squaw Run (B), Duck Run (C), Slippery Rock Creek (D), Skunk Run (E), Connoquenessing Creek (F), Brush Creek (G). Display/hide their locations on the map
1,464 married couples with children.
813 single-parent households (187 men, 626 women).
97.5% of residents of 16117 zip code speak English at home.
1.0% of residents speak Spanish at home (100% very well).
0.9% of residents speak other Indo-European language at home (50% very well, 33% well, 17% not well).
0.2% of residents speak Asian or Pacific Island language at home (100% very well).
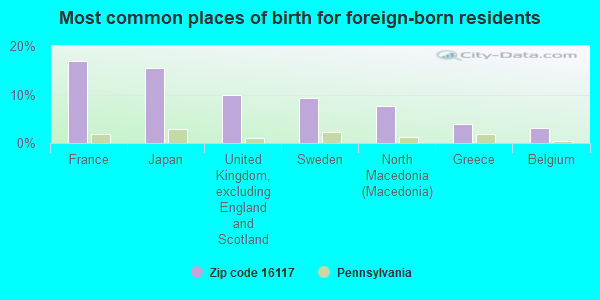
Foreign born population: 133 (0.8%) (100.0% of them are naturalized citizens)
This zip code:
0.8%
Whole state:
7.5%
17%France
15%Japan
10%United Kingdom, excluding England and Scotland
9%Sweden
8%North Macedonia (Macedonia)
4%Greece
3%Belgium
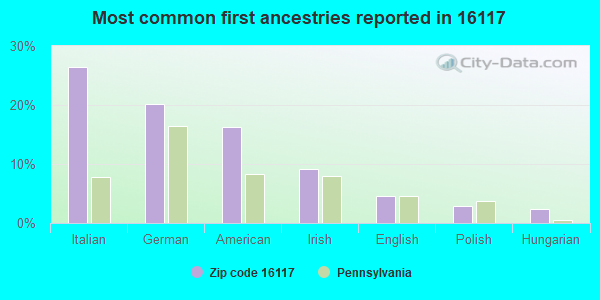
26%Italian
20%German
16%American
9%Irish
5%English
3%Polish
2%Hungarian
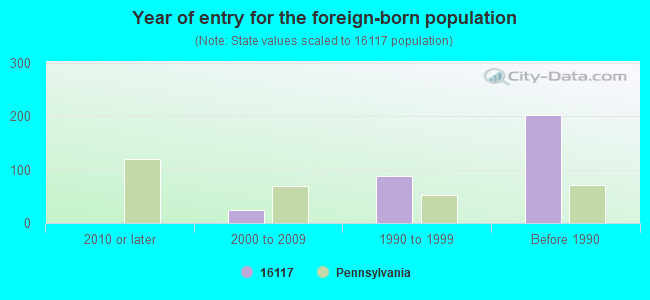
Year of entry for the foreign-born population
02010 or later
242000 to 2009
881990 to 1999
202Before 1990
Facilities with environmental interests located in this zip code:
AMER STEEL (SIXTH & SPRING STS in ELLWOOD CITY, PA)
STATE MASTER (Pennsylvania database) - RCRIS-PAD004341095, HAZARDOUS WASTE PROGRAM (Resource Conservation and Recovery Act (tracking hazardous waste)) Business SIC classification: BOLTS, NUTS, SCREWS, RIVETS, AND WASHERS; MISCELLANEOUS FABRICATED WIRE PRODUCTS Business NAICS classification: OTHER FABRICATED WIRE PRODUCT MANUFACTURING.; BOLT, NUT, SCREW, RIVET, AND WASHER MANUFACTURING. Organizations: OPERNAME (CONTACT/OPERATOR)
, OWNERNAME (CONTACT/OWNER)
AEP ELLWOOD CITY (ROUTE 288 in ELLWOOD CITY, PA)
STATE MASTER (Pennsylvania database) - RCRIS-PAD987400504, HAZARDOUS WASTE PROGRAM Conditionally Exempt Small Quantity Generators, less than 100 kg/month of hazardous waste (Resource Conservation and Recovery Act (tracking hazardous waste)) - notification Organizations: AGWAY PETROLEUM CORP (CONTACT/OWNER)
, AGWAY PETROLEUM CORPORATION (CONTACT/OWNER)
Alternative names: AGWAY ENERGY PRODUCTS
BLAW KNOX CORPORATION (320 1ST STREET in ELLWOOD CITY, PA)
(Integrated Compliance Information System) - ICIS-03-1988-0048, FORMAL ENFORCEMENT ACTION COMPLIANCE ACTIVITY (Tracking inspections of insecticide, fungicide, and rodenticide, and toxic substances) Alternative names: AETNA STANDARD ENGINEERING COMPANY
ALLEGHENY LEATHER CARE (110 SIXTH STREET in ELLWOOD CITY, PA)
AIR MINOR (AIRS/AFS) Business SIC classification: DRYCLEANING PLANTS, EXCEPT RUG CLEANING
Housing units lacking complete plumbing facilities: 1.5% Housing units lacking complete kitchen facilities: 4.1%
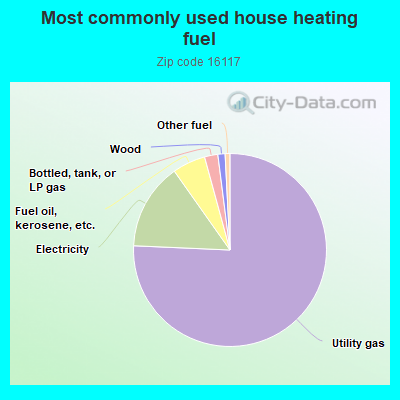
75.1%Utility gas
14.4%Electricity
5.5%Fuel oil, kerosene, etc.
2.2%Bottled, tank, or LP gas
1.2%Wood
0.8%Other fuel
Population in 1990: 19,193.
Place of birth for U.S.-born residents:
This state: 13,843
Northeast: 319
Midwest: 431
South: 525
West: 209
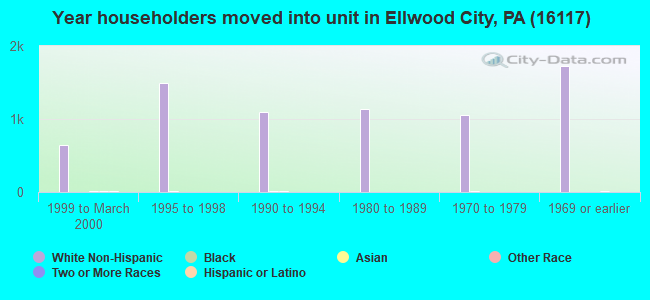
71% of the 16117 zip code residents lived in the same house 5 years ago. Out of people who lived in different houses, 55% lived in this county. Out of people who lived in different counties, 50% lived in Pennsylvania.
91% of the 16117 zip code residents lived in the same house 1 year ago. Out of people who lived in different houses, 39% moved from this county. Out of people who lived in different houses, 41% moved from different county within same state. Out of people who lived in different houses, 20% moved from different state. Out of people who lived in different houses, 0% moved from abroad.
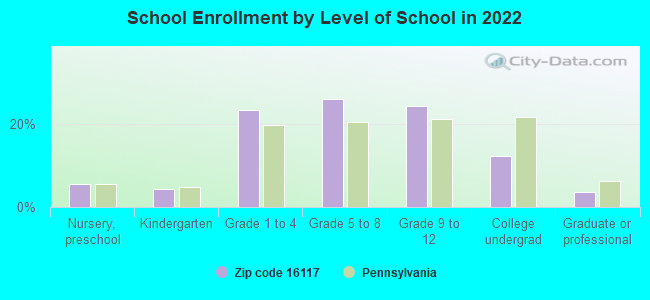
Private vs. public school enrollment:
Students in private schools in grades 1 to 8 (elementary and middle school): 62
Here:
5.0%
Pennsylvania:
15.7%
Students in private schools in grades 9 to 12 (high school): 15
Here:
2.5%
Pennsylvania:
13.4%
Students in private undergraduate colleges: 103
Here:
33.0%
Pennsylvania:
39.8%
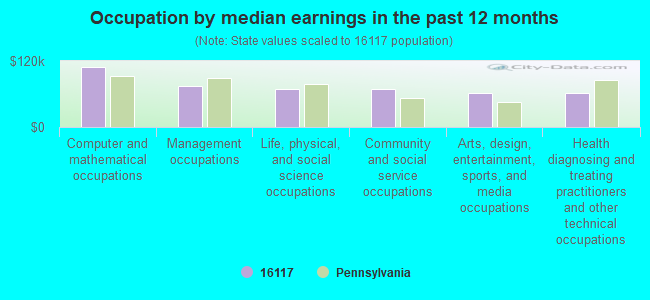
Occupation by median earnings in the past 12 months ($)
109,155Computer and mathematical occupations
73,849Management occupations
69,103Life, physical, and social science occupations
68,586Community and social service occupations
62,337Arts, design, entertainment, sports, and media occupations
60,993Health diagnosing and treating practitioners and other technical occupations
Companies with federal contracts located in this zip code (ELLWOOD CITY, PA):
ELLWOOD CITY FORGE (800 COMMERCIAL AVENUE) : $6,564,833 in 18 contractsfrom 2001 to 2004
Contracts for Guns, 75 mm through 125 mm, Maintenance, Repair and Rebuilding of Equipment -- Instruments and Laboratory Equipment, Guns, over 150 mm through 200 mm, Miscellaneous Weapons by Army Signed by year:2000: $0; 2001: $482,622; 2002: $2,776,811; 2003: $3,307,200; 2004: -$1,800; 2005: $0; 2006: $0.
Biggest contracts:
$1,521,312 with Army for Guns, 75 mm through 125 mm. Signed on 2002-01-16. Completion date: 2002-05-24.
$1,281,540, same as above.Signed on 2003-04-03. Completion date: 2003-07-19.
$1,107,912, same as above.Signed on 2003-04-03. Completion date: 2003-10-20.
$876,408, same as above.Signed on 2002-03-13. Completion date: 2002-10-28.
HALL INDUSTRIES INC (514 MECKLEM LANE; small business)
$116,800 with Navy for Aircraft Ground Servicing Equipment. Signed on 2003-07-28. Completion date: 2004-05-24.
APPLE OCCUPATIONAL HEALTH SERV (510 JAMISON AVENUE; small business) : $46,935 in 67 contractsfrom 2003 to 2006
Contracts for General Health Care Services by U.S. Army Corps of Engineers - civil program financing only, Army Signed by year:2000: $0; 2001: $0; 2002: $0; 2003: $53,165; 2004: -$15,930; 2005: $0; 2006: $9,700.
Biggest contracts:
$13,385 with U.S. Army Corps of Engineers - civil program financing only for General Health Care Services. Signed on 2003-02-12. Completion date: 2003-05-15.
$9,700 with Army for General Health Care Services. Signed on 2006-01-27. Completion date: 2006-09-01.
$7,010, same as above.Signed on 2005-02-04. Completion date: 2005-02-28.
$7,010 with U.S. Army Corps of Engineers - civil program financing only for General Health Care Services. Signed on 2005-02-04. Completion date: 2005-02-28.
APPROVED TOILET RENTALS INC (160 WOODROW DRIVE; small business) : $13,943 in 2 contractsin 2003
$8,784 with Army for Lease or Rental of Equipment -- Toiletries. Signed on 2003-10-01. Completion date: 2004-09-30.
$5,159 with Army for Lodging - Hotel/Motel. Signed on 2003-02-27. Completion date: 2003-09-30.
Top industries in this zip code by the number of employees in 2005:
Health Care and Social Assistance: General Medical and Surgical Hospitals (250-499 employees: 1 establishment)
2004 - 2018 National Fire Incident Reporting System (NFIRS) incidents
According to the data from the years 2004 - 2018 the average number of fires per year is 31. The highest number of reported fires - 67 took place in 2018, and the least - 11 in 2004. The data has a rising trend.
When looking into fire subcategories, the most reports belonged to: Structure Fires (65.2%), and Outside Fires (21.6%).
Fire incident types reported to NFIRS in Zip Code 16117

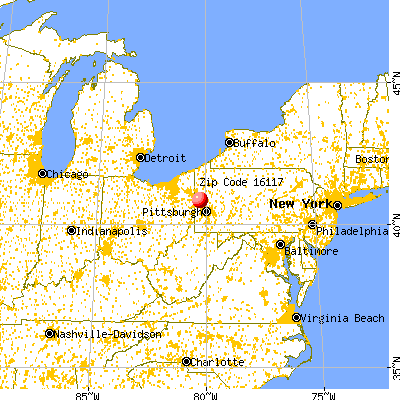


 Nearest zip codes: 16136, 16123, 16157, 16160, 16101, 15066.
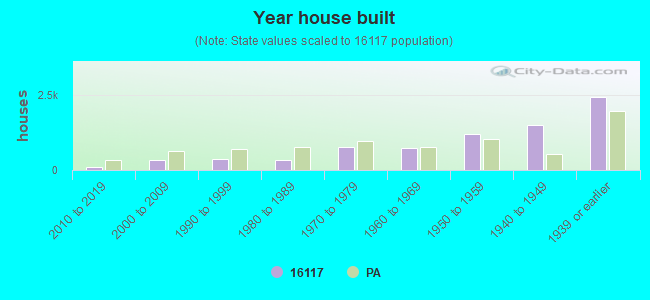


 According to the data from the years 2004 - 2018 the average number of fires per year is 31. The highest number of reported fires - 67 took place in 2018, and the least - 11 in 2004. The data has a rising trend.
 When looking into fire subcategories, the most reports belonged to: Structure Fires (65.2%), and Outside Fires (21.6%).