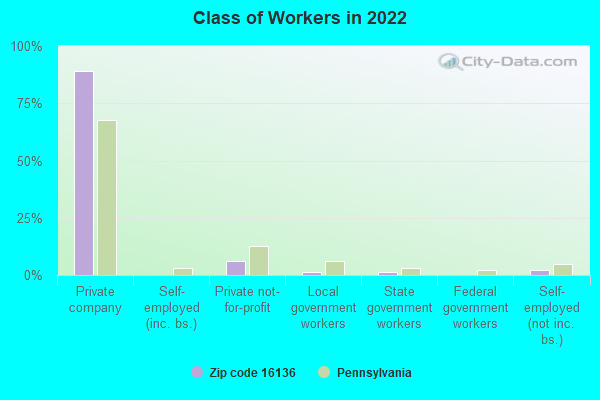
Estimated zip code population in 2022: 773 Zip code population in 2010: 801 Zip code population in 2000: 896
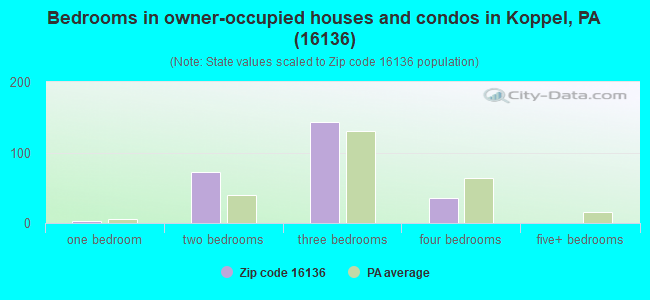
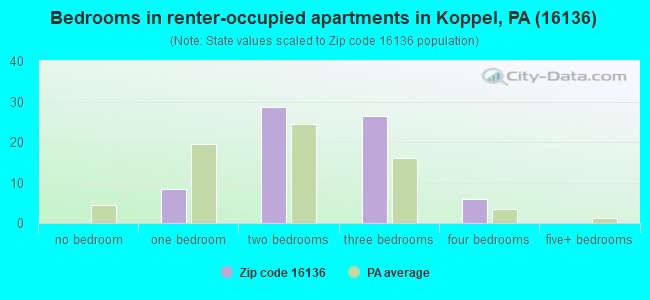
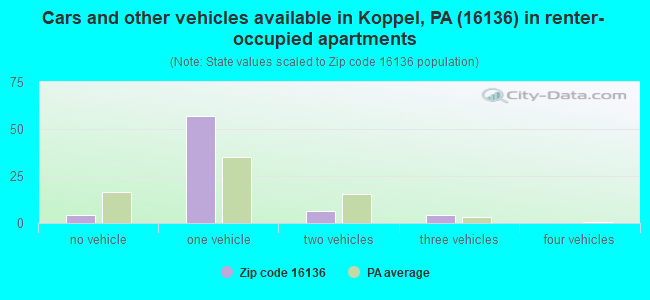
Houses and condos: 369 Renter-occupied apartments: 70
% of renters here:
22%
State:
31%
March 2022 cost of living index in zip code 16136: 88.9 (less than average, U.S. average is 100)
Land area: 0.7 sq. mi. Water area: 0.0 sq. mi.
Population density: 1,048 people per square mile
(low).
OSM Map
General Map
Google Map
MSN Map
OSM Map
General Map
Google Map
MSN Map
OSM Map
General Map
Google Map
MSN Map
OSM Map
General Map
Google Map
MSN Map
Please wait while loading the map...
Real estate property taxes paid for housing units in 2022:
This zip code:
1.8% ($1,863)
Pennsylvania:
1.3% ($3,094)
Median real estate property taxes paid for housing units with mortgages in 2022: $2,141 (2.0%) Median real estate property taxes paid for housing units with no mortgage in 2022: $1,442 (1.5%)
Business Search- 14 Million verified businesses
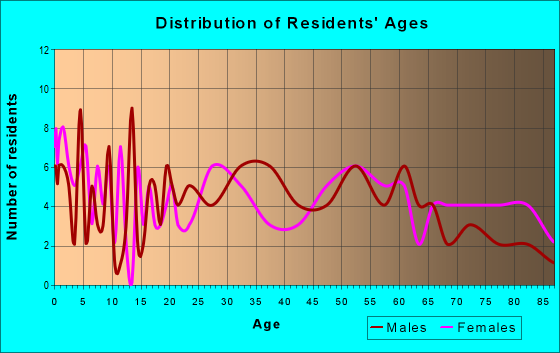
Males: 394
(50.9%)
Females: 379
(49.1%)
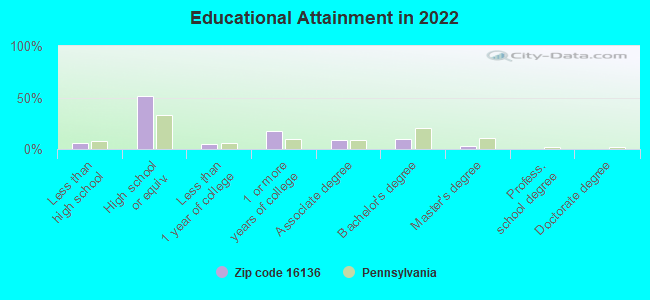
For population 25 years and over in 16136:
High school or higher: 92.6%
Bachelor's degree or higher: 12.6%
Graduate or professional degree: 3.1%
Unemployed: 9.2%
Mean travel time to work (commute): 24.4 minutes
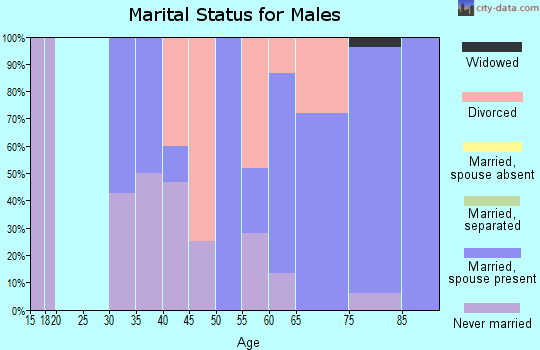
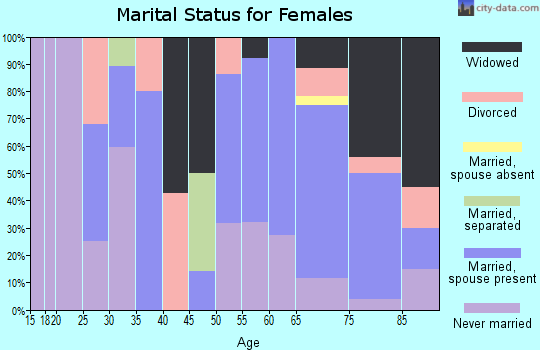
For population 15 years and over in 16136:
Never married: 28.4%
Now married: 46.9%
Separated: 0.7%
Widowed: 7.8%
Divorced: 16.1%
Zip code 16136 compared to state average:
Median house value significantly below state average.
Unemployed percentage above state average.
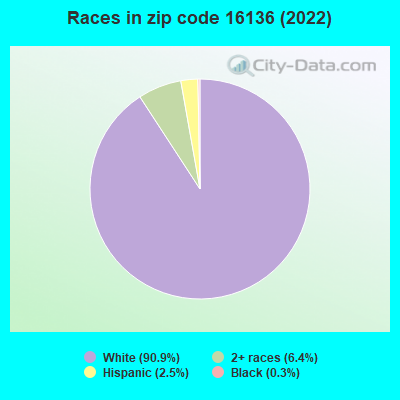
Black race population percentage significantly below state average.
Hispanic race population percentage significantly below state average.
Foreign-born population percentage significantly below state average.
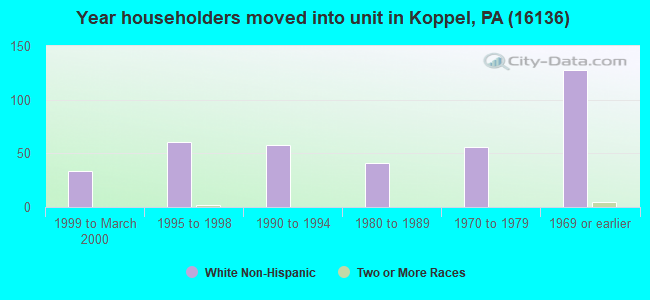
Length of stay since moving in below state average.
House age above state average.
Number of college students below state average.
Percentage of population with a bachelor's degree or higher significantly below state average.
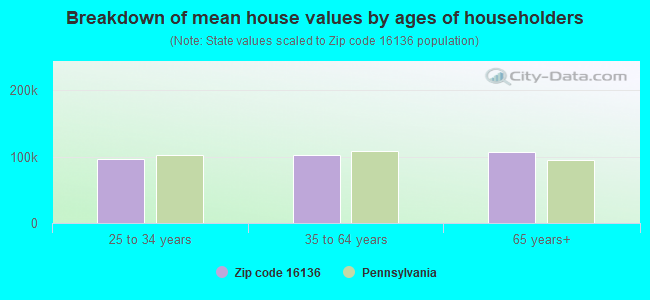
Estimated median house/condo value in 2022: $101,586
16136:
$101,586
Pennsylvania:
$245,500
According to our research of Pennsylvania and other state lists, there was 1 registered sex offender living in 16136 zip code as of April 27, 2024. The ratio of all residents to sex offenders in zip code 16136 is 742 to 1. The ratio of registered sex offenders to all residents in this zip code is lower than the state average.
Median resident age:
This zip code:
39.9 years
Pennsylvania median age:
40.9 years
Average household size:
This zip code:
2.4 people
Pennsylvania:
2.4 people
Averages for the 2004 tax year for zip code 16136, filed in 2005:
Average Adjusted Gross Income (AGI) in 2004: $28,595 (Individual Income Tax Returns)
Here:
$28,595
State:
$48,049
Salary/wage: $28,395 (reported on 81.5% of returns)
Here:
$28,395
State:
$42,646
(% of AGI for various income ranges: 62.9% for AGIs below $10k, 72.1% for AGIs $10k-25k, 89.3% for AGIs $25k-50k, 81.6% for AGIs $50k-75k, 72.8% for AGIs $75k-100k)
Taxable interest for individuals: $1,253 (reported on 38.3% of returns)
This zip code:
$1,253
Pennsylvania:
$1,657
(% of AGI for various income ranges: 4.5% for AGIs below $10k, 2.7% for AGIs $10k-25k, 1.3% for AGIs $25k-50k, 0.8% for AGIs $50k-75k, 2.3% for AGIs $75k-100k)
Taxable dividends: $681 (reported on 15.5% of returns)
Here:
$681
State:
$3,566
(% of AGI for various income ranges: 0.9% for AGIs below $10k, 0.5% for AGIs $10k-25k, 0.1% for AGIs $25k-50k, 0.9% for AGIs $50k-75k)
Profit/loss from business: +$3,129 (reported on 7.0% of returns)
Here:
+$3,129
State:
+$14,267
IRA payment deduction: $1,769 (reported on 2.9% of returns)
16136:
$1,769
Pennsylvania:
$2,903
Total itemized deductions: $11,853 (22% of AGI, reported on 7.7% of returns)
Here:
$11,853
State:
$18,804
Here:
21.7% of AGI
State:
19.5% of AGI
Charity contributions deductions: $1,467 (3% of AGI, reported on 6.8% of returns)
Here:
$1,467
State:
$3,337
Here:
2.9% of AGI
State:
3.3% of AGI
Total tax: $3,138 (reported on 68.7% of returns)
16136:
$3,138
State:
$8,008
(% of AGI for various income ranges: 2.4% for AGIs below $10k, 3.4% for AGIs $10k-25k, 7.4% for AGIs $25k-50k, 9.4% for AGIs $50k-75k, 10.9% for AGIs $75k-100k)
Earned income credit: $1,538 (reported on 18.0% of returns)
Here:
$1,538
State:
$1,643
Percentage of individuals using paid preparers for their 2004 taxes: 58.6%
Here:
59%
State:
56%
(% for various income ranges: 51.8% for AGIs below $10k, 59.7% for AGIs $10k-25k, 56.5% for AGIs $25k-50k, 65.3% for AGIs $50k-75k, 82.6% for AGIs $75k-100k)
Household received Food Stamps/SNAP in the past 12 months: 120 Household did not receive Food Stamps/SNAP in the past 12 months: 210
Women who had a birth in the past 12 months: 11 (12 now married, 0 unmarried) Women who did not have a birth in the past 12 months: 139 (57 now married, 81 unmarried)
Housing units in zip code 16136 with a mortgage: 139 (5 second mortgage, 3 both second mortgage and home equity loan) Houses without a mortgage: 8
Median monthly owner costs for units with a mortgage: $986 Median monthly owner costs for units without a mortgage: $461
Residents with income below the poverty level in 2022:
This zip code:
6.2%
Whole state:
11.8%
Residents with income below 50% of the poverty level in 2022:
This zip code:
3.9%
Whole state:
6.1%
Median number of rooms in houses and condos:
Here:
5.5
State:
6.8
Median number of rooms in apartments:
Here:
4.8
State:
4.3
Notable locations in this zip code not listed on our city pages
Size of family households: 108 2-persons, 42 3-persons, 51 4-persons, 12 5-persons
Size of nonfamily households: 92 1-person, 18 2-persons
90 married couples with children.
59 single-parent households (9 men, 50 women).
99.3% of residents of 16136 zip code speak English at home.
Foreign born population: 0 (0.0%)
:
0.0%
Whole state:
7.5%
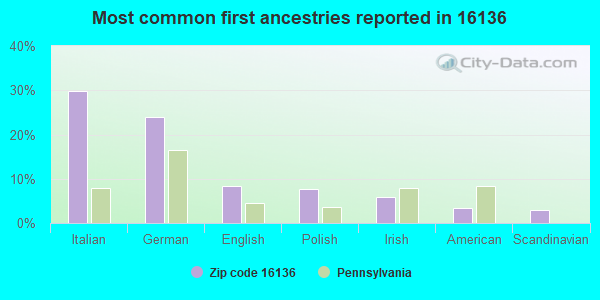
30%Italian
24%German
8%English
8%Polish
6%Irish
3%American
3%Scandinavian
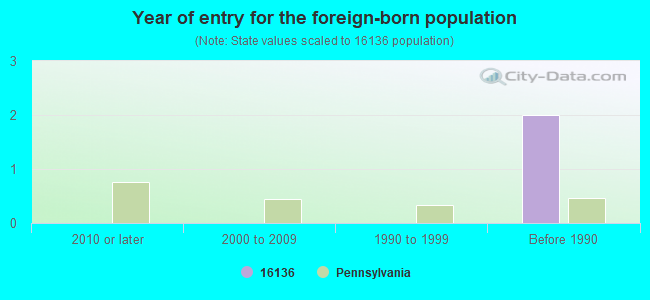
Year of entry for the foreign-born population
02010 or later
02000 to 2009
01990 to 1999
2Before 1990
Facilities with environmental interests located in this zip code:
BABCOCK & WILCOX EAF LANDFILL (6TH & MOUNT ST in KOPPEL, PA)
HAZARDOUS WASTE BIENNIAL REPORTER (Resource Conservation and Recovery Act (tracking hazardous waste)) Large Quantity Generators, more that 1000 kg of hazardous waste/month (Resource Conservation and Recovery Act (tracking hazardous waste)) - notification TSD (Resource Conservation and Recovery Act (tracking hazardous waste)) - notification Business NAICS classification: OTHER COMMUNICATION AND ENERGY WIRE MANUFACTURING. Organizations: MCDERMOTT INTERNATIONAL INC (CONTACT/OWNER)
Alternative names: B&W CLOSED EAF DUST LANDFILL
Housing units lacking complete plumbing facilities: 2.6% Housing units lacking complete kitchen facilities: 7.2%
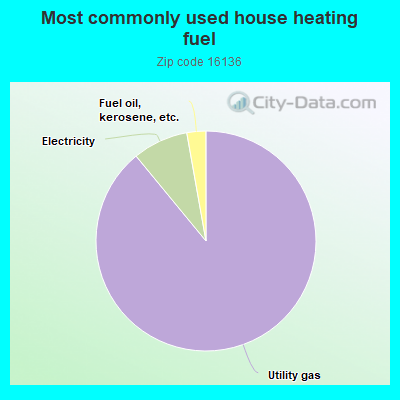
89.4%Utility gas
8.2%Electricity
2.8%Fuel oil, kerosene, etc.
Place of birth for U.S.-born residents:
This state: 652
Northeast: 7
Midwest: 36
South: 60
West: 10
75% of the 16136 zip code residents lived in the same house 5 years ago. Out of people who lived in different houses, 72% lived in this county. Out of people who lived in different counties, 50% lived in Pennsylvania.
96% of the 16136 zip code residents lived in the same house 1 year ago. Out of people who lived in different houses, 52% moved from this county. Out of people who lived in different houses, 57% moved from different state.
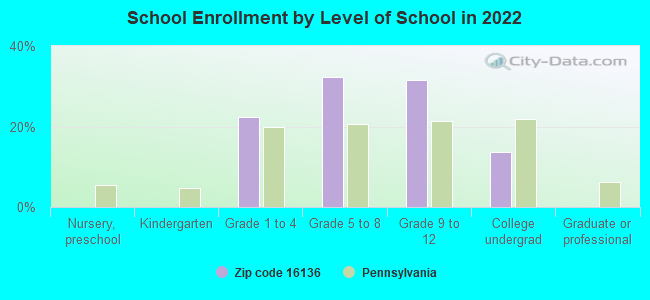
Private vs. public school enrollment:
Students in private schools in grades 1 to 8 (elementary and middle school): 3
Here:
4.2%
Pennsylvania:
15.7%
Students in private schools in grades 9 to 12 (high school):
Here:
0.0%
Pennsylvania:
13.4%
Students in private undergraduate colleges: 14
Here:
74.6%
Pennsylvania:
39.8%
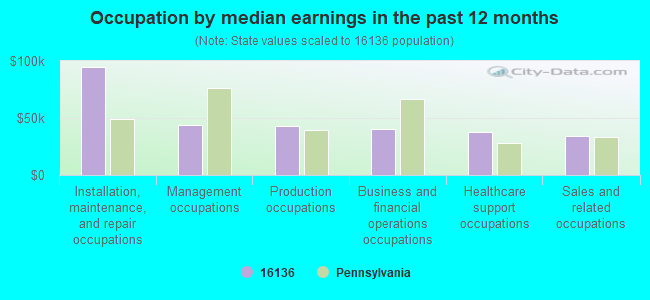
Occupation by median earnings in the past 12 months ($)
94,854Installation, maintenance, and repair occupations
43,629Management occupations
43,031Production occupations
40,570Business and financial operations occupations
37,394Healthcare support occupations
33,831Sales and related occupations
Top industries in this zip code by the number of employees in 2005:
Administrative and Support and Waste Management and Remediation Services: All Other Support Services (20-49 employees: 1 establishment)
Other Services (except Public Administration): Religious Organizations (5-9: 1)
Home Mortgage Disclosure Act Aggregated Statistics For Year 2009 (Based on 2 full tracts)
A) FHA, FSA/RHS & VA Home Purchase Loans
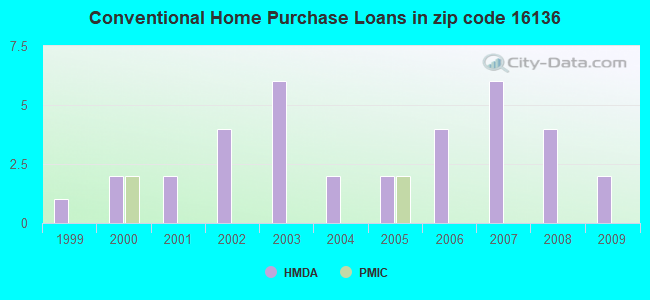
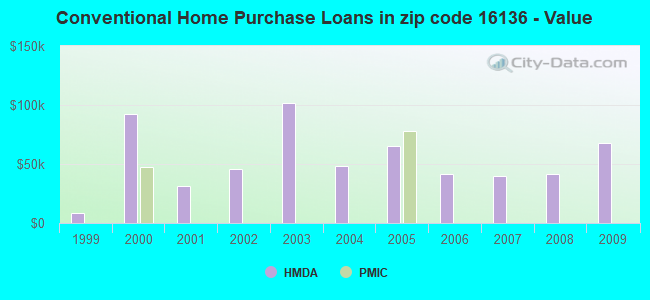
B) Conventional Home Purchase Loans
C) Refinancings
F) Non-occupant Loans on < 5 Family Dwellings (A B C & D)
Number
Average Value
Number
Average Value
Number
Average Value
Number
Average Value
LOANS ORIGINATED
4
$69,132
2
$68,160
8
$40,895
2
$54,525
APPLICATIONS APPROVED, NOT ACCEPTED
0
$0
0
$0
0
$0
0
$0
APPLICATIONS DENIED
0
$0
0
$0
2
$58,420
0
$0
APPLICATIONS WITHDRAWN
0
$0
0
$0
4
$33,105
2
$51,605
FILES CLOSED FOR INCOMPLETENESS
0
$0
0
$0
0
$0
0
$0
Aggregated Statistics For Year 2008 (Based on 2 full tracts)
B) Conventional Home Purchase Loans
C) Refinancings
D) Home Improvement Loans
Number
Average Value
Number
Average Value
Number
Average Value
LOANS ORIGINATED
4
$41,870
4
$75,948
2
$21,420
APPLICATIONS APPROVED, NOT ACCEPTED
0
$0
0
$0
0
$0
APPLICATIONS DENIED
0
$0
2
$68,160
0
$0
APPLICATIONS WITHDRAWN
0
$0
0
$0
0
$0
FILES CLOSED FOR INCOMPLETENESS
0
$0
0
$0
0
$0
Aggregated Statistics For Year 2007 (Based on 2 full tracts)
A) FHA, FSA/RHS & VA Home Purchase Loans
B) Conventional Home Purchase Loans
C) Refinancings
D) Home Improvement Loans
F) Non-occupant Loans on < 5 Family Dwellings (A B C & D)
G) Loans On Manufactured Home Dwelling (A B C & D)
Number
Average Value
Number
Average Value
Number
Average Value
Number
Average Value
Number
Average Value
Number
Average Value
LOANS ORIGINATED
2
$61,345
6
$39,597
2
$38,950
0
$0
2
$38,950
0
$0
APPLICATIONS APPROVED, NOT ACCEPTED
0
$0
2
$70,105
2
$45,765
0
$0
0
$0
0
$0
APPLICATIONS DENIED
2
$92,500
8
$50,389
8
$76,192
6
$10,387
0
$0
2
$16,555
APPLICATIONS WITHDRAWN
0
$0
2
$70,105
0
$0
0
$0
0
$0
0
$0
FILES CLOSED FOR INCOMPLETENESS
0
$0
0
$0
0
$0
0
$0
0
$0
0
$0
Aggregated Statistics For Year 2006 (Based on 2 full tracts)
A) FHA, FSA/RHS & VA Home Purchase Loans
B) Conventional Home Purchase Loans
C) Refinancings
D) Home Improvement Loans
F) Non-occupant Loans on < 5 Family Dwellings (A B C & D)
G) Loans On Manufactured Home Dwelling (A B C & D)
Number
Average Value
Number
Average Value
Number
Average Value
Number
Average Value
Number
Average Value
Number
Average Value
LOANS ORIGINATED
2
$57,450
4
$41,382
12
$35,702
4
$22,395
4
$22,395
2
$31,160
APPLICATIONS APPROVED, NOT ACCEPTED
0
$0
0
$0
4
$19,475
0
$0
0
$0
0
$0
APPLICATIONS DENIED
0
$0
2
$28,235
2
$109,055
2
$56,475
0
$0
0
$0
APPLICATIONS WITHDRAWN
0
$0
0
$0
0
$0
0
$0
0
$0
0
$0
FILES CLOSED FOR INCOMPLETENESS
0
$0
0
$0
0
$0
0
$0
0
$0
0
$0
Aggregated Statistics For Year 2005 (Based on 2 full tracts)
B) Conventional Home Purchase Loans
C) Refinancings
D) Home Improvement Loans
F) Non-occupant Loans on < 5 Family Dwellings (A B C & D)
Number
Average Value
Number
Average Value
Number
Average Value
Number
Average Value
LOANS ORIGINATED
2
$65,240
4
$73,515
2
$4,870
0
$0
APPLICATIONS APPROVED, NOT ACCEPTED
0
$0
2
$72,055
0
$0
0
$0
APPLICATIONS DENIED
0
$0
19
$75,641
2
$153,845
0
$0
APPLICATIONS WITHDRAWN
2
$66,210
4
$89,580
0
$0
2
$66,210
FILES CLOSED FOR INCOMPLETENESS
0
$0
0
$0
0
$0
0
$0
Aggregated Statistics For Year 2004 (Based on 2 full tracts)
A) FHA, FSA/RHS & VA Home Purchase Loans
B) Conventional Home Purchase Loans
C) Refinancings
D) Home Improvement Loans
E) Loans on Dwellings For 5+ Families
F) Non-occupant Loans on < 5 Family Dwellings (A B C & D)
Number
Average Value
Number
Average Value
Number
Average Value
Number
Average Value
Number
Average Value
Number
Average Value
LOANS ORIGINATED
2
$46,740
2
$48,685
8
$71,810
4
$51,120
2
$1,063,280
6
$73,677
APPLICATIONS APPROVED, NOT ACCEPTED
0
$0
4
$26,778
0
$0
0
$0
0
$0
0
$0
APPLICATIONS DENIED
0
$0
0
$0
8
$95,179
2
$69,135
0
$0
2
$69,135
APPLICATIONS WITHDRAWN
0
$0
0
$0
2
$77,895
2
$50,630
0
$0
2
$50,630
FILES CLOSED FOR INCOMPLETENESS
0
$0
0
$0
4
$71,568
0
$0
0
$0
0
$0
Aggregated Statistics For Year 2003 (Based on 2 full tracts)
B) Conventional Home Purchase Loans
C) Refinancings
D) Home Improvement Loans
Number
Average Value
Number
Average Value
Number
Average Value
LOANS ORIGINATED
6
$101,590
19
$65,084
0
$0
APPLICATIONS APPROVED, NOT ACCEPTED
0
$0
0
$0
0
$0
APPLICATIONS DENIED
2
$65,240
6
$79,518
2
$7,790
APPLICATIONS WITHDRAWN
4
$68,160
4
$79,842
2
$29,210
FILES CLOSED FOR INCOMPLETENESS
0
$0
0
$0
0
$0
Aggregated Statistics For Year 2002 (Based on 2 full tracts)
B) Conventional Home Purchase Loans
C) Refinancings
D) Home Improvement Loans
F) Non-occupant Loans on < 5 Family Dwellings (A B C & D)
Number
Average Value
Number
Average Value
Number
Average Value
Number
Average Value
LOANS ORIGINATED
4
$45,765
6
$40,247
2
$37,975
2
$38,950
APPLICATIONS APPROVED, NOT ACCEPTED
0
$0
0
$0
0
$0
0
$0
APPLICATIONS DENIED
0
$0
6
$76,273
2
$28,235
0
$0
APPLICATIONS WITHDRAWN
0
$0
2
$87,635
0
$0
0
$0
FILES CLOSED FOR INCOMPLETENESS
0
$0
0
$0
0
$0
0
$0
Aggregated Statistics For Year 2001 (Based on 2 full tracts)
B) Conventional Home Purchase Loans
C) Refinancings
D) Home Improvement Loans
Number
Average Value
Number
Average Value
Number
Average Value
LOANS ORIGINATED
2
$31,160
10
$61,148
0
$0
APPLICATIONS APPROVED, NOT ACCEPTED
0
$0
0
$0
4
$26,778
APPLICATIONS DENIED
0
$0
10
$53,748
2
$8,765
APPLICATIONS WITHDRAWN
2
$44,790
2
$66,210
0
$0
FILES CLOSED FOR INCOMPLETENESS
0
$0
0
$0
0
$0
Aggregated Statistics For Year 2000 (Based on 2 full tracts)
A) FHA, FSA/RHS & VA Home Purchase Loans
B) Conventional Home Purchase Loans
C) Refinancings
D) Home Improvement Loans
F) Non-occupant Loans on < 5 Family Dwellings (A B C & D)
Number
Average Value
Number
Average Value
Number
Average Value
Number
Average Value
Number
Average Value
LOANS ORIGINATED
2
$51,605
2
$92,500
4
$72,055
8
$12,415
2
$85,685
APPLICATIONS APPROVED, NOT ACCEPTED
0
$0
0
$0
0
$0
2
$15,580
0
$0
APPLICATIONS DENIED
0
$0
0
$0
4
$40,895
8
$35,296
0
$0
APPLICATIONS WITHDRAWN
0
$0
0
$0
0
$0
0
$0
0
$0
FILES CLOSED FOR INCOMPLETENESS
0
$0
0
$0
0
$0
0
$0
0
$0
Aggregated Statistics For Year 1999 (Based on 1 partial tract)
Detailed PMIC statistics for the following Tracts:6004.00
2004 - 2018 National Fire Incident Reporting System (NFIRS) incidents
According to the data from the years 2004 - 2018 the average number of fire incidents per year is 8. The highest number of reported fires - 20 took place in 2006, and the least - 1 in 2010. The data has an increasing trend.
When looking into fire subcategories, the most reports belonged to: Structure Fires (53.0%), and Mobile Property/Vehicle Fires (23.9%).
Fire incident types reported to NFIRS in Zip Code 16136


 Nearest zip codes: 16157, 15010, 16117, 16141, 16160, 15066.
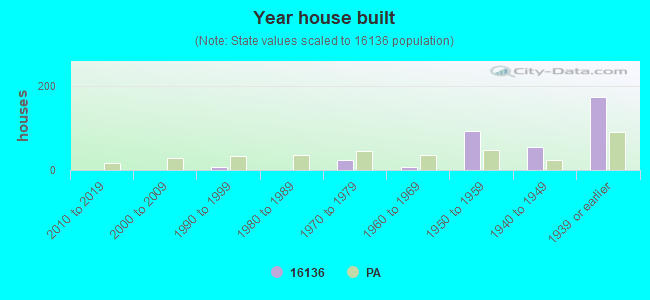


 According to the data from the years 2004 - 2018 the average number of fire incidents per year is 8. The highest number of reported fires - 20 took place in 2006, and the least - 1 in 2010. The data has an increasing trend.
 When looking into fire subcategories, the most reports belonged to: Structure Fires (53.0%), and Mobile Property/Vehicle Fires (23.9%).