Estimated zip code population in 2022: 1,738 Zip code population in 2010: 1,806 Zip code population in 2000: 1,863
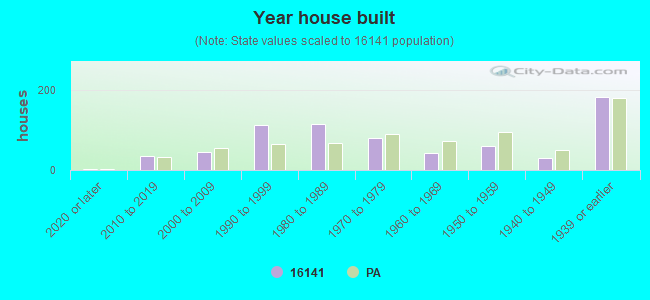
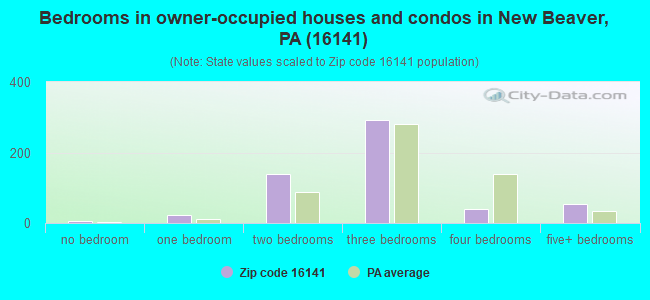
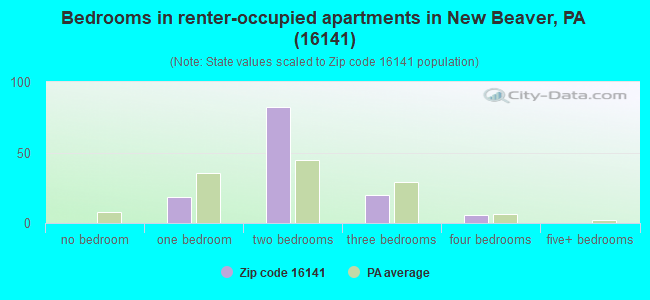
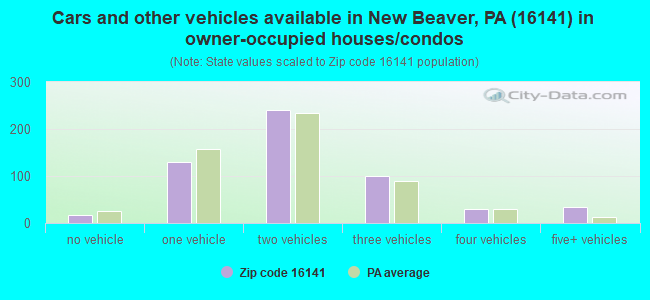
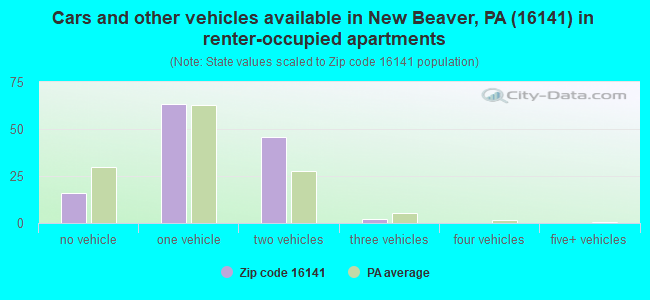
Houses and condos: 714 Renter-occupied apartments: 126
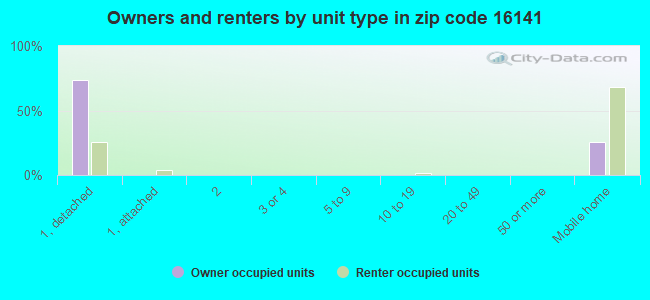
% of renters here:
19%
State:
31%
March 2022 cost of living index in zip code 16141: 90.7 (less than average, U.S. average is 100)
Land area: 20.5 sq. mi. Water area: 0.1 sq. mi.
Population density: 85 people per square mile
(very low).
OSM Map
General Map
Google Map
MSN Map
OSM Map
General Map
Google Map
MSN Map
OSM Map
General Map
Google Map
MSN Map
OSM Map
General Map
Google Map
MSN Map
Please wait while loading the map...
Real estate property taxes paid for housing units in 2022:
This zip code:
1.2% ($1,554)
Pennsylvania:
1.3% ($3,094)
Median real estate property taxes paid for housing units with mortgages in 2022: $2,416 (1.3%) Median real estate property taxes paid for housing units with no mortgage in 2022: $751 (1.0%)
Business Search- 14 Million verified businesses
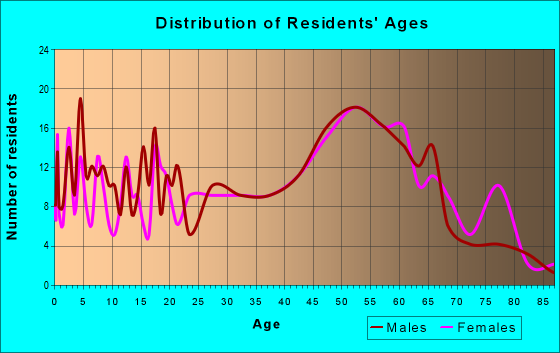
Males: 925
(53.2%)
Females: 813
(46.8%)
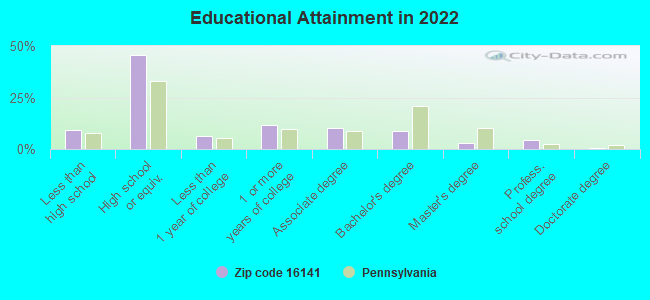
For population 25 years and over in 16141:
High school or higher: 89.5%
Bachelor's degree or higher: 16.7%
Graduate or professional degree: 7.9%
Unemployed: 4.0%
Mean travel time to work (commute): 27.2 minutes
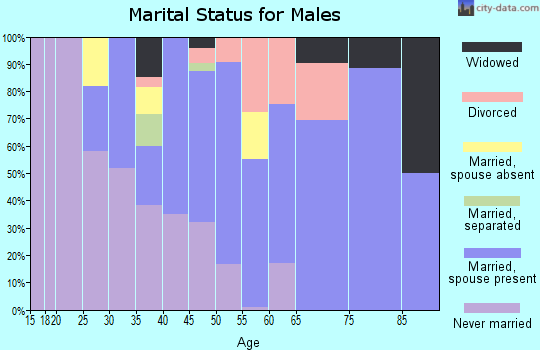
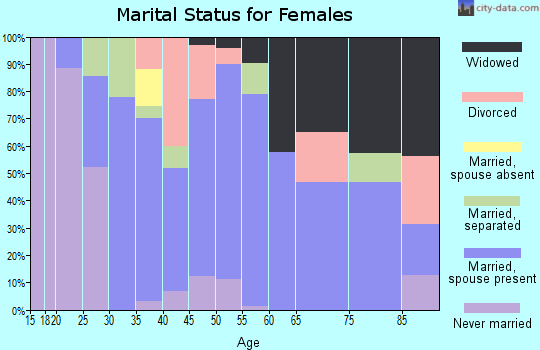
For population 15 years and over in 16141:
Never married: 26.9%
Now married: 55.5%
Separated: 1.7%
Widowed: 7.5%
Divorced: 8.4%
Zip code 16141 compared to state average:
Median house value below state average.
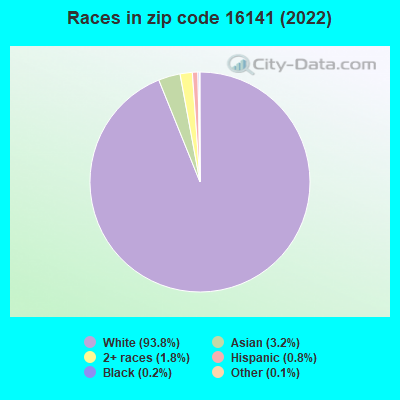
Black race population percentage significantly below state average.
Hispanic race population percentage significantly below state average.
Foreign-born population percentage below state average.
Renting percentage below state average.
Number of college students below state average.
Percentage of population with a bachelor's degree or higher below state average.
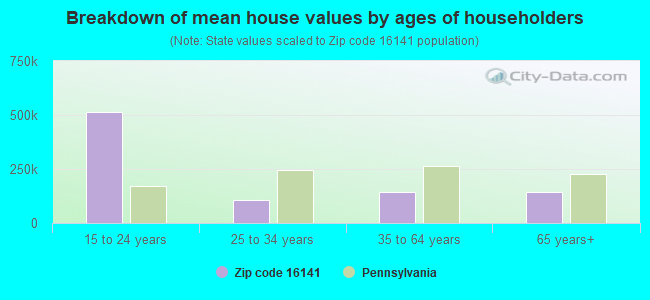
Estimated median house/condo value in 2022: $130,781
16141:
$130,781
Pennsylvania:
$245,500
According to our research of Pennsylvania and other state lists, there were 2 registered sex offenders living in 16141 zip code as of April 27, 2024. The ratio of all residents to sex offenders in zip code 16141 is 992 to 1. The ratio of registered sex offenders to all residents in this zip code is lower than the state average.
Median resident age:
This zip code:
43.7 years
Pennsylvania median age:
40.9 years
Average household size:
This zip code:
2.6 people
Pennsylvania:
2.4 people
Averages for the 2020 tax year for zip code 16141, filed in 2021:
Average Adjusted Gross Income (AGI) in 2020: $65,223 (Individual Income Tax Returns)
Here:
$65,223
State:
$75,707
Salary/wage: $51,734 (reported on 79.5% of returns)
Here:
$51,734
State:
$62,806
(% of AGI for various income ranges: 1004.1% for AGIs below $25k, 3444.4% for AGIs $25k-50k, 6190.0% for AGIs $50k-75k, 8421.4% for AGIs $75k-100k, 19130.0% for AGIs $100k-200k)
Taxable interest for individuals: $900 (reported on 25.6% of returns)
This zip code:
$900
Pennsylvania:
$1,633
(% of AGI for various income ranges: 11.2% for AGIs below $25k, 15.0% for AGIs $25k-50k, 53.3% for AGIs $50k-75k, 17.1% for AGIs $75k-100k, 110.0% for AGIs $100k-200k)
Ordinary dividends: $2,800 (reported on 16.7% of returns)
Here:
$2,800
State:
$7,382
(% of AGI for various income ranges: 34.7% for AGIs below $25k, 25.6% for AGIs $50k-75k, 58.6% for AGIs $75k-100k, 344.3% for AGIs $100k-200k)
Net capital gain/loss in AGI: +$4,082 (reported on 14.1% of returns)
Here:
+$4,082
State:
+$23,522
(% of AGI for various income ranges: 12.5% for AGIs $25k-50k, 110.0% for AGIs $75k-100k, 502.9% for AGIs $100k-200k)
Profit/loss from business: +$7,075 (reported on 10.3% of returns)
Here:
+$7,075
State:
+$16,274
(% of AGI for various income ranges: 199.4% for AGIs below $25k, 117.8% for AGIs $50k-75k, 172.9% for AGIs $100k-200k)
Taxable individual retirement arrangement distribution: $15,389 (reported on 11.5% of returns)
16141:
$15,389
Pennsylvania:
$18,583
(% of AGI for various income ranges: 235.3% for AGIs below $25k, 326.7% for AGIs $50k-75k, 987.1% for AGIs $75k-100k)
Earned income credit: $1,809 (reported on 14.1% of returns)
Here:
$1,809
State:
$2,100
(% of AGI for various income ranges: 62.4% for AGIs below $25k, 58.1% for AGIs $25k-50k)
Percentage of individuals using paid preparers for their 2020 taxes: 96.2%
Here:
96%
State:
92%
(% for various income ranges: 92.0% for AGIs below $25k, 95.2% for AGIs $25k-50k, 100.0% for AGIs $50k-75k, 100.0% for AGIs $75k-100k, 100.0% for AGIs $100k-200k)
Averages for the 2012 tax year for zip code 16141, filed in 2013:
Average Adjusted Gross Income (AGI) in 2012: $51,431 (Individual Income Tax Returns)
Here:
$51,431
State:
$61,346
Salary/wage: $41,751 (reported on 84.7% of returns)
Here:
$41,751
State:
$51,902
(% of AGI for various income ranges: 69.7% for AGIs below $25k, 79.0% for AGIs $25k-50k, 83.9% for AGIs $50k-75k, 81.6% for AGIs $75k-100k, 49.3% for AGIs $100k-200k)
Taxable interest for individuals: $500 (reported on 27.1% of returns)
This zip code:
$500
Pennsylvania:
$1,588
(% of AGI for various income ranges: 1.0% for AGIs below $25k, 0.2% for AGIs $25k-50k, 0.2% for AGIs $50k-75k, 0.2% for AGIs $100k-200k)
Ordinary dividends: $986 (reported on 16.5% of returns)
Here:
$986
State:
$5,827
(% of AGI for various income ranges: 0.6% for AGIs below $25k, 0.3% for AGIs $25k-50k, 0.3% for AGIs $50k-75k, 0.4% for AGIs $100k-200k)
Net capital gain/loss in AGI: +$467 (reported on 7.1% of returns)
Here:
+$467
State:
+$14,495
Profit/loss from business: +$8,310 (reported on 11.8% of returns)
Here:
+$8,310
State:
+$16,268
(% of AGI for various income ranges: 6.8% for AGIs below $25k, 3.6% for AGIs $25k-50k, 3.8% for AGIs $75k-100k)
Taxable individual retirement arrangement distribution: $6,825 (reported on 9.4% of returns)
16141:
$6,825
Pennsylvania:
$14,550
Total itemized deductions: $18,325 (16% of AGI, reported on 18.8% of returns)
Here:
$18,325
State:
$23,538
Here:
15.6% of AGI
State:
18.4% of AGI
(% of AGI for various income ranges: 6.0% for AGIs $25k-50k, 6.4% for AGIs $50k-75k, 9.2% for AGIs $75k-100k, 7.8% for AGIs $100k-200k)
Charity contributions: $3,650 (reported on 14.1% of returns)
Here:
$3,650
State:
$4,025
(% of AGI for various income ranges: 0.9% for AGIs $25k-50k, 1.0% for AGIs $50k-75k, 1.5% for AGIs $75k-100k, 1.1% for AGIs $100k-200k)
Taxes paid: $8,012 (reported on 18.8% of returns)
16141:
$8,012
State:
$9,982
(% of AGI for various income ranges: 1.7% for AGIs $25k-50k, 2.4% for AGIs $50k-75k, 3.7% for AGIs $75k-100k, 4.3% for AGIs $100k-200k)
Earned income credit: $1,943 (reported on 16.5% of returns)
Here:
$1,943
State:
$2,106
(% of AGI for various income ranges: 4.9% for AGIs below $25k, 0.9% for AGIs $25k-50k)
Percentage of individuals using paid preparers for their 2012 taxes: 65.9%
Here:
66%
State:
53%
(% for various income ranges: 60.6% for AGIs below $25k, 65.2% for AGIs $25k-50k, 64.3% for AGIs $50k-75k, 75.0% for AGIs $75k-100k, 85.7% for AGIs $100k-200k)
Averages for the 2004 tax year for zip code 16141, filed in 2005:
Average Adjusted Gross Income (AGI) in 2004: $32,807 (Individual Income Tax Returns)
Here:
$32,807
State:
$48,049
Salary/wage: $32,844 (reported on 86.8% of returns)
Here:
$32,844
State:
$42,646
(% of AGI for various income ranges: 112.1% for AGIs below $10k, 78.4% for AGIs $10k-25k, 88.1% for AGIs $25k-50k, 91.0% for AGIs $50k-75k, 84.6% for AGIs $75k-100k, 79.1% for AGIs over 100k)
Taxable interest for individuals: $754 (reported on 36.4% of returns)
This zip code:
$754
Pennsylvania:
$1,657
(% of AGI for various income ranges: 5.0% for AGIs below $10k, 2.0% for AGIs $10k-25k, 0.5% for AGIs $25k-50k, 0.7% for AGIs $50k-75k, 0.3% for AGIs $75k-100k, 0.2% for AGIs over 100k)
Taxable dividends: $559 (reported on 17.5% of returns)
Here:
$559
State:
$3,566
(% of AGI for various income ranges: 1.3% for AGIs below $10k, 0.5% for AGIs $10k-25k, 0.2% for AGIs $25k-50k, 0.2% for AGIs $50k-75k, 0.5% for AGIs $75k-100k, 0.2% for AGIs over 100k)
Net capital gain/loss: +$76 (reported on 9.1% of returns)
Here:
+$76
State:
+$9,716
(% of AGI for various income ranges: -3.0% for AGIs below $10k, -0.1% for AGIs $10k-25k, 0.2% for AGIs $25k-50k, 0.2% for AGIs $50k-75k, 0.1% for AGIs $75k-100k)
Profit/loss from business: +$4,284 (reported on 9.3% of returns)
Here:
+$4,284
State:
+$14,267
(% of AGI for various income ranges: 9.4% for AGIs below $10k, 3.6% for AGIs $10k-25k, 1.3% for AGIs $25k-50k, 0.1% for AGIs $50k-75k)
IRA payment deduction: $1,545 (reported on 2.5% of returns)
16141:
$1,545
Pennsylvania:
$2,903
Total itemized deductions: $13,620 (20% of AGI, reported on 14.8% of returns)
Here:
$13,620
State:
$18,804
Here:
20.3% of AGI
State:
19.5% of AGI
(% of AGI for various income ranges: 2.3% for AGIs $10k-25k, 4.4% for AGIs $25k-50k, 7.6% for AGIs $50k-75k, 8.6% for AGIs $75k-100k, 11.4% for AGIs over 100k)
Charity contributions deductions: $2,183 (3% of AGI, reported on 12.5% of returns)
Here:
$2,183
State:
$3,337
Here:
3.3% of AGI
State:
3.3% of AGI
(% of AGI for various income ranges: 0.9% for AGIs $25k-50k, 0.8% for AGIs $50k-75k, 1.0% for AGIs $75k-100k, 1.8% for AGIs over 100k)
Total tax: $3,867 (reported on 71.8% of returns)
16141:
$3,867
State:
$8,008
(% of AGI for various income ranges: 2.3% for AGIs below $10k, 3.7% for AGIs $10k-25k, 6.8% for AGIs $25k-50k, 9.1% for AGIs $50k-75k, 11.4% for AGIs $75k-100k, 16.5% for AGIs over 100k)
Earned income credit: $1,534 (reported on 17.0% of returns)
Here:
$1,534
State:
$1,643
Percentage of individuals using paid preparers for their 2004 taxes: 65.9%
Here:
66%
State:
56%
(% for various income ranges: 62.4% for AGIs below $10k, 64.4% for AGIs $10k-25k, 67.9% for AGIs $25k-50k, 67.1% for AGIs $50k-75k, 65.7% for AGIs $75k-100k, 79.2% for AGIs over 100k)
Household received Food Stamps/SNAP in the past 12 months: 169 Household did not receive Food Stamps/SNAP in the past 12 months: 513
Women who had a birth in the past 12 months: 16 (8 now married, 6 unmarried) Women who did not have a birth in the past 12 months: 287 (132 now married, 154 unmarried)
Housing units in zip code 16141 with a mortgage: 258 (41 second mortgage, 35 both second mortgage and home equity loan) Houses without a mortgage: 14
Median monthly owner costs for units with a mortgage: $1,377 Median monthly owner costs for units without a mortgage: $450
Residents with income below the poverty level in 2022:
This zip code:
9.2%
Whole state:
11.8%
Residents with income below 50% of the poverty level in 2022:
This zip code:
4.0%
Whole state:
6.1%
Median number of rooms in houses and condos:
Here:
6.1
State:
6.8
Median number of rooms in apartments:
Here:
4.5
State:
4.3
Notable locations in this zip code not listed on our city pages
In group quarters: 4 (-1 institutionalized population)
Size of family households: 202 2-persons, 131 3-persons, 58 4-persons, 33 5-persons, 20 6-persons, 43 7-or-more-persons
Size of nonfamily households: 158 1-person, 17 2-persons, 9 3-persons
289 married couples with children.
91 single-parent households (22 men, 69 women).
98.2% of residents of 16141 zip code speak English at home.
0.3% of residents speak Spanish at home (80% very well, 20% well).
0.5% of residents speak other Indo-European language at home (100% very well).
0.2% of residents speak Asian or Pacific Island language at home (100% well).
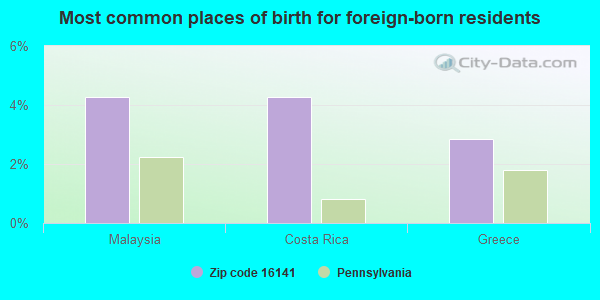
Foreign born population: 71 (4.1%) (100.0% of them are naturalized citizens)
This zip code:
4.1%
Whole state:
7.5%
4%Malaysia
4%Costa Rica
3%Greece
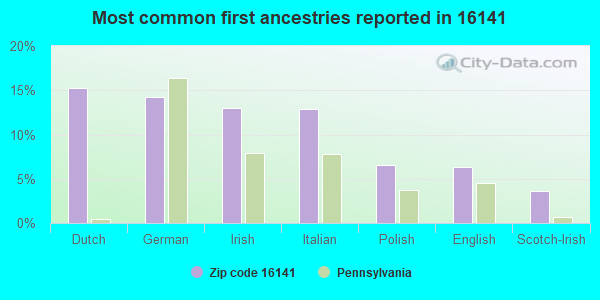
15%Dutch
14%German
13%Irish
13%Italian
7%Polish
6%English
4%Scotch-Irish
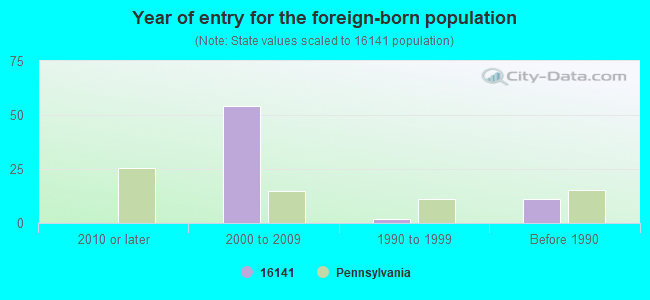
Year of entry for the foreign-born population
02010 or later
542000 to 2009
21990 to 1999
11Before 1990
Facilities with environmental interests located in this zip code:
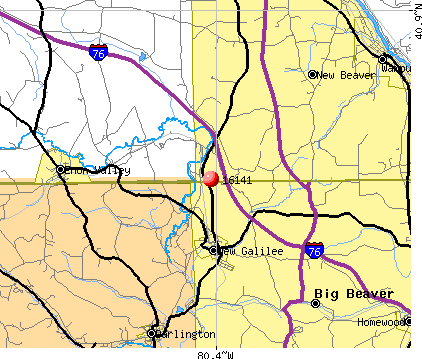
ALBITZ SR STP (RR 1 BOX 211 in NEW GALILEE, PA)
STATE MASTER (Pennsylvania database) - PCS-PA0205591, National Pollutant Discharge Elimination System Permit National Pollutant Discharge Elimination System NON-MAJOR (Tracking pollutant discharge elimination systems) - permit Business SIC classification: PRIVATE HOUSEHOLDS Alternative names: ALBITZ, GENEVEIVE T.
Housing units lacking complete plumbing facilities: 2.2% Housing units lacking complete kitchen facilities: 1.5%
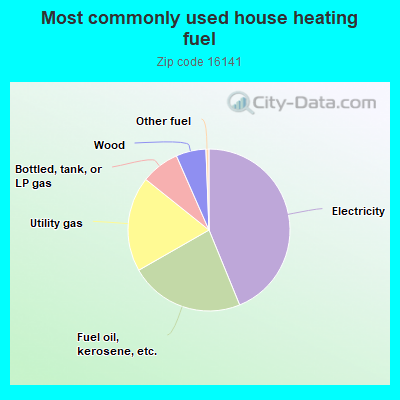
44.0%Electricity
23.0%Fuel oil, kerosene, etc.
19.1%Utility gas
7.7%Bottled, tank, or LP gas
6.0%Wood
0.6%Other fuel
Population in 1990: 1,852. Population change in the 1990s: +11 (+0.6%).
Place of birth for U.S.-born residents:
This state: 1,295
Northeast: 9
Midwest: 220
South: 65
West: 73
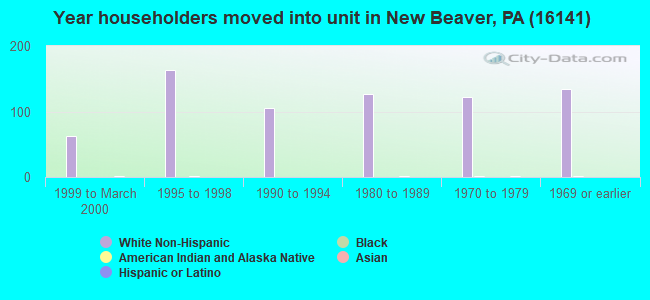
70% of the 16141 zip code residents lived in the same house 5 years ago. Out of people who lived in different houses, 51% lived in this county. Out of people who lived in different counties, 50% lived in Pennsylvania.
89% of the 16141 zip code residents lived in the same house 1 year ago. Out of people who lived in different houses, 79% moved from this county. Out of people who lived in different houses, 12% moved from different county within same state. Out of people who lived in different houses, 6% moved from different state.
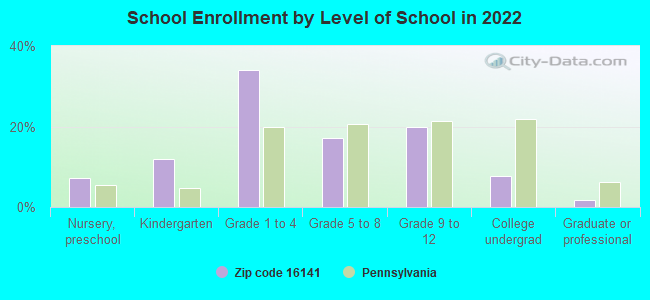
Private vs. public school enrollment:
Students in private schools in grades 1 to 8 (elementary and middle school): 15
Here:
7.3%
Pennsylvania:
15.7%
Students in private schools in grades 9 to 12 (high school): 36
Here:
42.1%
Pennsylvania:
13.4%
Students in private undergraduate colleges: 30
Here:
88.6%
Pennsylvania:
39.8%
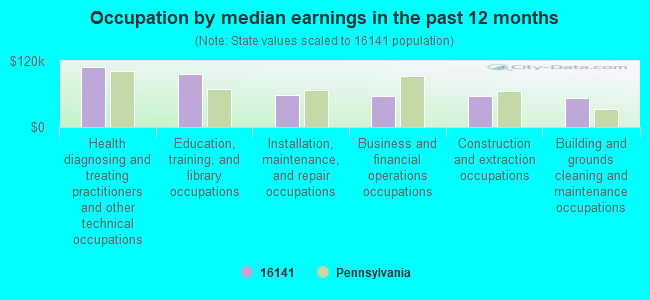
Occupation by median earnings in the past 12 months ($)
109,184Health diagnosing and treating practitioners and other technical occupations
95,960Education, training, and library occupations
58,086Installation, maintenance, and repair occupations
56,822Business and financial operations occupations
55,512Construction and extraction occupations
53,613Building and grounds cleaning and maintenance occupations
Top industries in this zip code by the number of employees in 2005:
Wholesale Trade: Other Chemical and Allied Products Merchant Wholesalers (20-49 employees: 1 establishment)
Health Care and Social Assistance: Ambulance Services (10-19: 1)
Administrative and Support and Waste Management and Remediation Services: Tour Operators (10-19: 1)
Health Care and Social Assistance: Homes for the Elderly (5-9: 1)
Other Services (except Public Administration): Civic and Social Organizations (5-9: 1)
Construction: Water and Sewer Line and Related Structures Construction (5-9: 1)
Mining: Support Activities for Coal Mining (5-9: 1)
Accommodation and Food Services: Limited-Service Restaurants (5-9: 1)
Other Services (except Public Administration): Religious Organizations (5-9: 1)
Arts, Entertainment, and Recreation: Promoters of Performing Arts, Sports, and Similar Events without Facilities (1-4: 1)
People in group quarters in 2010:
9 people in group homes intended for adults
People in group quarters in 2000:
18 people in schools, hospitals, or wards for the intellectually disabled
8 people in other nonhousehold living situations
Fatal accident statistics in 2012:
Fatal accident count: 1
Vehicles involved in fatal accidents: 1
Fatal accidents caused by drunken drivers: 1
Fatalities: 1
Persons involved in fatal accidents: 2
Pedestrians involved in fatal accidents: 0
Fatal accident statistics in 2011:
Fatal accident count: 1
Vehicles involved in fatal accidents: 2
Fatal accidents caused by drunken drivers: 0
Fatalities: 1
Persons involved in fatal accidents: 2
Pedestrians involved in fatal accidents: 0
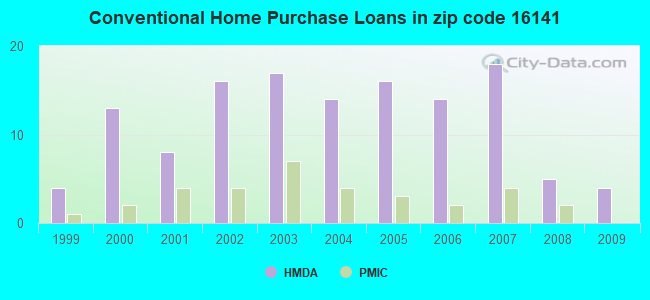
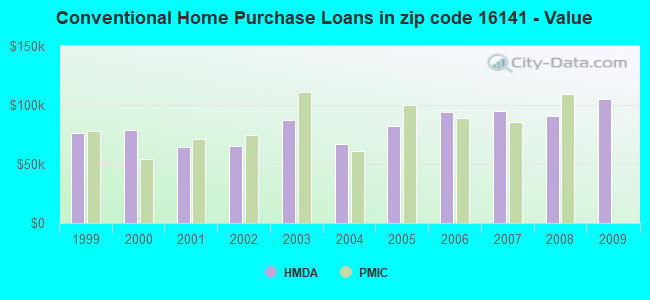
Home Mortgage Disclosure Act Aggregated Statistics For Year 2009 (Based on 2 partial tracts)
A) FHA, FSA/RHS & VA Home Purchase Loans
B) Conventional Home Purchase Loans
C) Refinancings
D) Home Improvement Loans
F) Non-occupant Loans on < 5 Family Dwellings (A B C & D)
G) Loans On Manufactured Home Dwelling (A B C & D)
Number
Average Value
Number
Average Value
Number
Average Value
Number
Average Value
Number
Average Value
Number
Average Value
LOANS ORIGINATED
3
$98,373
4
$105,365
17
$92,660
4
$40,495
1
$16,770
1
$95,400
APPLICATIONS APPROVED, NOT ACCEPTED
0
$0
1
$38,790
3
$105,713
0
$0
1
$20,970
0
$0
APPLICATIONS DENIED
1
$44,560
1
$60,810
14
$142,732
3
$52,420
1
$38,270
0
$0
APPLICATIONS WITHDRAWN
0
$0
0
$0
6
$100,647
2
$7,865
0
$0
1
$19,920
FILES CLOSED FOR INCOMPLETENESS
0
$0
0
$0
2
$114,275
1
$47,180
0
$0
0
$0
Aggregated Statistics For Year 2008 (Based on 2 partial tracts)
A) FHA, FSA/RHS & VA Home Purchase Loans
B) Conventional Home Purchase Loans
C) Refinancings
D) Home Improvement Loans
F) Non-occupant Loans on < 5 Family Dwellings (A B C & D)
G) Loans On Manufactured Home Dwelling (A B C & D)
Number
Average Value
Number
Average Value
Number
Average Value
Number
Average Value
Number
Average Value
Number
Average Value
LOANS ORIGINATED
3
$85,970
5
$90,268
11
$120,089
5
$27,992
1
$655,250
0
$0
APPLICATIONS APPROVED, NOT ACCEPTED
0
$0
1
$52,420
1
$31,450
1
$7,860
0
$0
0
$0
APPLICATIONS DENIED
1
$41,410
4
$47,965
25
$117,882
5
$61,542
0
$0
3
$57,313
APPLICATIONS WITHDRAWN
1
$77,580
1
$53,990
5
$118,888
0
$0
0
$0
0
$0
FILES CLOSED FOR INCOMPLETENESS
0
$0
1
$35,120
1
$81,250
0
$0
0
$0
0
$0
Aggregated Statistics For Year 2007 (Based on 2 partial tracts)
A) FHA, FSA/RHS & VA Home Purchase Loans
B) Conventional Home Purchase Loans
C) Refinancings
D) Home Improvement Loans
F) Non-occupant Loans on < 5 Family Dwellings (A B C & D)
G) Loans On Manufactured Home Dwelling (A B C & D)
Number
Average Value
Number
Average Value
Number
Average Value
Number
Average Value
Number
Average Value
Number
Average Value
LOANS ORIGINATED
3
$88,067
18
$95,026
23
$78,767
9
$35,121
2
$69,455
7
$80,501
APPLICATIONS APPROVED, NOT ACCEPTED
0
$0
4
$75,222
4
$147,825
2
$71,555
0
$0
1
$88,070
APPLICATIONS DENIED
1
$95,400
5
$60,808
32
$96,535
3
$60,633
0
$0
3
$84,397
APPLICATIONS WITHDRAWN
0
$0
1
$41,940
6
$90,773
1
$56,090
0
$0
0
$0
FILES CLOSED FOR INCOMPLETENESS
0
$0
1
$72,340
1
$70,770
0
$0
0
$0
0
$0
Aggregated Statistics For Year 2006 (Based on 2 partial tracts)
A) FHA, FSA/RHS & VA Home Purchase Loans
B) Conventional Home Purchase Loans
C) Refinancings
D) Home Improvement Loans
F) Non-occupant Loans on < 5 Family Dwellings (A B C & D)
G) Loans On Manufactured Home Dwelling (A B C & D)
Number
Average Value
Number
Average Value
Number
Average Value
Number
Average Value
Number
Average Value
Number
Average Value
LOANS ORIGINATED
2
$95,930
14
$94,394
26
$62,783
10
$29,670
3
$74,087
5
$57,558
APPLICATIONS APPROVED, NOT ACCEPTED
0
$0
3
$120,390
2
$109,820
1
$18,350
0
$0
1
$70,240
APPLICATIONS DENIED
1
$70,240
7
$91,660
28
$77,020
3
$79,330
3
$63,953
3
$75,833
APPLICATIONS WITHDRAWN
0
$0
2
$76,010
13
$89,598
2
$61,595
1
$51,370
0
$0
FILES CLOSED FOR INCOMPLETENESS
0
$0
1
$96,450
4
$82,168
0
$0
1
$33,550
1
$53,470
Aggregated Statistics For Year 2005 (Based on 2 partial tracts)
A) FHA, FSA/RHS & VA Home Purchase Loans
B) Conventional Home Purchase Loans
C) Refinancings
D) Home Improvement Loans
F) Non-occupant Loans on < 5 Family Dwellings (A B C & D)
G) Loans On Manufactured Home Dwelling (A B C & D)
Number
Average Value
Number
Average Value
Number
Average Value
Number
Average Value
Number
Average Value
Number
Average Value
LOANS ORIGINATED
4
$80,465
16
$82,431
27
$73,446
8
$41,936
2
$32,500
5
$69,300
APPLICATIONS APPROVED, NOT ACCEPTED
0
$0
1
$70,240
7
$90,836
1
$76,530
1
$23,590
1
$41,410
APPLICATIONS DENIED
0
$0
6
$43,422
27
$86,707
6
$32,238
1
$1,050
6
$54,342
APPLICATIONS WITHDRAWN
1
$16,770
1
$16,250
15
$84,221
2
$53,470
1
$16,770
1
$60,280
FILES CLOSED FOR INCOMPLETENESS
0
$0
0
$0
1
$47,180
0
$0
0
$0
0
$0
Aggregated Statistics For Year 2004 (Based on 2 partial tracts)
A) FHA, FSA/RHS & VA Home Purchase Loans
B) Conventional Home Purchase Loans
C) Refinancings
D) Home Improvement Loans
F) Non-occupant Loans on < 5 Family Dwellings (A B C & D)
G) Loans On Manufactured Home Dwelling (A B C & D)
Number
Average Value
Number
Average Value
Number
Average Value
Number
Average Value
Number
Average Value
Number
Average Value
LOANS ORIGINATED
1
$96,450
14
$67,098
29
$93,994
13
$24,113
2
$89,640
1
$51,370
APPLICATIONS APPROVED, NOT ACCEPTED
0
$0
2
$89,900
6
$90,773
3
$47,703
0
$0
1
$51,900
APPLICATIONS DENIED
2
$61,855
6
$47,090
27
$86,318
8
$29,092
1
$1,570
6
$54,430
APPLICATIONS WITHDRAWN
0
$0
2
$90,425
13
$83,993
1
$17,820
0
$0
1
$61,860
FILES CLOSED FOR INCOMPLETENESS
0
$0
1
$13,110
8
$87,279
0
$0
1
$44,030
0
$0
Aggregated Statistics For Year 2003 (Based on 2 partial tracts)
A) FHA, FSA/RHS & VA Home Purchase Loans
B) Conventional Home Purchase Loans
C) Refinancings
D) Home Improvement Loans
F) Non-occupant Loans on < 5 Family Dwellings (A B C & D)
Number
Average Value
Number
Average Value
Number
Average Value
Number
Average Value
Number
Average Value
LOANS ORIGINATED
1
$113,750
17
$87,480
60
$88,328
15
$40,399
2
$27,260
APPLICATIONS APPROVED, NOT ACCEPTED
0
$0
4
$61,462
9
$74,611
3
$28,133
0
$0
APPLICATIONS DENIED
0
$0
8
$67,294
45
$72,876
7
$23,439
2
$113,750
APPLICATIONS WITHDRAWN
0
$0
3
$52,247
16
$84,298
2
$28,830
1
$28,310
FILES CLOSED FOR INCOMPLETENESS
1
$58,190
0
$0
4
$86,492
1
$8,910
0
$0
Aggregated Statistics For Year 2002 (Based on 2 partial tracts)
A) FHA, FSA/RHS & VA Home Purchase Loans
B) Conventional Home Purchase Loans
C) Refinancings
D) Home Improvement Loans
F) Non-occupant Loans on < 5 Family Dwellings (A B C & D)
Number
Average Value
Number
Average Value
Number
Average Value
Number
Average Value
Number
Average Value
LOANS ORIGINATED
2
$88,330
16
$65,164
39
$75,915
6
$22,977
0
$0
APPLICATIONS APPROVED, NOT ACCEPTED
1
$41,940
4
$62,510
14
$59,234
1
$9,440
0
$0
APPLICATIONS DENIED
0
$0
4
$41,805
40
$75,603
5
$25,790
2
$62,640
APPLICATIONS WITHDRAWN
0
$0
1
$96,450
15
$93,133
2
$8,385
0
$0
FILES CLOSED FOR INCOMPLETENESS
0
$0
1
$31,450
7
$125,284
0
$0
0
$0
Aggregated Statistics For Year 2001 (Based on 2 partial tracts)
A) FHA, FSA/RHS & VA Home Purchase Loans
B) Conventional Home Purchase Loans
C) Refinancings
D) Home Improvement Loans
F) Non-occupant Loans on < 5 Family Dwellings (A B C & D)
Number
Average Value
Number
Average Value
Number
Average Value
Number
Average Value
Number
Average Value
LOANS ORIGINATED
1
$45,610
8
$64,280
43
$67,415
14
$17,486
1
$44,030
APPLICATIONS APPROVED, NOT ACCEPTED
1
$37,740
4
$72,602
10
$60,702
4
$32,108
0
$0
APPLICATIONS DENIED
1
$41,410
5
$54,516
27
$63,914
7
$38,341
0
$0
APPLICATIONS WITHDRAWN
0
$0
1
$73,910
9
$74,029
1
$13,110
0
$0
FILES CLOSED FOR INCOMPLETENESS
0
$0
0
$0
4
$85,052
0
$0
0
$0
Aggregated Statistics For Year 2000 (Based on 2 partial tracts)
A) FHA, FSA/RHS & VA Home Purchase Loans
B) Conventional Home Purchase Loans
C) Refinancings
D) Home Improvement Loans
F) Non-occupant Loans on < 5 Family Dwellings (A B C & D)
Number
Average Value
Number
Average Value
Number
Average Value
Number
Average Value
Number
Average Value
LOANS ORIGINATED
5
$70,452
13
$78,468
15
$53,643
7
$32,800
3
$77,233
APPLICATIONS APPROVED, NOT ACCEPTED
1
$33,020
6
$77,232
2
$37,220
3
$15,027
1
$23,590
APPLICATIONS DENIED
1
$59,760
10
$41,517
9
$59,700
4
$17,038
0
$0
APPLICATIONS WITHDRAWN
1
$42,460
1
$44,560
3
$63,953
3
$11,883
0
$0
FILES CLOSED FOR INCOMPLETENESS
0
$0
0
$0
2
$77,845
1
$5,240
0
$0
Aggregated Statistics For Year 1999 (Based on 1 partial tract)
A) FHA, FSA/RHS & VA Home Purchase Loans
B) Conventional Home Purchase Loans
C) Refinancings
D) Home Improvement Loans
F) Non-occupant Loans on < 5 Family Dwellings (A B C & D)
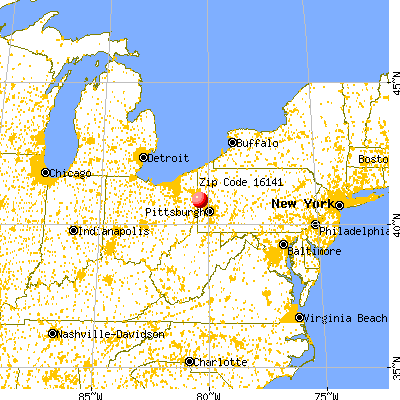


 Nearest zip codes: 16157, 16160, 16136, 16120, 16115, 16102.