Estimated zip code population in 2022: 2,328 Zip code population in 2010: 2,737 Zip code population in 2000: 2,898
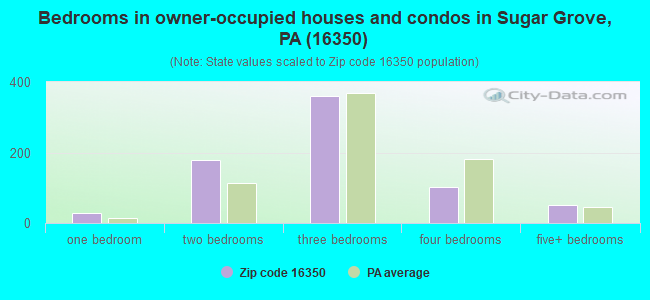
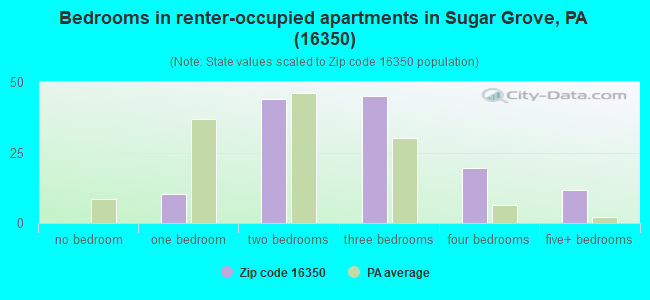
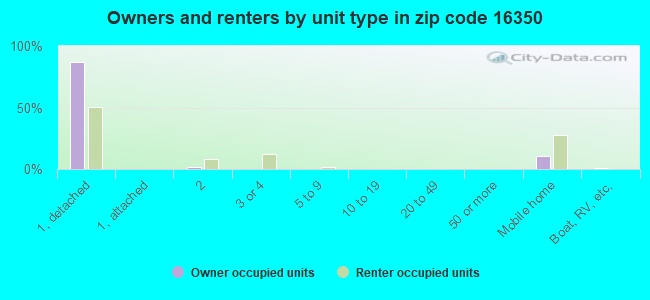
Houses and condos: 970 Renter-occupied apartments: 133
% of renters here:
16%
State:
31%
March 2022 cost of living index in zip code 16350: 91.1 (less than average, U.S. average is 100)
Land area: 46.0 sq. mi. Water area: 0.0 sq. mi.
Population density: 51 people per square mile
(very low).
OSM Map
General Map
Google Map
MSN Map
OSM Map
General Map
Google Map
MSN Map
OSM Map
General Map
Google Map
MSN Map
OSM Map
General Map
Google Map
MSN Map
Please wait while loading the map...
Real estate property taxes paid for housing units in 2022:
This zip code:
1.0% ($1,637)
Pennsylvania:
1.3% ($3,094)
Median real estate property taxes paid for housing units with mortgages in 2022: $1,756 (0.9%) Median real estate property taxes paid for housing units with no mortgage in 2022: $1,537 (1.1%)
Business Search- 14 Million verified businesses
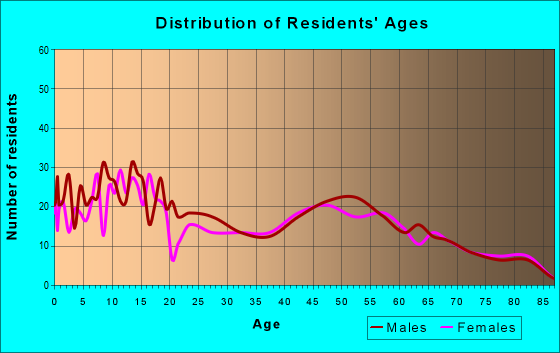
Males: 1,206
(51.8%)
Females: 1,121
(48.2%)
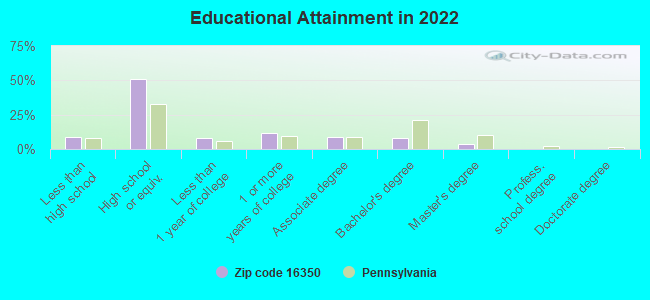
For population 25 years and over in 16350:
High school or higher: 89.8%
Bachelor's degree or higher: 12.1%
Graduate or professional degree: 4.6%
Unemployed: 1.2%
Mean travel time to work (commute): 25.7 minutes
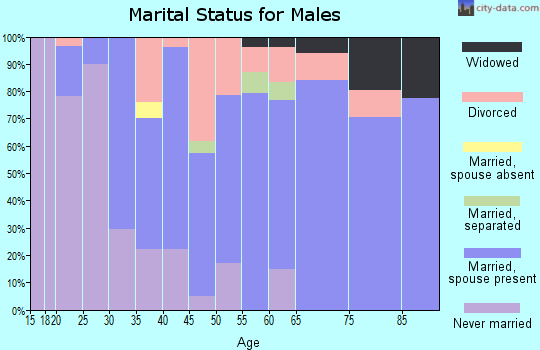
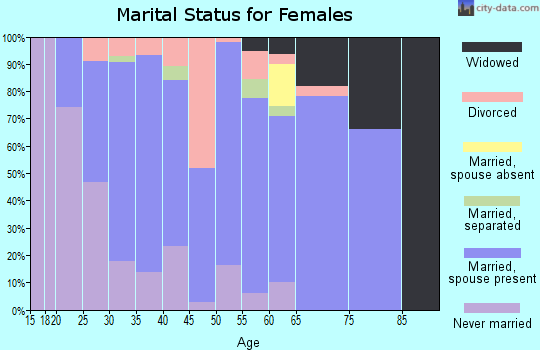
For population 15 years and over in 16350:
Never married: 22.6%
Now married: 59.3%
Separated: 2.1%
Widowed: 5.5%
Divorced: 10.5%
Zip code 16350 compared to state average:
Unemployed percentage significantly below state average.
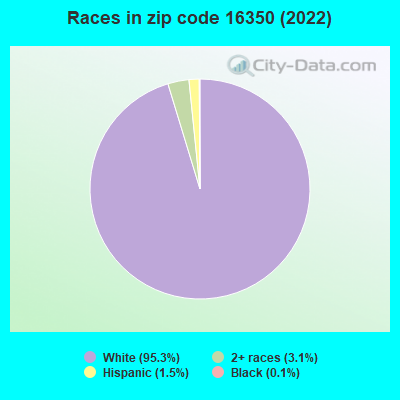
Black race population percentage significantly below state average.
Hispanic race population percentage significantly below state average.
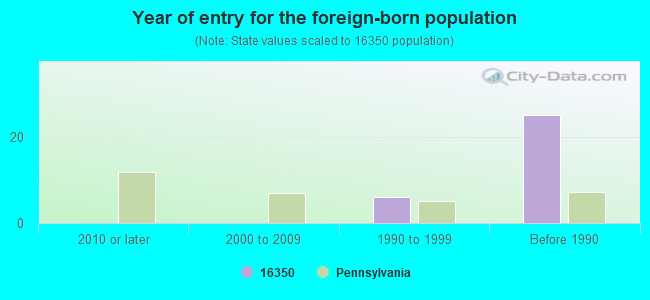
Foreign-born population percentage significantly below state average.
Renting percentage below state average.
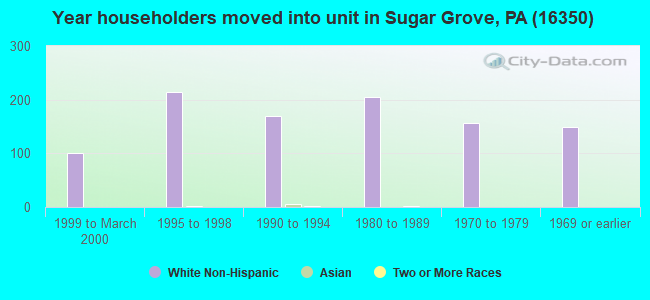
Length of stay since moving in significantly above state average.
Number of college students below state average.
Percentage of population with a bachelor's degree or higher significantly below state average.
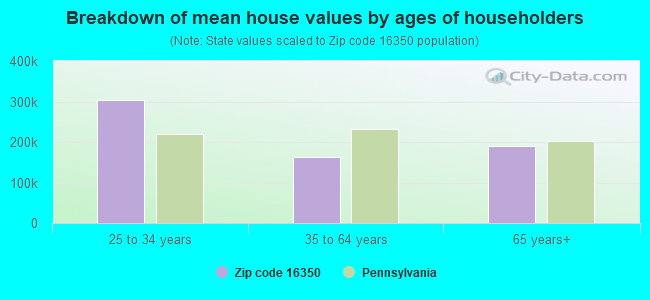
Estimated median house/condo value in 2022: $169,202
16350:
$169,202
Pennsylvania:
$245,500
According to our research of Pennsylvania and other state lists, there was 1 registered sex offender living in 16350 zip code as of April 27, 2024. The ratio of all residents to sex offenders in zip code 16350 is 2,965 to 1. The ratio of registered sex offenders to all residents in this zip code is much lower than the state average.
Median resident age:
This zip code:
42.0 years
Pennsylvania median age:
40.9 years
Average household size:
This zip code:
2.7 people
Pennsylvania:
2.4 people
Averages for the 2020 tax year for zip code 16350, filed in 2021:
Average Adjusted Gross Income (AGI) in 2020: $49,333 (Individual Income Tax Returns)
Here:
$49,333
State:
$75,707
Salary/wage: $41,176 (reported on 78.5% of returns)
Here:
$41,176
State:
$62,806
(% of AGI for various income ranges: 1082.7% for AGIs below $25k, 3453.9% for AGIs $25k-50k, 5848.3% for AGIs $50k-75k, 8597.5% for AGIs $75k-100k, 16555.0% for AGIs $100k-200k)
Taxable interest for individuals: $469 (reported on 24.3% of returns)
This zip code:
$469
Pennsylvania:
$1,633
(% of AGI for various income ranges: 11.9% for AGIs below $25k, 8.3% for AGIs $25k-50k, 8.3% for AGIs $50k-75k, 11.2% for AGIs $75k-100k, 88.3% for AGIs $100k-200k)
Ordinary dividends: $2,506 (reported on 16.8% of returns)
Here:
$2,506
State:
$7,382
(% of AGI for various income ranges: 22.7% for AGIs below $25k, 22.2% for AGIs $25k-50k, 42.5% for AGIs $50k-75k, 56.2% for AGIs $75k-100k, 408.3% for AGIs $100k-200k)
Net capital gain/loss in AGI: +$5,115 (reported on 12.1% of returns)
Here:
+$5,115
State:
+$23,522
(% of AGI for various income ranges: 7.7% for AGIs below $25k, 20.4% for AGIs $25k-50k, 87.5% for AGIs $50k-75k, 821.7% for AGIs $100k-200k)
Profit/loss from business: +$11,550 (reported on 13.1% of returns)
Here:
+$11,550
State:
+$16,274
(% of AGI for various income ranges: 122.7% for AGIs below $25k, 180.0% for AGIs $25k-50k, 289.2% for AGIs $50k-75k, 895.0% for AGIs $100k-200k)
Taxable individual retirement arrangement distribution: $14,208 (reported on 11.2% of returns)
16350:
$14,208
Pennsylvania:
$18,583
(% of AGI for various income ranges: 105.4% for AGIs below $25k, 99.1% for AGIs $25k-50k, 577.5% for AGIs $50k-75k, 850.0% for AGIs $100k-200k)
Earned income credit: $2,127 (reported on 14.0% of returns)
Here:
$2,127
State:
$2,100
(% of AGI for various income ranges: 61.5% for AGIs below $25k, 69.1% for AGIs $25k-50k)
Percentage of individuals using paid preparers for their 2020 taxes: 93.5%
Here:
93%
State:
92%
(% for various income ranges: 92.1% for AGIs below $25k, 93.1% for AGIs $25k-50k, 94.1% for AGIs $50k-75k, 100.0% for AGIs $75k-100k, 91.7% for AGIs $100k-200k)
Averages for the 2012 tax year for zip code 16350, filed in 2013:
Average Adjusted Gross Income (AGI) in 2012: $39,946 (Individual Income Tax Returns)
Here:
$39,946
State:
$61,346
Salary/wage: $35,784 (reported on 78.1% of returns)
Here:
$35,784
State:
$51,902
(% of AGI for various income ranges: 71.8% for AGIs below $25k, 75.0% for AGIs $25k-50k, 78.9% for AGIs $50k-75k, 71.0% for AGIs $75k-100k, 53.9% for AGIs $100k-200k)
Taxable interest for individuals: $574 (reported on 29.8% of returns)
This zip code:
$574
Pennsylvania:
$1,588
(% of AGI for various income ranges: 0.7% for AGIs below $25k, 0.6% for AGIs $25k-50k, 0.3% for AGIs $50k-75k, 0.2% for AGIs $75k-100k, 0.4% for AGIs $100k-200k)
Ordinary dividends: $3,223 (reported on 19.3% of returns)
Here:
$3,223
State:
$5,827
(% of AGI for various income ranges: 1.1% for AGIs below $25k, 0.7% for AGIs $25k-50k, 0.4% for AGIs $50k-75k, 1.5% for AGIs $75k-100k, 4.0% for AGIs $100k-200k)
Net capital gain/loss in AGI: +$4,042 (reported on 10.5% of returns)
Here:
+$4,042
State:
+$14,495
(% of AGI for various income ranges: 2.2% for AGIs $25k-50k, 0.7% for AGIs $75k-100k, 1.9% for AGIs $100k-200k)
Profit/loss from business: +$11,225 (reported on 17.5% of returns)
Here:
+$11,225
State:
+$16,268
(% of AGI for various income ranges: 7.9% for AGIs below $25k, 4.7% for AGIs $25k-50k, 2.0% for AGIs $50k-75k, 12.4% for AGIs $75k-100k)
Taxable individual retirement arrangement distribution: $8,292 (reported on 11.4% of returns)
16350:
$8,292
Pennsylvania:
$14,550
(% of AGI for various income ranges: 3.5% for AGIs below $25k, 4.3% for AGIs $25k-50k, 4.6% for AGIs $75k-100k)
Total itemized deductions: $15,533 (20% of AGI, reported on 13.2% of returns)
Here:
$15,533
State:
$23,538
Here:
19.8% of AGI
State:
18.4% of AGI
(% of AGI for various income ranges: 5.2% for AGIs $25k-50k, 4.3% for AGIs $50k-75k, 6.0% for AGIs $75k-100k, 8.1% for AGIs $100k-200k)
Charity contributions: $4,090 (reported on 8.8% of returns)
Here:
$4,090
State:
$4,025
(% of AGI for various income ranges: 0.6% for AGIs $25k-50k, 0.8% for AGIs $50k-75k, 1.0% for AGIs $75k-100k, 1.7% for AGIs $100k-200k)
Taxes paid: $6,000 (reported on 13.2% of returns)
16350:
$6,000
State:
$9,982
(% of AGI for various income ranges: 1.3% for AGIs $25k-50k, 1.6% for AGIs $50k-75k, 1.8% for AGIs $75k-100k, 4.4% for AGIs $100k-200k)
Earned income credit: $1,935 (reported on 17.5% of returns)
Here:
$1,935
State:
$2,106
(% of AGI for various income ranges: 4.4% for AGIs below $25k, 1.1% for AGIs $25k-50k)
Percentage of individuals using paid preparers for their 2012 taxes: 53.5%
Here:
54%
State:
53%
(% for various income ranges: 46.0% for AGIs below $25k, 58.1% for AGIs $25k-50k, 56.2% for AGIs $50k-75k, 60.0% for AGIs $75k-100k, 71.4% for AGIs $100k-200k)
Averages for the 2004 tax year for zip code 16350, filed in 2005:
Average Adjusted Gross Income (AGI) in 2004: $31,754 (Individual Income Tax Returns)
Here:
$31,754
State:
$48,049
Salary/wage: $30,148 (reported on 83.5% of returns)
Here:
$30,148
State:
$42,646
(% of AGI for various income ranges: 119.9% for AGIs below $10k, 71.5% for AGIs $10k-25k, 81.0% for AGIs $25k-50k, 85.4% for AGIs $50k-75k, 75.2% for AGIs $75k-100k, 67.2% for AGIs over 100k)
Taxable interest for individuals: $990 (reported on 44.4% of returns)
This zip code:
$990
Pennsylvania:
$1,657
(% of AGI for various income ranges: 5.0% for AGIs below $10k, 2.7% for AGIs $10k-25k, 1.1% for AGIs $25k-50k, 0.8% for AGIs $50k-75k, 1.0% for AGIs $75k-100k, 1.2% for AGIs over 100k)
Taxable dividends: $1,440 (reported on 21.1% of returns)
Here:
$1,440
State:
$3,566
(% of AGI for various income ranges: 2.6% for AGIs below $10k, 1.2% for AGIs $10k-25k, 0.8% for AGIs $25k-50k, 0.7% for AGIs $50k-75k, 0.8% for AGIs $75k-100k, 1.4% for AGIs over 100k)
Net capital gain/loss: +$1,655 (reported on 15.6% of returns)
Here:
+$1,655
State:
+$9,716
(% of AGI for various income ranges: -2.8% for AGIs below $10k, 1.1% for AGIs $10k-25k, 1.2% for AGIs $25k-50k, 0.5% for AGIs $50k-75k, 1.1% for AGIs $75k-100k, 0.4% for AGIs over 100k)
Profit/loss from business: +$9,148 (reported on 14.8% of returns)
Here:
+$9,148
State:
+$14,267
(% of AGI for various income ranges: -9.2% for AGIs below $10k, 5.5% for AGIs $10k-25k, 3.6% for AGIs $25k-50k, 0.6% for AGIs $50k-75k, 17.0% for AGIs $75k-100k)
Profit/loss from farming: +$2,450 (reported on 3.6% of returns)
Here:
+$2,450
State:
+$274
IRA payment deduction: $2,455 (reported on 2.0% of returns)
16350:
$2,455
Pennsylvania:
$2,903
Total itemized deductions: $14,080 (22% of AGI, reported on 13.7% of returns)
Here:
$14,080
State:
$18,804
Here:
22.5% of AGI
State:
19.5% of AGI
(% of AGI for various income ranges: 6.0% for AGIs $10k-25k, 4.9% for AGIs $25k-50k, 5.4% for AGIs $50k-75k, 7.3% for AGIs $75k-100k, 11.1% for AGIs over 100k)
Charity contributions deductions: $2,868 (4% of AGI, reported on 11.0% of returns)
Here:
$2,868
State:
$3,337
Here:
4.3% of AGI
State:
3.3% of AGI
(% of AGI for various income ranges: 0.6% for AGIs $10k-25k, 0.8% for AGIs $25k-50k, 0.9% for AGIs $50k-75k, 1.1% for AGIs $75k-100k, 2.5% for AGIs over 100k)
Total tax: $3,612 (reported on 70.5% of returns)
16350:
$3,612
State:
$8,008
(% of AGI for various income ranges: 2.6% for AGIs below $10k, 3.6% for AGIs $10k-25k, 6.2% for AGIs $25k-50k, 8.4% for AGIs $50k-75k, 11.1% for AGIs $75k-100k, 16.8% for AGIs over 100k)
Earned income credit: $1,717 (reported on 15.8% of returns)
Here:
$1,717
State:
$1,643
Percentage of individuals using paid preparers for their 2004 taxes: 60.1%
Here:
60%
State:
56%
(% for various income ranges: 49.8% for AGIs below $10k, 61.0% for AGIs $10k-25k, 65.3% for AGIs $25k-50k, 59.7% for AGIs $50k-75k, 61.8% for AGIs $75k-100k, 84.6% for AGIs over 100k)
Likely homosexual households (counted as self-reported same-sex unmarried-partner households)
Lesbian couples: 0.0% of all households
Gay men: 0.3% of all households
Household received Food Stamps/SNAP in the past 12 months: 75 Household did not receive Food Stamps/SNAP in the past 12 months: 779
Women who had a birth in the past 12 months: 32 (34 now married, 0 unmarried) Women who did not have a birth in the past 12 months: 391 (161 now married, 229 unmarried)
Housing units in zip code 16350 with a mortgage: 321 (27 second mortgage, 26 both second mortgage and home equity loan) Houses without a mortgage: 53
Median monthly owner costs for units with a mortgage: $1,229 Median monthly owner costs for units without a mortgage: $424
Residents with income below the poverty level in 2022:
This zip code:
19.8%
Whole state:
11.8%
Residents with income below 50% of the poverty level in 2022:
This zip code:
10.7%
Whole state:
6.1%
Median number of rooms in houses and condos:
Here:
6.5
State:
6.8
Median number of rooms in apartments:
Here:
5.8
State:
4.3
Notable locations in this zip code not listed on our city pages
Notable locations in zip code 16350: Jackson Valley Golf Course (A), Alcuin (B), Frondelius Corners (C), Gourleys Corners (D), Nuttal (E), Preston Corners (F), Wheeler Corners (G), Sugar Grove Volunteer Fire Department / Sugar Grove Ambulance Service Station 63 (H). Display/hide their locations on the map
In group quarters: 1 (-1 institutionalized population)
Size of family households: 327 2-persons, 88 3-persons, 94 4-persons, 33 5-persons, 26 6-persons, 28 7-or-more-persons
Size of nonfamily households: 213 1-person, 47 2-persons
398 married couples with children.
84 single-parent households (58 men, 26 women).
91.0% of residents of 16350 zip code speak English at home.
1.3% of residents speak Spanish at home (71% very well, 29% well).
7.5% of residents speak other Indo-European language at home (29% very well, 48% well, 18% not well, 4% not at all).
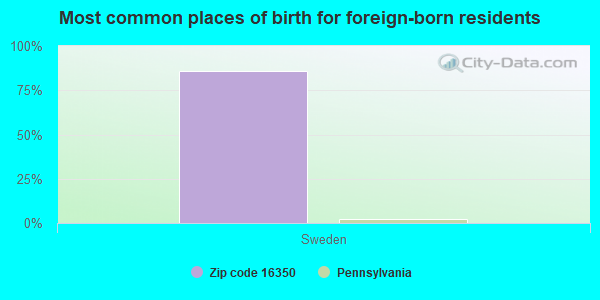
Foreign born population: 7 (0.3%) (0.0% of them are naturalized citizens)
:
0.3%
Whole state:
7.5%
86%Sweden
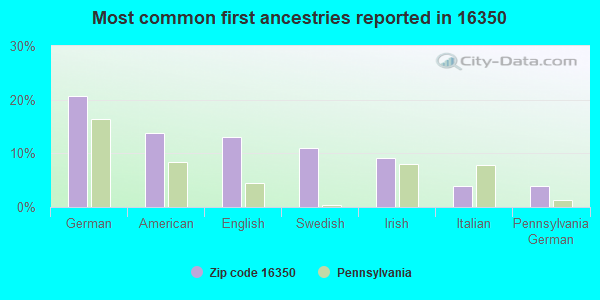
21%German
14%American
13%English
11%Swedish
9%Irish
4%Italian
4%Pennsylvania German
Year of entry for the foreign-born population
02010 or later
02000 to 2009
61990 to 1999
25Before 1990
Facilities with environmental interests located in this zip code:
BETTY CHASE (RR 2 BOX 123 in SUGAR GROVE, PA)
National Pollutant Discharge Elimination System NON-MAJOR (Tracking pollutant discharge elimination systems) - permit Business SIC classification: OPERATORS OF DWELLINGS OTHER THAN APARTMENT BUILDINGS Alternative names: CHASE SR, ROBERT, ROBERT CHASE SR
Housing units lacking complete plumbing facilities: 8.2% Housing units lacking complete kitchen facilities: 8.1%
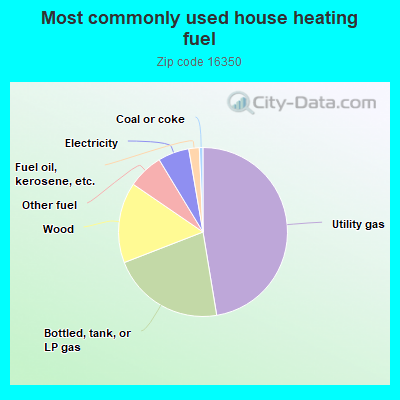
47.6%Utility gas
21.8%Bottled, tank, or LP gas
15.5%Wood
6.8%Other fuel
6.0%Electricity
2.0%Fuel oil, kerosene, etc.
0.7%Coal or coke
Population in 1990: 3,592.
Place of birth for U.S.-born residents:
This state: 1,529
Northeast: 634
Midwest: 43
South: 82
West: 6
75% of the 16350 zip code residents lived in the same house 5 years ago. Out of people who lived in different houses, 61% lived in this county. Out of people who lived in different counties, 50% lived in Pennsylvania.
96% of the 16350 zip code residents lived in the same house 1 year ago. Out of people who lived in different houses, 61% moved from this county. Out of people who lived in different houses, 21% moved from different county within same state. Out of people who lived in different houses, 21% moved from different state.
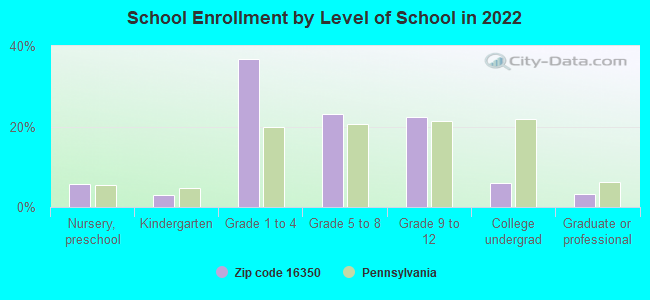
Private vs. public school enrollment:
Students in private schools in grades 1 to 8 (elementary and middle school): 37
Here:
14.6%
Pennsylvania:
15.7%
Students in private schools in grades 9 to 12 (high school): 9
Here:
10.1%
Pennsylvania:
13.4%
Students in private undergraduate colleges: 19
Here:
77.2%
Pennsylvania:
39.8%
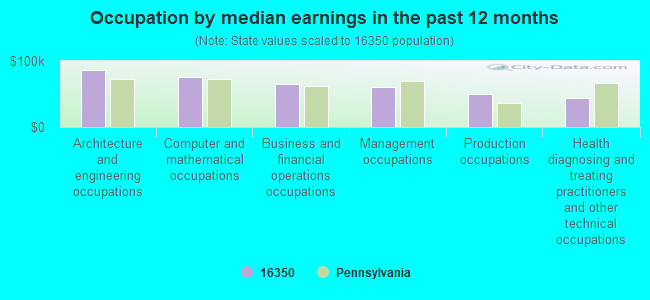
Occupation by median earnings in the past 12 months ($)
85,828Architecture and engineering occupations
76,162Computer and mathematical occupations
64,765Business and financial operations occupations
60,647Management occupations
49,636Production occupations
43,428Health diagnosing and treating practitioners and other technical occupations
Top industries in this zip code by the number of employees in 2005:
Accommodation and Food Services: Full-Service Restaurants (20-49 employees: 1 establishment)
Other Services (except Public Administration): Civic and Social Organizations (10-19: 1)
Mining: Support Activities for Oil and Gas Operations (10-19: 1)
Other Services (except Public Administration): Religious Organizations (5-9: 1, 1-4: 1)
Wholesale Trade: Grain and Field Bean Merchant Wholesalers (5-9: 1)
Fatal accident statistics in 2013:
Fatal accident count: 1
Vehicles involved in fatal accidents: 2
Fatal accidents caused by drunken drivers: 0
Fatalities: 1
Persons involved in fatal accidents: 2
Pedestrians involved in fatal accidents: 0
Fatal accident statistics in 2011:
Fatal accident count: 1
Vehicles involved in fatal accidents: 1
Fatal accidents caused by drunken drivers: 1
Fatalities: 1
Persons involved in fatal accidents: 3
Pedestrians involved in fatal accidents: 0
2003 - 2018 National Fire Incident Reporting System (NFIRS) incidents
Based on the data from the years 2003 - 2018 the average number of fire incidents per year is 7. The highest number of reported fires - 18 took place in 2012, and the least - 0 in 2011. The data has an increasing trend.
When looking into fire subcategories, the most reports belonged to: Structure Fires (65.1%), and Outside Fires (22.6%).
Fire incident types reported to NFIRS in Zip Code 16350
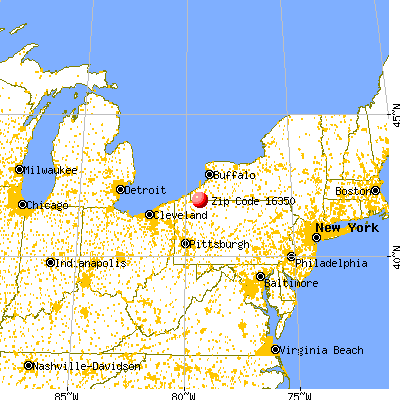


 Nearest zip codes: 16312, 16371, 14750, 16402, 14701, 14710.


 Based on the data from the years 2003 - 2018 the average number of fire incidents per year is 7. The highest number of reported fires - 18 took place in 2012, and the least - 0 in 2011. The data has an increasing trend.
 When looking into fire subcategories, the most reports belonged to: Structure Fires (65.1%), and Outside Fires (22.6%).