Estimated zip code population in 2022: 15,546 Zip code population in 2010: 16,664 Zip code population in 2000: 17,259
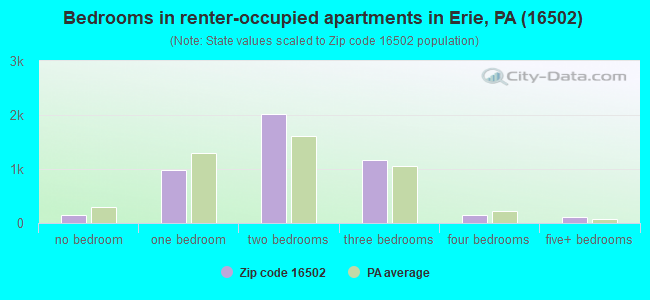
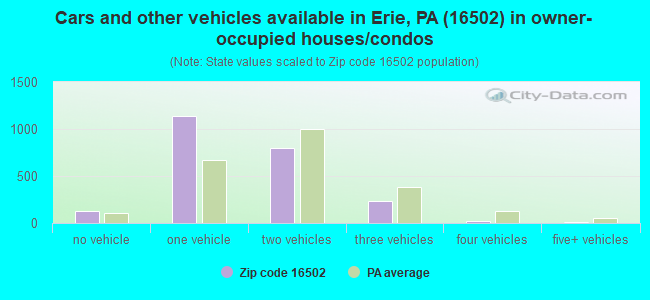
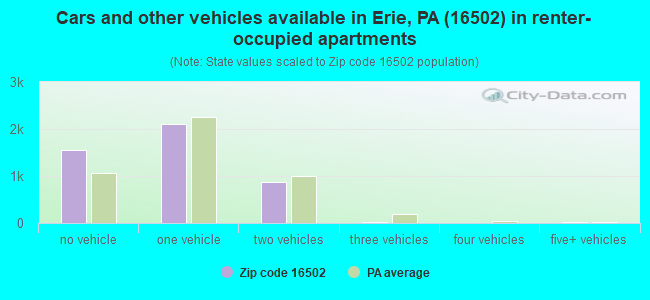
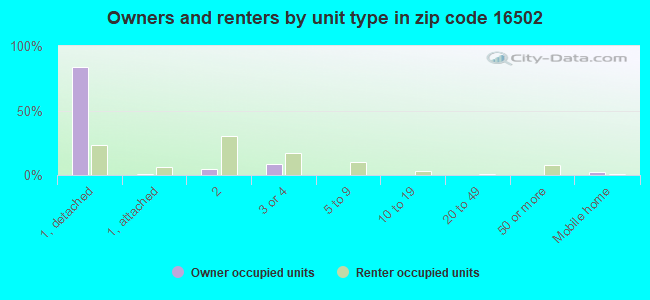
Houses and condos: 8,006 Renter-occupied apartments: 4,594
% of renters here:
66%
State:
31%
March 2022 cost of living index in zip code 16502: 90.8 (less than average, U.S. average is 100)
Land area: 2.6 sq. mi. Water area: 0.0 sq. mi.
Population density: 6,095 people per square mile
(high).
OSM Map
General Map
Google Map
MSN Map
OSM Map
General Map
Google Map
MSN Map
OSM Map
General Map
Google Map
MSN Map
OSM Map
General Map
Google Map
MSN Map
Please wait while loading the map...
Real estate property taxes paid for housing units in 2022:
This zip code:
2.2% ($2,062)
Pennsylvania:
1.3% ($3,094)
Median real estate property taxes paid for housing units with mortgages in 2022: $2,139 (2.1%) Median real estate property taxes paid for housing units with no mortgage in 2022: $2,001 (2.3%)
Averages for the 2020 tax year for zip code 16502, filed in 2021:
Average Adjusted Gross Income (AGI) in 2020: $32,959 (Individual Income Tax Returns)
Here:
$32,959
State:
$75,707
Salary/wage: $28,502 (reported on 87.0% of returns)
Here:
$28,502
State:
$62,806
(% of AGI for various income ranges: 1091.5% for AGIs below $25k, 3257.5% for AGIs $25k-50k, 6203.1% for AGIs $50k-75k, 9196.8% for AGIs $75k-100k, 16781.5% for AGIs $100k-200k)
Taxable interest for individuals: $424 (reported on 13.5% of returns)
This zip code:
$424
Pennsylvania:
$1,633
(% of AGI for various income ranges: 2.5% for AGIs below $25k, 4.6% for AGIs $25k-50k, 11.1% for AGIs $50k-75k, 41.6% for AGIs $75k-100k, 66.2% for AGIs $100k-200k)
Ordinary dividends: $2,705 (reported on 6.6% of returns)
Here:
$2,705
State:
$7,382
(% of AGI for various income ranges: 7.2% for AGIs below $25k, 10.9% for AGIs $25k-50k, 25.0% for AGIs $50k-75k, 41.1% for AGIs $75k-100k, 440.8% for AGIs $100k-200k)
Net capital gain/loss in AGI: +$2,331 (reported on 5.8% of returns)
Here:
+$2,331
State:
+$23,522
(% of AGI for various income ranges: 3.2% for AGIs below $25k, 7.8% for AGIs $25k-50k, 23.3% for AGIs $50k-75k, 62.6% for AGIs $75k-100k, 326.9% for AGIs $100k-200k)
Profit/loss from business: +$9,319 (reported on 8.5% of returns)
Here:
+$9,319
State:
+$16,274
(% of AGI for various income ranges: 46.7% for AGIs below $25k, 64.8% for AGIs $25k-50k, 135.0% for AGIs $50k-75k, 405.3% for AGIs $75k-100k, 1004.6% for AGIs $100k-200k)
Taxable individual retirement arrangement distribution: $10,452 (reported on 4.6% of returns)
16502:
$10,452
Pennsylvania:
$18,583
(% of AGI for various income ranges: 27.7% for AGIs below $25k, 24.6% for AGIs $25k-50k, 106.9% for AGIs $50k-75k, 260.5% for AGIs $75k-100k, 735.4% for AGIs $100k-200k)
Total itemized deductions: $37,300 (reported on 0.9% of returns)
Here:
$37,300
State:
$34,850
(% of AGI for various income ranges: 57.9% for AGIs $25k-50k, 840.0% for AGIs $100k-200k)
Charity contributions: $10,033 (reported on 0.4% of returns)
Here:
$10,033
State:
$12,392
(% of AGI for various income ranges: 158.4% for AGIs $75k-100k)
Taxes paid: $4,486 (reported on 1.0% of returns)
16502:
$4,486
State:
$8,200
(% of AGI for various income ranges: 5.7% for AGIs $25k-50k, 154.6% for AGIs $100k-200k)
Earned income credit: $2,379 (reported on 29.7% of returns)
Here:
$2,379
State:
$2,100
(% of AGI for various income ranges: 111.5% for AGIs below $25k, 91.5% for AGIs $25k-50k)
Percentage of individuals using paid preparers for their 2020 taxes: 95.2%
Here:
95%
State:
92%
(% for various income ranges: 94.4% for AGIs below $25k, 96.5% for AGIs $25k-50k, 95.6% for AGIs $50k-75k, 92.6% for AGIs $75k-100k, 95.0% for AGIs $100k-200k, 100.0% for AGIs over 200k)
Averages for the 2012 tax year for zip code 16502, filed in 2013:
Average Adjusted Gross Income (AGI) in 2012: $27,313 (Individual Income Tax Returns)
Here:
$27,313
State:
$61,346
Salary/wage: $25,535 (reported on 89.9% of returns)
Here:
$25,535
State:
$51,902
(% of AGI for various income ranges: 84.2% for AGIs below $25k, 87.6% for AGIs $25k-50k, 83.9% for AGIs $50k-75k, 82.4% for AGIs $75k-100k, 73.5% for AGIs $100k-200k)
Taxable interest for individuals: $531 (reported on 17.0% of returns)
This zip code:
$531
Pennsylvania:
$1,588
(% of AGI for various income ranges: 0.4% for AGIs below $25k, 0.3% for AGIs $25k-50k, 0.3% for AGIs $50k-75k, 0.3% for AGIs $75k-100k, 0.4% for AGIs $100k-200k)
Ordinary dividends: $2,330 (reported on 8.0% of returns)
Here:
$2,330
State:
$5,827
(% of AGI for various income ranges: 0.4% for AGIs below $25k, 0.4% for AGIs $25k-50k, 0.4% for AGIs $50k-75k, 1.1% for AGIs $75k-100k, 2.3% for AGIs $100k-200k)
Net capital gain/loss in AGI: +$1,348 (reported on 4.6% of returns)
Here:
+$1,348
State:
+$14,495
(% of AGI for various income ranges: 0.2% for AGIs $25k-50k, 0.2% for AGIs $50k-75k, 1.3% for AGIs $100k-200k)
Profit/loss from business: +$7,761 (reported on 8.6% of returns)
Here:
+$7,761
State:
+$16,268
(% of AGI for various income ranges: 3.7% for AGIs below $25k, 2.0% for AGIs $25k-50k, 1.4% for AGIs $50k-75k, 5.0% for AGIs $75k-100k)
Taxable individual retirement arrangement distribution: $7,183 (reported on 4.9% of returns)
16502:
$7,183
Pennsylvania:
$14,550
(% of AGI for various income ranges: 1.3% for AGIs below $25k, 1.0% for AGIs $25k-50k, 1.6% for AGIs $50k-75k, 2.9% for AGIs $75k-100k)
Total itemized deductions: $13,624 (22% of AGI, reported on 8.2% of returns)
Here:
$13,624
State:
$23,538
Here:
21.6% of AGI
State:
18.4% of AGI
(% of AGI for various income ranges: 1.6% for AGIs below $25k, 3.4% for AGIs $25k-50k, 5.3% for AGIs $50k-75k, 5.4% for AGIs $75k-100k, 9.2% for AGIs $100k-200k)
Charity contributions: $2,594 (reported on 5.1% of returns)
Here:
$2,594
State:
$4,025
(% of AGI for various income ranges: 0.3% for AGIs $25k-50k, 0.7% for AGIs $50k-75k, 0.6% for AGIs $75k-100k, 1.5% for AGIs $100k-200k)
Taxes paid: $5,175 (reported on 8.0% of returns)
16502:
$5,175
State:
$9,982
(% of AGI for various income ranges: 0.4% for AGIs below $25k, 1.2% for AGIs $25k-50k, 1.8% for AGIs $50k-75k, 2.2% for AGIs $75k-100k, 4.5% for AGIs $100k-200k)
Earned income credit: $2,313 (reported on 34.3% of returns)
Here:
$2,313
State:
$2,106
(% of AGI for various income ranges: 8.9% for AGIs below $25k, 1.4% for AGIs $25k-50k)
Percentage of individuals using paid preparers for their 2012 taxes: 43.0%
Here:
43%
State:
53%
(% for various income ranges: 39.7% for AGIs below $25k, 45.1% for AGIs $25k-50k, 51.6% for AGIs $50k-75k, 56.5% for AGIs $75k-100k, 57.1% for AGIs $100k-200k)
Averages for the 2004 tax year for zip code 16502, filed in 2005:
Average Adjusted Gross Income (AGI) in 2004: $24,611 (Individual Income Tax Returns)
Here:
$24,611
State:
$48,049
Salary/wage: $23,374 (reported on 90.0% of returns)
Here:
$23,374
State:
$42,646
(% of AGI for various income ranges: 85.8% for AGIs below $10k, 85.9% for AGIs $10k-25k, 89.4% for AGIs $25k-50k, 87.8% for AGIs $50k-75k, 79.6% for AGIs $75k-100k, 58.7% for AGIs over 100k)
Taxable interest for individuals: $897 (reported on 31.2% of returns)
This zip code:
$897
Pennsylvania:
$1,657
(% of AGI for various income ranges: 2.0% for AGIs below $10k, 1.0% for AGIs $10k-25k, 1.0% for AGIs $25k-50k, 0.8% for AGIs $50k-75k, 2.8% for AGIs $75k-100k, 0.7% for AGIs over 100k)
Taxable dividends: $1,573 (reported on 12.5% of returns)
Here:
$1,573
State:
$3,566
(% of AGI for various income ranges: 1.3% for AGIs below $10k, 0.6% for AGIs $10k-25k, 0.6% for AGIs $25k-50k, 0.6% for AGIs $50k-75k, 1.2% for AGIs $75k-100k, 2.5% for AGIs over 100k)
Net capital gain/loss: +$1,353 (reported on 7.7% of returns)
Here:
+$1,353
State:
+$9,716
(% of AGI for various income ranges: -0.6% for AGIs below $10k, 0.2% for AGIs $10k-25k, 0.3% for AGIs $25k-50k, -0.0% for AGIs $50k-75k, 0.7% for AGIs $75k-100k, 4.2% for AGIs over 100k)
Profit/loss from business: +$6,684 (reported on 8.6% of returns)
Here:
+$6,684
State:
+$14,267
(% of AGI for various income ranges: 4.5% for AGIs below $10k, 2.3% for AGIs $10k-25k, 1.8% for AGIs $25k-50k, 1.6% for AGIs $50k-75k, 3.4% for AGIs $75k-100k, 5.3% for AGIs over 100k)
IRA payment deduction: $2,017 (reported on 1.8% of returns)
16502:
$2,017
Pennsylvania:
$2,903
Total itemized deductions: $12,098 (23% of AGI, reported on 10.3% of returns)
Here:
$12,098
State:
$18,804
Here:
23.2% of AGI
State:
19.5% of AGI
(% of AGI for various income ranges: 2.4% for AGIs below $10k, 2.6% for AGIs $10k-25k, 4.2% for AGIs $25k-50k, 6.6% for AGIs $50k-75k, 9.9% for AGIs $75k-100k, 11.5% for AGIs over 100k)
Charity contributions deductions: $2,623 (5% of AGI, reported on 7.6% of returns)
Here:
$2,623
State:
$3,337
Here:
4.5% of AGI
State:
3.3% of AGI
(% of AGI for various income ranges: 0.2% for AGIs below $10k, 0.2% for AGIs $10k-25k, 0.5% for AGIs $25k-50k, 0.9% for AGIs $50k-75k, 1.9% for AGIs $75k-100k, 4.2% for AGIs over 100k)
Total tax: $2,850 (reported on 63.5% of returns)
16502:
$2,850
State:
$8,008
(% of AGI for various income ranges: 1.5% for AGIs below $10k, 3.8% for AGIs $10k-25k, 6.9% for AGIs $25k-50k, 9.3% for AGIs $50k-75k, 11.5% for AGIs $75k-100k, 18.0% for AGIs over 100k)
Earned income credit: $1,801 (reported on 29.0% of returns)
Here:
$1,801
State:
$1,643
Percentage of individuals using paid preparers for their 2004 taxes: 51.8%
Here:
52%
State:
56%
(% for various income ranges: 48.5% for AGIs below $10k, 53.0% for AGIs $10k-25k, 52.5% for AGIs $25k-50k, 53.4% for AGIs $50k-75k, 59.4% for AGIs $75k-100k, 60.9% for AGIs over 100k)
Likely homosexual households (counted as self-reported same-sex unmarried-partner households)
Lesbian couples: 0.1% of all households
Gay men: 0.1% of all households
Household received Food Stamps/SNAP in the past 12 months: 2,382 Household did not receive Food Stamps/SNAP in the past 12 months: 4,604
Women who had a birth in the past 12 months: 194 (74 now married, 107 unmarried) Women who did not have a birth in the past 12 months: 4,041 (993 now married, 3,069 unmarried)
Housing units in zip code 16502 with a mortgage: 1,165 (51 second mortgage, 49 both second mortgage and home equity loan) Median monthly owner costs for units with a mortgage: $972 Median monthly owner costs for units without a mortgage: $450
Residents with income below the poverty level in 2022:
This zip code:
29.5%
Whole state:
11.8%
Residents with income below 50% of the poverty level in 2022:
This zip code:
17.6%
Whole state:
6.1%
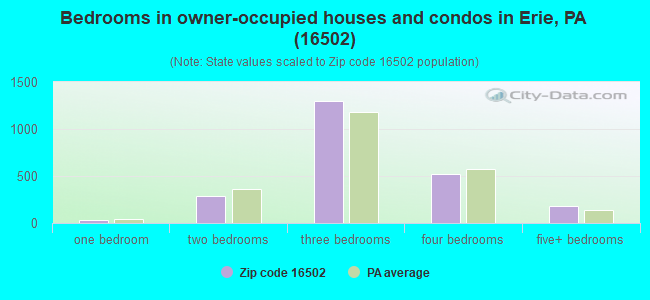
Median number of rooms in houses and condos:
Here:
6.8
State:
6.8
Median number of rooms in apartments:
Here:
4.8
State:
4.3
Notable locations in this zip code not listed on our city pages
Churches in zip code 16502 include: Holy Trinity Lutheran Church (A), Saint Matthew's Lutheran Church (B), First Christian Church (C), Saint Johns Evangelical Lutheran Church (D). Display/hide their locations on the map
678 married couples with children.
1,678 single-parent households (168 men, 1,510 women).
86.5% of residents of 16502 zip code speak English at home.
8.9% of residents speak Spanish at home (60% very well, 18% well, 20% not well, 2% not at all).
3.3% of residents speak other Indo-European language at home (82% very well, 9% well, 1% not well, 8% not at all).
0.5% of residents speak Asian or Pacific Island language at home (39% very well, 38% well, 22% not well).
0.6% of residents speak other language at home (100% very well).
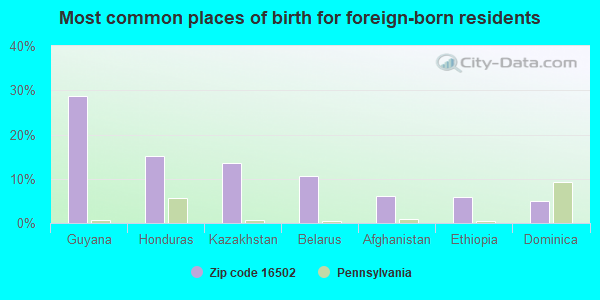
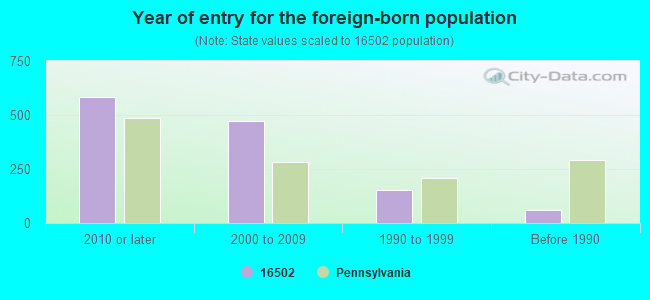
Foreign born population: 988 (6.4%) (55.9% of them are naturalized citizens)
Facilities with environmental interests located in this zip code:
BAY CITY FORGE AMERIDRIVES INTL (1802 CRANBERRY ST. in ERIE, PA)
AIR MINOR (AIRS/AFS) COMPLIANCE ACTIVITY (Tracking inspections of insecticide, fungicide, and rodenticide, and toxic substances) STATE MASTER (Pennsylvania database) - AFS-54-1826102-1, AIR PROGRAM, RCRIS-PAR000026062, HAZARDOUS WASTE PROGRAM TRI REPORTER (Tracking of toxic chemicals releasing facilities) Business SIC classification: STEEL FOUNDRIES; IRON AND STEEL FORGINGS Organizations: BAY CITY FORGE 2002, INC. (CONTACT/OWNER)
Alternative names: BAY CITY FORGE/ERIE
ATLANTIC SVC STA (BROWN & LIBERTY in ERIE, PA)
STATE MASTER (Pennsylvania database) - RCRIS-PAD987341492, HAZARDOUS WASTE PROGRAM Conditionally Exempt Small Quantity Generators, less than 100 kg/month of hazardous waste (Resource Conservation and Recovery Act (tracking hazardous waste)) - notification Organizations: OPERNAME (CONTACT/OPERATOR)
, ATLANTIC REFINING & MARKETING (CONTACT/OWNER)
, ATLANTIC REFINING & MARKETING CORPORATION (OWNER/OPERATOR)
BIZZARRO TOWING (1130 W 16TH ST in ERIE, PA)
STATE MASTER (Pennsylvania database) - RCRIS-PAD987401528, HAZARDOUS WASTE PROGRAM Small Quantity Generators, between 100 kg and 1000 kg of hazardous waste/month (Resource Conservation and Recovery Act (tracking hazardous waste)) - notification TRANSPORTER (Resource Conservation and Recovery Act (tracking hazardous waste)) - notification Organizations: BIZZARRO JANICE (CONTACT/OWNER)
Alternative names: BIZZARO TOWING, BIZZARRO TOWING & USED PARTS
ANGELO TRANSMISSIONS SERVICE (214 WEST 16TH STREET in ERIE, PA)
Small Quantity Generators, between 100 kg and 1000 kg of hazardous waste/month (Resource Conservation and Recovery Act (tracking hazardous waste)) - notification Business NAICS classification: AUTOMOTIVE TRANSMISSION REPAIR. Organizations: OPERNAME (CONTACT/OPERATOR)
, MEZZACAPO, ANGELO (CONTACT/OWNER)
AUTO CYCLE INC (2022 SCHAPER AVE in ERIE, PA)
National Pollutant Discharge Elimination System NON-MAJOR (Tracking pollutant discharge elimination systems) - permit Business SIC classification: MOTOR VEHICLE PARTS, USED
BABCOCK POWER INC/RILEY POWER (1420 CASCADE ST in ERIE, PA)
National Pollutant Discharge Elimination System NON-MAJOR (Tracking pollutant discharge elimination systems) - permit Business SIC classification: FABRICATED PLATE WORK (BOILER SHOPS)
ANTHONYS CLEANERS (2424 PEACH ST in ERIE, PA)
Conditionally Exempt Small Quantity Generators, less than 100 kg/month of hazardous waste (Resource Conservation and Recovery Act (tracking hazardous waste)) - notification Organizations: RON FERANDES (CONTACT/OWNER)
Alternative names: ANTHONYS CLNR SVC
BANKA, LEO & SON AUTO BODY (1002 W 18TH ST in ERIE, PA)
Conditionally Exempt Small Quantity Generators, less than 100 kg/month of hazardous waste (Resource Conservation and Recovery Act (tracking hazardous waste)) Business NAICS classification: AUTOMOTIVE BODY, PAINT, AND INTERIOR REPAIR AND MAINTENANCE.; ALL OTHER AUTOMOTIVE REPAIR AND MAINTENANCE. Organizations: OPERNAME (CONTACT/OPERATOR)
1308 W. 9TH STREET (1308 W. 9TH STREET in ERIE, PA)
COMPLIANCE ACTIVITY (Tracking inspections of insecticide, fungicide, and rodenticide, and toxic substances)
Housing units lacking complete plumbing facilities: 1.2% Housing units lacking complete kitchen facilities: 4.8%
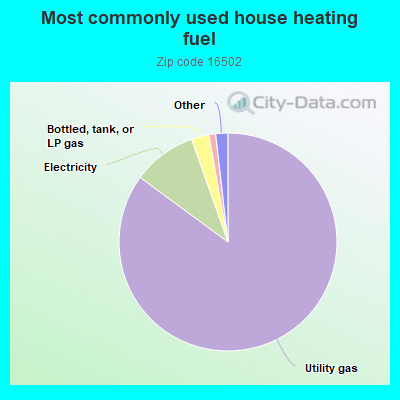
85.1%Utility gas
9.5%Electricity
2.6%Bottled, tank, or LP gas
1.0%Fuel oil, kerosene, etc.
0.8%Wood
0.7%Other fuel
Population in 1990: 18,640.
Place of birth for U.S.-born residents:
This state: 10,568
Northeast: 738
Midwest: 1,381
South: 1,220
West: 429
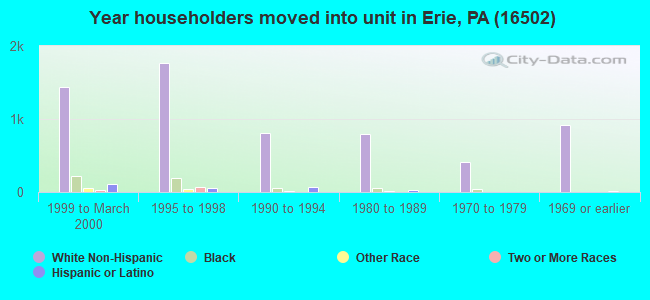
52% of the 16502 zip code residents lived in the same house 5 years ago. Out of people who lived in different houses, 76% lived in this county. Out of people who lived in different counties, 50% lived in Pennsylvania.
79% of the 16502 zip code residents lived in the same house 1 year ago. Out of people who lived in different houses, 74% moved from this county. Out of people who lived in different houses, 9% moved from different county within same state. Out of people who lived in different houses, 10% moved from different state. Out of people who lived in different houses, 4% moved from abroad.
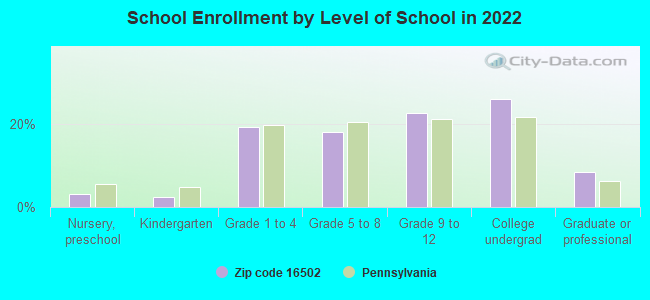
Private vs. public school enrollment:
Students in private schools in grades 1 to 8 (elementary and middle school): 301
Here:
21.6%
Pennsylvania:
15.7%
Students in private schools in grades 9 to 12 (high school): 181
Here:
21.6%
Pennsylvania:
13.4%
Students in private undergraduate colleges: 518
Here:
53.4%
Pennsylvania:
39.8%
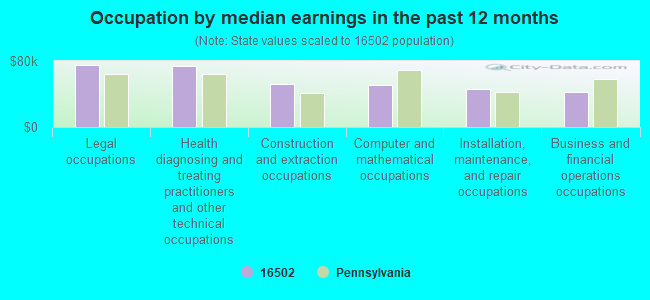
Occupation by median earnings in the past 12 months ($)
75,641Legal occupations
73,818Health diagnosing and treating practitioners and other technical occupations
51,560Construction and extraction occupations
50,815Computer and mathematical occupations
45,840Installation, maintenance, and repair occupations
42,667Business and financial operations occupations
Companies with federal contracts located in this zip code (ERIE, PA):
ERIE FORGE AND STEEL, INC (1341 WEST 16TH STREET; small business) : $17,916,064 in 56 contractsfrom 2000 to 2005
Contracts for Ship and Boat Propulsion Components, Power and Hand Pumps, Maintenance, Repair and Rebuilding of Equipment -- Maintenance and Repair Shop Equipment by Navy, United States Coast Guard (disused code: now 7008), U.S. Coast Guard Signed by year:2000: $1,523,906; 2001: $2,210,287; 2002: $1,335,054; 2003: $4,323,460; 2004: $3,264,774; 2005: $5,258,583; 2006: $0.
Biggest contracts:
$1,850,432 with Navy for Ship and Boat Propulsion Components. Signed on 2005-03-07. Completion date: 2007-02-02.
$1,119,747, same as above.Signed on 2005-09-20. Completion date: 2007-03-20.
$795,099, same as above.Signed on 2003-09-23. Completion date: 2005-03-23.
$771,542, same as above.Signed on 2001-09-25. Completion date: 2001-09-26.
$21,832 with U.S. Army Corps of Engineers - civil program financing only for Miscellaneous Electric Power and Distribution Equipment. Signed on 2005-08-17. Completion date: 2005-09-30.
$21,832 with Army for Miscellaneous Electric Power and Distribution Equipment. Signed on 2005-08-17. Completion date: 2005-09-30.
$10,468 with U.S. Army Corps of Engineers - civil program financing only for Miscellaneous Items. Signed on 2005-06-21. Completion date: 2005-06-30.
$10,468 with Army for Miscellaneous Items. Signed on 2005-06-21. Completion date: 2005-06-30.
AMERIDRIVES INTERNATIONAL LP (1802 PITTSBURGH AVE) : $62,898 in 6 contractsfrom 2005 to 2006
Contracts for Torque Converters and Speed Changers, Electrical and Electronic assemblies, Boards, Cards, and Associated Hardware, Bolts, Airframe Structural Components by Navy, Defense Logistics Agency Signed by year:2000: $0; 2001: $0; 2002: $0; 2003: $0; 2004: $0; 2005: $23,151; 2006: $39,747.
Biggest contracts:
$28,760 with Navy for Torque Converters and Speed Changers. Signed on 2006-01-11. Completion date: 2006-05-01.
$16,155 with Defense Logistics Agency for Torque Converters and Speed Changers. Signed on 2005-07-05. Completion date: 2005-08-09.
$7,965 with Navy for Electrical and Electronic assemblies, Boards, Cards, and Associated Hardware. Signed on 2006-01-12. Completion date: 2006-02-11.
$6,996 with Defense Logistics Agency for Bolts. Signed on 2005-08-06. Completion date: 2005-10-19.
WEBER ELECTRIC SUPPLY, INC (1909 PEACH ST; small business)
$41,315 with Air Force for Office Furniture. Signed on 2000-09-30. Completion date: 2000-09-30.
ERIE STRAYER COMPANY (1851 RUDOLPH AVE; small business) : $36,121 in 2 contractsfrom 2001 to 2003
$32,478 with Defense Logistics Agency for Crane and Crane-Shovel Attachments. Signed on 2001-02-28. Completion date: 2001-07-28.
$3,643 with U.S. Army Corps of Engineers - civil program financing only for Iron and Steel Primary and Semifinished Products. Signed on 2003-02-19. Completion date: 2003-02-11.
STERILIZER REFURBISHING SERVIC (1231 W 9TH ST; small business) : $20,997 in 2 contractsfrom 2004 to 2005
$15,597 with Army for Maintenance, Repair and Rebuilding of Equipment -- Instruments and Laboratory Equipment. Signed on 2004-11-29. Completion date: 2004-10-28.
$5,400 with Navy for Maintenance, Repair and Rebuilding of Equipment -- Medical, Dental, and Veterinary Equipment and Supplies. Signed on 2005-02-17. Completion date: 2005-02-20.
Top industries in this zip code by the number of employees in 2005:
Health Care and Social Assistance: Offices of Physicians (except Mental Health Specialists) (over 1000 employees: 1 establishment, 50-99 employees: 2 establishments, 20-49 employees: 4 establishments, 10-19 employees: 4 establishments, 5-9 employees: 3 establishments, 1-4 employees: 6 establishments)
Professional, Scientific, and Technical Services: Other Accounting Services (250-499: 1, 5-9: 1)
Health Care and Social Assistance: Ambulance Services (100-249: 1, 10-19: 1)
Health Care and Social Assistance: Home Health Care Services (100-249: 1, 1-4: 1)
Health Care and Social Assistance: Nursing Care Facilities (100-249: 1)
Health Care and Social Assistance: Continuing Care Retirement Communities (100-249: 1)
People in group quarters in 2010:
198 people in nursing facilities/skilled-nursing facilities
56 people in emergency and transitional shelters (with sleeping facilities) for people experiencing homelessness
20 people in residential treatment centers for juveniles (non-correctional)
12 people in residential treatment centers for adults
11 people in other noninstitutional facilities
10 people in group homes intended for adults
9 people in college/university student housing
3 people in correctional residential facilities
People in group quarters in 2000:
313 people in nursing homes
69 people in hospitals/wards and hospices for chronically ill
69 people in other hospitals or wards for chronically ill
48 people in homes or halfway houses for drug/alcohol abuse
31 people in homes for the mentally retarded
30 people in halfway houses
30 people in religious group quarters
27 people in other types of correctional institutions
23 people in other group homes
19 people in training schools for juvenile delinquents
7 people in mental (psychiatric) hospitals or wards
7 people in college dormitories (includes college quarters off campus)
4 people in orthopedic wards and institutions for the physically handicapped
2 people in other nonhousehold living situations
Fatal accident statistics in 2014:
Fatal accident count: 3
Vehicles involved in fatal accidents: 3
Fatal accidents caused by drunken drivers: 0
Fatalities: 3
Persons involved in fatal accidents: 3
Pedestrians involved in fatal accidents: 1
Fatal accident statistics in 2013:
Fatal accident count: 3
Vehicles involved in fatal accidents: 10
Fatal accidents caused by drunken drivers: 2
Fatalities: 3
Persons involved in fatal accidents: 6
Pedestrians involved in fatal accidents: 0
Home Mortgage Disclosure Act Aggregated Statistics For Year 2009 (Based on 4 full and 8 partial tracts)
A) FHA, FSA/RHS & VA Home Purchase Loans
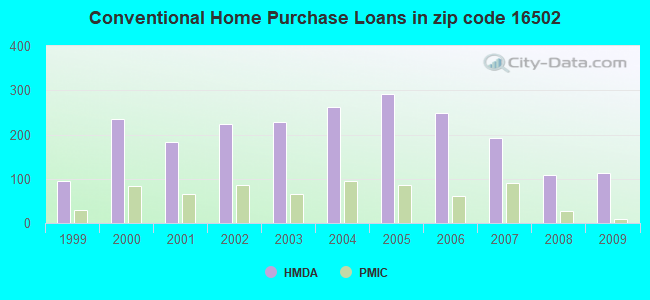
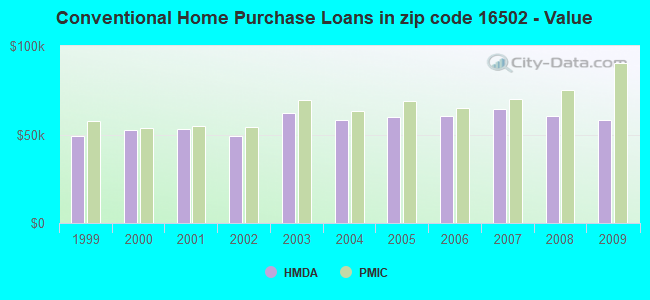
B) Conventional Home Purchase Loans
C) Refinancings
D) Home Improvement Loans
E) Loans on Dwellings For 5+ Families
F) Non-occupant Loans on < 5 Family Dwellings (A B C & D)
Number
Average Value
Number
Average Value
Number
Average Value
Number
Average Value
Number
Average Value
Number
Average Value
LOANS ORIGINATED
85
$72,805
112
$57,923
191
$64,094
66
$29,313
6
$231,813
121
$68,793
APPLICATIONS APPROVED, NOT ACCEPTED
1
$122,250
4
$84,478
16
$84,439
2
$339,695
0
$0
9
$126,633
APPLICATIONS DENIED
5
$73,252
13
$80,773
120
$71,665
27
$24,954
0
$0
10
$77,973
APPLICATIONS WITHDRAWN
8
$83,996
6
$54,448
62
$74,960
1
$46,240
0
$0
7
$78,264
FILES CLOSED FOR INCOMPLETENESS
0
$0
0
$0
8
$86,536
0
$0
0
$0
3
$77,340
Aggregated Statistics For Year 2008 (Based on 4 full and 8 partial tracts)
A) FHA, FSA/RHS & VA Home Purchase Loans
B) Conventional Home Purchase Loans
C) Refinancings
D) Home Improvement Loans
E) Loans on Dwellings For 5+ Families
F) Non-occupant Loans on < 5 Family Dwellings (A B C & D)
G) Loans On Manufactured Home Dwelling (A B C & D)
Number
Average Value
Number
Average Value
Number
Average Value
Number
Average Value
Number
Average Value
Number
Average Value
Number
Average Value
LOANS ORIGINATED
94
$75,281
109
$60,469
165
$55,665
80
$32,850
12
$1,714,962
103
$63,581
0
$0
APPLICATIONS APPROVED, NOT ACCEPTED
3
$40,597
7
$53,654
16
$61,516
7
$28,706
0
$0
8
$53,488
1
$67,380
APPLICATIONS DENIED
13
$58,993
30
$53,873
274
$68,329
82
$30,168
5
$410,790
43
$57,034
7
$60,379
APPLICATIONS WITHDRAWN
7
$47,591
11
$53,513
57
$67,552
13
$32,152
0
$0
17
$49,058
0
$0
FILES CLOSED FOR INCOMPLETENESS
2
$122,890
7
$57,723
3
$85,367
2
$19,980
0
$0
2
$24,975
0
$0
Aggregated Statistics For Year 2007 (Based on 4 full and 8 partial tracts)
A) FHA, FSA/RHS & VA Home Purchase Loans
B) Conventional Home Purchase Loans
C) Refinancings
D) Home Improvement Loans
E) Loans on Dwellings For 5+ Families
F) Non-occupant Loans on < 5 Family Dwellings (A B C & D)
G) Loans On Manufactured Home Dwelling (A B C & D)
Number
Average Value
Number
Average Value
Number
Average Value
Number
Average Value
Number
Average Value
Number
Average Value
Number
Average Value
LOANS ORIGINATED
68
$74,292
193
$64,194
193
$53,343
111
$24,735
10
$188,089
79
$63,796
4
$40,962
APPLICATIONS APPROVED, NOT ACCEPTED
2
$66,940
23
$61,617
43
$51,054
19
$20,759
0
$0
7
$92,803
6
$30,947
APPLICATIONS DENIED
3
$77,837
37
$65,380
380
$64,078
110
$27,786
1
$158,540
40
$68,094
8
$50,334
APPLICATIONS WITHDRAWN
6
$82,463
22
$69,233
100
$64,556
11
$38,541
0
$0
11
$44,115
2
$19,455
FILES CLOSED FOR INCOMPLETENESS
0
$0
17
$76,012
20
$61,522
0
$0
0
$0
10
$51,146
0
$0
Aggregated Statistics For Year 2006 (Based on 4 full and 8 partial tracts)
A) FHA, FSA/RHS & VA Home Purchase Loans
B) Conventional Home Purchase Loans
C) Refinancings
D) Home Improvement Loans
E) Loans on Dwellings For 5+ Families
F) Non-occupant Loans on < 5 Family Dwellings (A B C & D)
G) Loans On Manufactured Home Dwelling (A B C & D)
Number
Average Value
Number
Average Value
Number
Average Value
Number
Average Value
Number
Average Value
Number
Average Value
Number
Average Value
LOANS ORIGINATED
62
$71,374
249
$60,412
269
$56,753
161
$25,679
5
$131,866
154
$56,292
2
$14,785
APPLICATIONS APPROVED, NOT ACCEPTED
0
$0
32
$59,999
73
$59,442
19
$24,327
0
$0
27
$60,044
2
$27,235
APPLICATIONS DENIED
6
$70,533
66
$58,125
411
$72,882
133
$25,729
1
$528,840
85
$59,162
5
$55,402
APPLICATIONS WITHDRAWN
6
$73,265
23
$76,834
160
$70,762
9
$49,338
2
$278,235
17
$63,506
0
$0
FILES CLOSED FOR INCOMPLETENESS
0
$0
7
$58,444
51
$86,018
3
$38,240
0
$0
4
$43,960
0
$0
Aggregated Statistics For Year 2005 (Based on 4 full and 8 partial tracts)
A) FHA, FSA/RHS & VA Home Purchase Loans
B) Conventional Home Purchase Loans
C) Refinancings
D) Home Improvement Loans
E) Loans on Dwellings For 5+ Families
F) Non-occupant Loans on < 5 Family Dwellings (A B C & D)
G) Loans On Manufactured Home Dwelling (A B C & D)
Number
Average Value
Number
Average Value
Number
Average Value
Number
Average Value
Number
Average Value
Number
Average Value
Number
Average Value
LOANS ORIGINATED
65
$65,113
292
$59,998
324
$62,070
161
$27,324
8
$181,754
199
$58,395
2
$57,950
APPLICATIONS APPROVED, NOT ACCEPTED
2
$111,900
45
$51,870
80
$62,657
15
$19,739
0
$0
18
$63,062
3
$23,560
APPLICATIONS DENIED
0
$0
84
$52,915
514
$64,508
205
$19,019
2
$46,810
113
$26,029
15
$43,933
APPLICATIONS WITHDRAWN
3
$79,343
28
$102,064
201
$79,084
50
$134,216
2
$25,685
30
$88,141
4
$83,110
FILES CLOSED FOR INCOMPLETENESS
0
$0
9
$76,313
52
$78,163
9
$41,283
0
$0
5
$68,834
2
$72,935
Aggregated Statistics For Year 2004 (Based on 4 full and 8 partial tracts)
A) FHA, FSA/RHS & VA Home Purchase Loans
B) Conventional Home Purchase Loans
C) Refinancings
D) Home Improvement Loans
E) Loans on Dwellings For 5+ Families
F) Non-occupant Loans on < 5 Family Dwellings (A B C & D)
G) Loans On Manufactured Home Dwelling (A B C & D)
Number
Average Value
Number
Average Value
Number
Average Value
Number
Average Value
Number
Average Value
Number
Average Value
Number
Average Value
LOANS ORIGINATED
56
$63,379
262
$58,169
472
$58,600
151
$30,147
3
$138,277
194
$51,861
0
$0
APPLICATIONS APPROVED, NOT ACCEPTED
3
$92,830
30
$65,225
92
$60,559
27
$30,998
1
$564,550
22
$53,661
3
$31,773
APPLICATIONS DENIED
2
$20,235
63
$50,805
496
$62,955
219
$19,656
1
$34,340
125
$36,082
9
$39,706
APPLICATIONS WITHDRAWN
5
$79,556
20
$56,978
323
$66,906
8
$51,009
1
$173,070
17
$65,159
4
$74,450
FILES CLOSED FOR INCOMPLETENESS
0
$0
10
$58,972
133
$76,205
7
$12,210
0
$0
10
$80,847
0
$0
Aggregated Statistics For Year 2003 (Based on 4 full and 8 partial tracts)
A) FHA, FSA/RHS & VA Home Purchase Loans
B) Conventional Home Purchase Loans
C) Refinancings
D) Home Improvement Loans
E) Loans on Dwellings For 5+ Families
F) Non-occupant Loans on < 5 Family Dwellings (A B C & D)
Number
Average Value
Number
Average Value
Number
Average Value
Number
Average Value
Number
Average Value
Number
Average Value
LOANS ORIGINATED
89
$60,497
228
$62,359
666
$54,565
127
$26,711
1
$196,420
223
$60,722
APPLICATIONS APPROVED, NOT ACCEPTED
11
$57,181
27
$51,524
160
$56,300
15
$29,811
0
$0
18
$47,300
APPLICATIONS DENIED
4
$53,698
67
$49,790
496
$55,124
145
$14,781
0
$0
112
$33,827
APPLICATIONS WITHDRAWN
2
$56,810
34
$72,780
232
$63,591
5
$21,946
0
$0
16
$49,211
FILES CLOSED FOR INCOMPLETENESS
0
$0
12
$92,528
37
$61,534
5
$19,956
0
$0
15
$60,175
Aggregated Statistics For Year 2002 (Based on 4 full and 8 partial tracts)
A) FHA, FSA/RHS & VA Home Purchase Loans
B) Conventional Home Purchase Loans
C) Refinancings
D) Home Improvement Loans
E) Loans on Dwellings For 5+ Families
F) Non-occupant Loans on < 5 Family Dwellings (A B C & D)
Number
Average Value
Number
Average Value
Number
Average Value
Number
Average Value
Number
Average Value
Number
Average Value
LOANS ORIGINATED
108
$60,205
223
$49,169
547
$54,379
104
$20,057
1
$101,650
186
$45,915
APPLICATIONS APPROVED, NOT ACCEPTED
1
$64,560
25
$59,246
109
$48,779
27
$24,617
1
$210,160
20
$62,355
APPLICATIONS DENIED
5
$85,194
51
$35,741
486
$53,590
101
$17,674
2
$224,795
59
$45,097
APPLICATIONS WITHDRAWN
2
$66,940
27
$54,607
208
$67,525
29
$20,042
2
$115,575
20
$48,082
FILES CLOSED FOR INCOMPLETENESS
2
$35,795
8
$35,898
37
$49,044
0
$0
0
$0
3
$50,697
Aggregated Statistics For Year 2001 (Based on 4 full and 8 partial tracts)
A) FHA, FSA/RHS & VA Home Purchase Loans
B) Conventional Home Purchase Loans
C) Refinancings
D) Home Improvement Loans
E) Loans on Dwellings For 5+ Families
F) Non-occupant Loans on < 5 Family Dwellings (A B C & D)
Number
Average Value
Number
Average Value
Number
Average Value
Number
Average Value
Number
Average Value
Number
Average Value
LOANS ORIGINATED
105
$57,990
183
$53,389
461
$48,881
144
$17,098
2
$190,660
143
$50,498
APPLICATIONS APPROVED, NOT ACCEPTED
6
$46,573
17
$37,916
119
$45,810
31
$22,252
0
$0
17
$37,323
APPLICATIONS DENIED
2
$45,915
95
$39,670
452
$49,905
160
$16,266
2
$141,255
53
$62,115
APPLICATIONS WITHDRAWN
7
$60,366
33
$50,311
241
$52,921
36
$16,812
0
$0
18
$41,553
FILES CLOSED FOR INCOMPLETENESS
0
$0
1
$14,530
44
$56,472
4
$9,832
0
$0
9
$35,194
Aggregated Statistics For Year 2000 (Based on 4 full and 8 partial tracts)
A) FHA, FSA/RHS & VA Home Purchase Loans
B) Conventional Home Purchase Loans
C) Refinancings
D) Home Improvement Loans
F) Non-occupant Loans on < 5 Family Dwellings (A B C & D)
Number
Average Value
Number
Average Value
Number
Average Value
Number
Average Value
Number
Average Value
LOANS ORIGINATED
82
$54,191
234
$52,315
274
$40,884
146
$17,062
96
$45,919
APPLICATIONS APPROVED, NOT ACCEPTED
0
$0
43
$32,347
100
$42,053
51
$17,325
16
$31,314
APPLICATIONS DENIED
12
$41,743
114
$41,302
321
$41,009
124
$13,451
53
$52,763
APPLICATIONS WITHDRAWN
0
$0
36
$44,099
134
$44,934
21
$32,603
10
$44,261
FILES CLOSED FOR INCOMPLETENESS
2
$42,800
3
$54,027
21
$53,191
1
$31,710
1
$86,540
Aggregated Statistics For Year 1999 (Based on 2 full and 4 partial tracts)
A) FHA, FSA/RHS & VA Home Purchase Loans
B) Conventional Home Purchase Loans
C) Refinancings
D) Home Improvement Loans
E) Loans on Dwellings For 5+ Families
F) Non-occupant Loans on < 5 Family Dwellings (A B C & D)
2014 - 2018 National Fire Incident Reporting System (NFIRS) incidents
Based on the data from the years 2014 - 2018 the average number of fires per year is 71. The highest number of fire incidents - 89 took place in 2014, and the least - 52 in 2015. The data has a declining trend.
When looking into fire subcategories, the most incidents belonged to: Structure Fires (46.8%), and Outside Fires (37.0%).
Fire incident types reported to NFIRS in Zip Code 16502

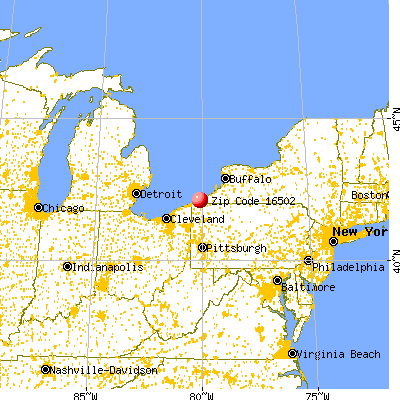


 Nearest zip codes: 16501, 16508, 16507, 16505, 16503, 16546.
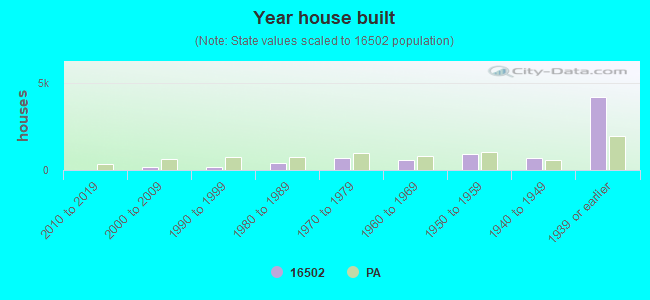


 Based on the data from the years 2014 - 2018 the average number of fires per year is 71. The highest number of fire incidents - 89 took place in 2014, and the least - 52 in 2015. The data has a declining trend.
 When looking into fire subcategories, the most incidents belonged to: Structure Fires (46.8%), and Outside Fires (37.0%).