Estimated zip code population in 2022: 16,114 Zip code population in 2010: 17,168 Zip code population in 2000: 18,176
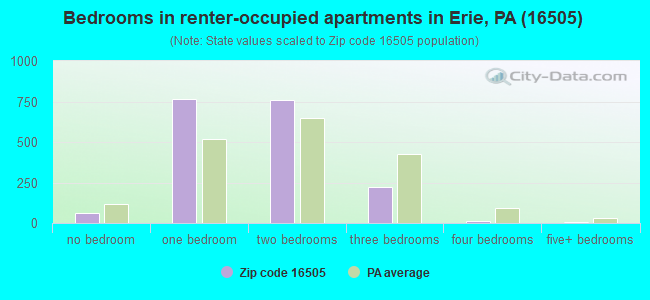
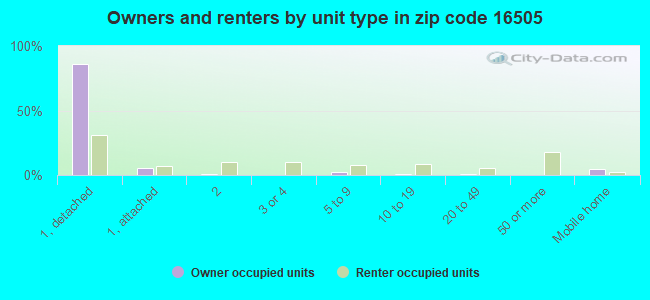
Houses and condos: 8,636 Renter-occupied apartments: 1,812
% of renters here:
23%
State:
31%
March 2022 cost of living index in zip code 16505: 91.1 (less than average, U.S. average is 100)
Land area: 11.9 sq. mi. Water area: 6.3 sq. mi.
Population density: 1,358 people per square mile
(low).
OSM Map
General Map
Google Map
MSN Map
OSM Map
General Map
Google Map
MSN Map
OSM Map
General Map
Google Map
MSN Map
OSM Map
General Map
Google Map
MSN Map
Please wait while loading the map...
Real estate property taxes paid for housing units in 2022:
This zip code:
1.6% ($3,240)
Pennsylvania:
1.3% ($3,094)
Median real estate property taxes paid for housing units with mortgages in 2022: $3,383 (1.7%) Median real estate property taxes paid for housing units with no mortgage in 2022: $3,050 (1.5%)
Estimated median house/condo value in 2022: $203,498
16505:
$203,498
Pennsylvania:
$245,500
According to our research of Pennsylvania and other state lists, there were 11 registered sex offenders living in 16505 zip code as of April 27, 2024. The ratio of all residents to sex offenders in zip code 16505 is 1,514 to 1. The ratio of registered sex offenders to all residents in this zip code is much lower than the state average.
Median resident age:
This zip code:
49.2 years
Pennsylvania median age:
40.9 years
Average household size:
This zip code:
2.0 people
Pennsylvania:
2.4 people
Averages for the 2020 tax year for zip code 16505, filed in 2021:
Average Adjusted Gross Income (AGI) in 2020: $84,031 (Individual Income Tax Returns)
Here:
$84,031
State:
$75,707
Salary/wage: $61,958 (reported on 76.4% of returns)
Here:
$61,958
State:
$62,806
(% of AGI for various income ranges: 1040.3% for AGIs below $25k, 3143.0% for AGIs $25k-50k, 5665.5% for AGIs $50k-75k, 8281.9% for AGIs $75k-100k, 15860.7% for AGIs $100k-200k, 103678.5% for AGIs over 200k)
Taxable interest for individuals: $1,878 (reported on 39.6% of returns)
This zip code:
$1,878
Pennsylvania:
$1,633
(% of AGI for various income ranges: 21.0% for AGIs below $25k, 24.5% for AGIs $25k-50k, 42.9% for AGIs $50k-75k, 83.6% for AGIs $75k-100k, 172.8% for AGIs $100k-200k, 2841.5% for AGIs over 200k)
Ordinary dividends: $11,658 (reported on 28.3% of returns)
Here:
$11,658
State:
$7,382
(% of AGI for various income ranges: 51.8% for AGIs below $25k, 78.7% for AGIs $25k-50k, 174.8% for AGIs $50k-75k, 298.6% for AGIs $75k-100k, 618.5% for AGIs $100k-200k, 14855.4% for AGIs over 200k)
Net capital gain/loss in AGI: +$17,115 (reported on 24.2% of returns)
Here:
+$17,115
State:
+$23,522
(% of AGI for various income ranges: 20.4% for AGIs below $25k, 61.5% for AGIs $25k-50k, 190.2% for AGIs $50k-75k, 271.2% for AGIs $75k-100k, 713.9% for AGIs $100k-200k, 20703.8% for AGIs over 200k)
Profit/loss from business: +$24,462 (reported on 13.5% of returns)
Here:
+$24,462
State:
+$16,274
(% of AGI for various income ranges: 52.3% for AGIs below $25k, 125.8% for AGIs $25k-50k, 253.5% for AGIs $50k-75k, 538.6% for AGIs $75k-100k, 1049.4% for AGIs $100k-200k, 10200.8% for AGIs over 200k)
Taxable individual retirement arrangement distribution: $19,325 (reported on 14.7% of returns)
16505:
$19,325
Pennsylvania:
$18,583
(% of AGI for various income ranges: 103.9% for AGIs below $25k, 172.9% for AGIs $25k-50k, 414.2% for AGIs $50k-75k, 538.3% for AGIs $75k-100k, 1011.4% for AGIs $100k-200k, 4843.1% for AGIs over 200k)
Self-employed (Keogh) retirement plans: $24,620 (reported on 1.1% of returns)
16505:
$24,620
Pennsylvania:
$25,407
(% of AGI for various income ranges: 94.4% for AGIs $100k-200k, 1370.8% for AGIs over 200k)
Total itemized deductions: $38,085 (reported on 6.2% of returns)
Here:
$38,085
State:
$34,850
(% of AGI for various income ranges: 76.3% for AGIs below $25k, 118.3% for AGIs $25k-50k, 248.0% for AGIs $50k-75k, 289.7% for AGIs $75k-100k, 470.3% for AGIs $100k-200k, 7869.2% for AGIs over 200k)
Charity contributions: $16,486 (reported on 4.9% of returns)
Here:
$16,486
State:
$12,392
(% of AGI for various income ranges: 5.5% for AGIs below $25k, 6.6% for AGIs $25k-50k, 48.2% for AGIs $50k-75k, 28.3% for AGIs $75k-100k, 104.9% for AGIs $100k-200k, 4366.2% for AGIs over 200k)
Taxes paid: $7,860 (reported on 6.2% of returns)
16505:
$7,860
State:
$8,200
(% of AGI for various income ranges: 7.0% for AGIs below $25k, 18.3% for AGIs $25k-50k, 47.2% for AGIs $50k-75k, 73.6% for AGIs $75k-100k, 156.5% for AGIs $100k-200k, 1459.2% for AGIs over 200k)
Earned income credit: $1,797 (reported on 10.3% of returns)
Here:
$1,797
State:
$2,100
(% of AGI for various income ranges: 53.2% for AGIs below $25k, 42.0% for AGIs $25k-50k)
Percentage of individuals using paid preparers for their 2020 taxes: 93.0%
Here:
93%
State:
92%
(% for various income ranges: 91.0% for AGIs below $25k, 95.2% for AGIs $25k-50k, 93.3% for AGIs $50k-75k, 93.2% for AGIs $75k-100k, 92.9% for AGIs $100k-200k, 94.5% for AGIs over 200k)
Averages for the 2012 tax year for zip code 16505, filed in 2013:
Average Adjusted Gross Income (AGI) in 2012: $72,459 (Individual Income Tax Returns)
Here:
$72,459
State:
$61,346
Salary/wage: $53,976 (reported on 79.4% of returns)
Here:
$53,976
State:
$51,902
(% of AGI for various income ranges: 67.7% for AGIs below $25k, 74.0% for AGIs $25k-50k, 69.9% for AGIs $50k-75k, 72.2% for AGIs $75k-100k, 68.2% for AGIs $100k-200k, 42.8% for AGIs over 200k)
Taxable interest for individuals: $1,883 (reported on 43.1% of returns)
This zip code:
$1,883
Pennsylvania:
$1,588
(% of AGI for various income ranges: 1.5% for AGIs below $25k, 0.8% for AGIs $25k-50k, 1.0% for AGIs $50k-75k, 0.7% for AGIs $75k-100k, 0.8% for AGIs $100k-200k, 1.5% for AGIs over 200k)
Ordinary dividends: $13,463 (reported on 30.6% of returns)
Here:
$13,463
State:
$5,827
(% of AGI for various income ranges: 3.9% for AGIs below $25k, 2.0% for AGIs $25k-50k, 2.3% for AGIs $50k-75k, 2.2% for AGIs $75k-100k, 2.9% for AGIs $100k-200k, 10.3% for AGIs over 200k)
Net capital gain/loss in AGI: +$12,482 (reported on 22.7% of returns)
Here:
+$12,482
State:
+$14,495
(% of AGI for various income ranges: 0.3% for AGIs $25k-50k, 0.5% for AGIs $50k-75k, 1.1% for AGIs $75k-100k, 2.4% for AGIs $100k-200k, 8.0% for AGIs over 200k)
Profit/loss from business: +$22,989 (reported on 13.2% of returns)
Here:
+$22,989
State:
+$16,268
(% of AGI for various income ranges: 4.7% for AGIs below $25k, 3.1% for AGIs $25k-50k, 2.8% for AGIs $50k-75k, 4.3% for AGIs $75k-100k, 4.7% for AGIs $100k-200k, 4.6% for AGIs over 200k)
Taxable individual retirement arrangement distribution: $15,301 (reported on 15.2% of returns)
16505:
$15,301
Pennsylvania:
$14,550
(% of AGI for various income ranges: 5.5% for AGIs below $25k, 3.8% for AGIs $25k-50k, 4.2% for AGIs $50k-75k, 3.6% for AGIs $75k-100k, 4.4% for AGIs $100k-200k, 1.7% for AGIs over 200k)
Self-employment retirement plans: $22,090 (reported on 1.1% of returns)
16505:
$22,090
Pennsylvania:
$20,922
(% of AGI for various income ranges: 0.2% for AGIs $25k-50k, 0.5% for AGIs $100k-200k, 0.5% for AGIs over 200k)
Total itemized deductions: $24,928 (15% of AGI, reported on 30.6% of returns)
Here:
$24,928
State:
$23,538
Here:
15.3% of AGI
State:
18.4% of AGI
(% of AGI for various income ranges: 8.9% for AGIs below $25k, 9.1% for AGIs $25k-50k, 10.4% for AGIs $50k-75k, 10.1% for AGIs $75k-100k, 12.6% for AGIs $100k-200k, 10.3% for AGIs over 200k)
Charity contributions: $4,802 (reported on 24.7% of returns)
Here:
$4,802
State:
$4,025
(% of AGI for various income ranges: 0.5% for AGIs below $25k, 0.9% for AGIs $25k-50k, 1.2% for AGIs $50k-75k, 1.1% for AGIs $75k-100k, 1.8% for AGIs $100k-200k, 2.2% for AGIs over 200k)
Taxes paid: $11,587 (reported on 30.6% of returns)
16505:
$11,587
State:
$9,982
(% of AGI for various income ranges: 2.7% for AGIs below $25k, 2.9% for AGIs $25k-50k, 3.7% for AGIs $50k-75k, 4.5% for AGIs $75k-100k, 6.2% for AGIs $100k-200k, 5.6% for AGIs over 200k)
Earned income credit: $1,881 (reported on 12.6% of returns)
Here:
$1,881
State:
$2,106
(% of AGI for various income ranges: 4.2% for AGIs below $25k, 0.7% for AGIs $25k-50k)
Percentage of individuals using paid preparers for their 2012 taxes: 53.7%
Here:
54%
State:
53%
(% for various income ranges: 45.6% for AGIs below $25k, 51.0% for AGIs $25k-50k, 57.6% for AGIs $50k-75k, 58.5% for AGIs $75k-100k, 65.7% for AGIs $100k-200k, 86.0% for AGIs over 200k)
Averages for the 2004 tax year for zip code 16505, filed in 2005:
Average Adjusted Gross Income (AGI) in 2004: $52,792 (Individual Income Tax Returns)
Here:
$52,792
State:
$48,049
Salary/wage: $44,749 (reported on 79.3% of returns)
Here:
$44,749
State:
$42,646
(% of AGI for various income ranges: 108.5% for AGIs below $10k, 67.8% for AGIs $10k-25k, 74.5% for AGIs $25k-50k, 75.9% for AGIs $50k-75k, 76.6% for AGIs $75k-100k, 58.5% for AGIs over 100k)
Taxable interest for individuals: $2,155 (reported on 58.4% of returns)
This zip code:
$2,155
Pennsylvania:
$1,657
(% of AGI for various income ranges: 8.7% for AGIs below $10k, 3.8% for AGIs $10k-25k, 2.0% for AGIs $25k-50k, 1.8% for AGIs $50k-75k, 1.3% for AGIs $75k-100k, 2.5% for AGIs over 100k)
Taxable dividends: $5,371 (reported on 36.6% of returns)
Here:
$5,371
State:
$3,566
(% of AGI for various income ranges: 10.6% for AGIs below $10k, 3.5% for AGIs $10k-25k, 2.4% for AGIs $25k-50k, 2.4% for AGIs $50k-75k, 2.4% for AGIs $75k-100k, 4.7% for AGIs over 100k)
Net capital gain/loss: +$8,928 (reported on 27.9% of returns)
Here:
+$8,928
State:
+$9,716
(% of AGI for various income ranges: -4.5% for AGIs below $10k, 0.7% for AGIs $10k-25k, 0.5% for AGIs $25k-50k, 1.0% for AGIs $50k-75k, 1.5% for AGIs $75k-100k, 9.0% for AGIs over 100k)
Profit/loss from business: +$16,548 (reported on 13.6% of returns)
Here:
+$16,548
State:
+$14,267
(% of AGI for various income ranges: 4.1% for AGIs below $10k, 4.2% for AGIs $10k-25k, 3.2% for AGIs $25k-50k, 3.7% for AGIs $50k-75k, 5.3% for AGIs $75k-100k, 4.5% for AGIs over 100k)
IRA payment deduction: $2,844 (reported on 2.9% of returns)
16505:
$2,844
Pennsylvania:
$2,903
(% of AGI for various income ranges: 0.6% for AGIs below $10k, 0.2% for AGIs $10k-25k, 0.3% for AGIs $25k-50k, 0.2% for AGIs $50k-75k, 0.2% for AGIs $75k-100k, 0.1% for AGIs over 100k)
Self-employed pension: $15,933 (reported on 1.6% of returns)
Here:
$15,933
Pennsylvania:
$14,674
(% of AGI for various income ranges: 0.1% for AGIs $25k-50k, 0.1% for AGIs $50k-75k, 0.2% for AGIs $75k-100k, 0.9% for AGIs over 100k)
Total itemized deductions: $18,504 (17% of AGI, reported on 33.1% of returns)
Here:
$18,504
State:
$18,804
Here:
16.8% of AGI
State:
19.5% of AGI
(% of AGI for various income ranges: 12.4% for AGIs below $10k, 10.0% for AGIs $10k-25k, 10.6% for AGIs $25k-50k, 12.4% for AGIs $50k-75k, 13.6% for AGIs $75k-100k, 11.4% for AGIs over 100k)
Charity contributions deductions: $3,502 (3% of AGI, reported on 29.5% of returns)
Here:
$3,502
State:
$3,337
Here:
3.0% of AGI
State:
3.3% of AGI
(% of AGI for various income ranges: 0.6% for AGIs below $10k, 1.0% for AGIs $10k-25k, 1.1% for AGIs $25k-50k, 1.7% for AGIs $50k-75k, 1.8% for AGIs $75k-100k, 2.5% for AGIs over 100k)
Total tax: $10,316 (reported on 74.8% of returns)
16505:
$10,316
State:
$8,008
(% of AGI for various income ranges: 2.7% for AGIs below $10k, 4.2% for AGIs $10k-25k, 7.4% for AGIs $25k-50k, 9.2% for AGIs $50k-75k, 11.0% for AGIs $75k-100k, 21.5% for AGIs over 100k)
Earned income credit: $1,494 (reported on 11.1% of returns)
Here:
$1,494
State:
$1,643
Percentage of individuals using paid preparers for their 2004 taxes: 55.8%
Here:
56%
State:
56%
(% for various income ranges: 47.1% for AGIs below $10k, 54.1% for AGIs $10k-25k, 56.1% for AGIs $25k-50k, 55.5% for AGIs $50k-75k, 57.8% for AGIs $75k-100k, 76.0% for AGIs over 100k)
Likely homosexual households (counted as self-reported same-sex unmarried-partner households)
Lesbian couples: 0.0% of all households
Gay men: 0.5% of all households
Household received Food Stamps/SNAP in the past 12 months: 784 Household did not receive Food Stamps/SNAP in the past 12 months: 6,953
Women who had a birth in the past 12 months: 122 (105 now married, 20 unmarried) Women who did not have a birth in the past 12 months: 2,914 (1,307 now married, 1,601 unmarried)
Housing units in zip code 16505 with a mortgage: 2,909 (327 second mortgage, 16 home equity loan, 287 both second mortgage and home equity loan) Houses without a mortgage: 156
Median monthly owner costs for units with a mortgage: $1,432 Median monthly owner costs for units without a mortgage: $609
Residents with income below the poverty level in 2022:
This zip code:
9.8%
Whole state:
11.8%
Residents with income below 50% of the poverty level in 2022:
This zip code:
6.7%
Whole state:
6.1%
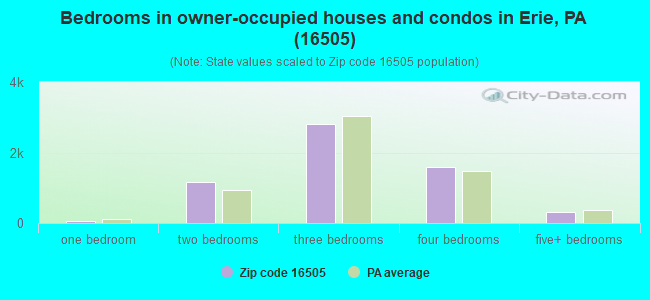
Median number of rooms in houses and condos:
Here:
6.7
State:
6.8
Median number of rooms in apartments:
Here:
4.0
State:
4.3
Notable locations in this zip code not listed on our city pages
Notable locations in zip code 16505: Colony Plaza (A), Twelfth and Pittsburgh Plaza (B), West Erie Plaza (C), Plaza 12 (D), Peninsula Village (E), Presque Isle State Park Marina (F), Erie Harbor Pier Light (G), Erie Yacht Club (H), Saint Josephs Home for Childern (I), Presque Isle Lighthouse (J), Erie Fire Department Engine Company 11 (K), Lake Shore Fire Department (L), West Lake Fire Department Station 2 - 49 (M), West Lake Fire Department Station 1 - 48 (N). Display/hide their locations on the map
Parks in zip code 16505 include: Grove Drive Park (1), Victory Park (2), Perry Monument (3), Gull Point Natural Area (4), Ravine Park (5), Presque Isle State Park (6), Waldameer Park (7), Frontier Park (8). Display/hide their locations on the map
In group quarters: 205 (-1 institutionalized population)
Size of family households: 2,356 2-persons, 791 3-persons, 727 4-persons, 264 5-persons, 31 6-persons, 57 7-or-more-persons
Size of nonfamily households: 2,970 1-person, 575 2-persons, 18 3-persons
1,877 married couples with children.
667 single-parent households (201 men, 466 women).
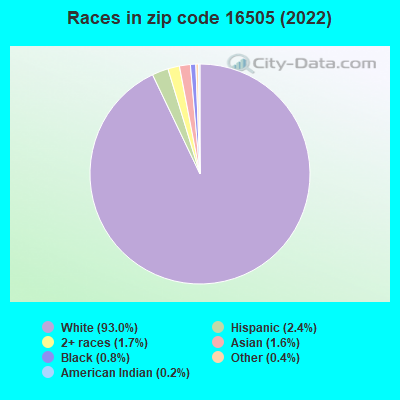
94.0% of residents of 16505 zip code speak English at home.
0.8% of residents speak Spanish at home (86% very well, 14% well).
2.2% of residents speak other Indo-European language at home (92% very well, 1% well, 7% not at all).
1.1% of residents speak Asian or Pacific Island language at home (82% very well, 9% well, 9% not well).
1.8% of residents speak other language at home (100% very well).
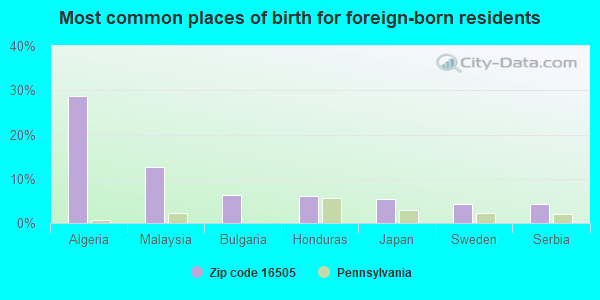
Foreign born population: 617 (3.8%) (59.9% of them are naturalized citizens)
Facilities with environmental interests located in this zip code:
ANSON MOLD & MFG (1945 GROVE DR in ERIE, PA)
AIR MINOR (AIRS/AFS) STATE MASTER (Pennsylvania database) - AFS-01-0568443-1, AIR PROGRAM, RCRIS-PAD005031133, HAZARDOUS WASTE PROGRAM Conditionally Exempt Small Quantity Generators, less than 100 kg/month of hazardous waste (Resource Conservation and Recovery Act (tracking hazardous waste)) TRI REPORTER (Tracking of toxic chemicals releasing facilities) Business SIC classification: SPECIAL DIES AND TOOLS, DIE SETS, JIGS AND FIXTURES, AND INDUSTRIAL MOLDS Business NAICS classification: OTHER COMMERCIAL AND SERVICE INDUSTRY MACHINERY MANUFACTURING.; SPECIAL DIE AND TOOL, DIE SET, JIG, AND FIXTURE MANUFACTURING. Organizations: OPERNAME (CONTACT/OPERATOR)
Alternative names: ANSON MANUFACTURING INCORPORATED
AUDREY L SANFORD SRSTP (KIRSCH ROAD in ERIE, PA)
STATE MASTER (Pennsylvania database) - PCS-PAG048932, National Pollutant Discharge Elimination System Permit National Pollutant Discharge Elimination System NON-MAJOR (Tracking pollutant discharge elimination systems) - permit Business SIC classification: OPERATORS OF DWELLINGS OTHER THAN APARTMENT BUILDINGS Alternative names: AUDREY SANFORD, SANFORD, AUDREY
ADVANCED MOLD TECH (2004 WEST 16TH STREET in ERIE, PA)
AIR MAJOR (AIRS/AFS) STATE MASTER (Pennsylvania database) - AFS-25-1852122-1, AIR PROGRAM Organizations: ADVANCED MOLD TECHNOLOGIES, INC. (CONTACT/OWNER)
Alternative names: ADVANCED MOLD TECH/ERIE
BEALS MCMAHON PARTNERSHIP (1673 WEST EIGHTH ST in ERIE, PA)
STATE MASTER (Pennsylvania database) - RCRIS-PA0000030775, HAZARDOUS WASTE PROGRAM Conditionally Exempt Small Quantity Generators, less than 100 kg/month of hazardous waste (Resource Conservation and Recovery Act (tracking hazardous waste)) - notification Organizations: MCMAHON RICHARD A (CONTACT/OWNER)
ASSEMBLEY MACHINES INC (2400 YODER DR in ERIE, PA)
Conditionally Exempt Small Quantity Generators, less than 100 kg/month of hazardous waste (Resource Conservation and Recovery Act (tracking hazardous waste)) - notification Business NAICS classification: COMMERCIAL LITHOGRAPHIC PRINTING.; TRADEBINDING AND RELATED WORK.; PREPRESS SERVICES. Organizations: OPERNAME (CONTACT/OPERATOR)
, JOHNSON, WAYNE (CONTACT/OWNER)
Alternative names: ARROW SWIFT PRINTING MANUFACTURING
AMERIDRIVES INTL EAST (1801 PITTSBURGH AVENUE E in ERIE, PA)
Conditionally Exempt Small Quantity Generators, less than 100 kg/month of hazardous waste (Resource Conservation and Recovery Act (tracking hazardous waste)) - notification Organizations: AMERICAN ENTERPRISES MPT LP (CONTACT/OWNER)
AUTOMATED INDUSTRIAL SYSTEMS (4238 WEST 12 ST in ERIE, PA)
Conditionally Exempt Small Quantity Generators, less than 100 kg/month of hazardous waste (Resource Conservation and Recovery Act (tracking hazardous waste)) Business NAICS classification: OTHER COMMERCIAL AND SERVICE INDUSTRY MACHINERY MANUFACTURING. Organizations: OPERNAME (CONTACT/OPERATOR)
BAY HARBOUR ELECTRIC (1606 HARPER DR in ERIE, PA)
Conditionally Exempt Small Quantity Generators, less than 100 kg/month of hazardous waste (Resource Conservation and Recovery Act (tracking hazardous waste)) - notification Organizations: DOLAK CAROLYN (CONTACT/OWNER)
ADVANCED CUSTOM CHROME (2004 WEST 16TH ST in ERIE, PA)
Conditionally Exempt Small Quantity Generators, less than 100 kg/month of hazardous waste (Resource Conservation and Recovery Act (tracking hazardous waste))
Housing units lacking complete plumbing facilities: 0.7% Housing units lacking complete kitchen facilities: 1.4%
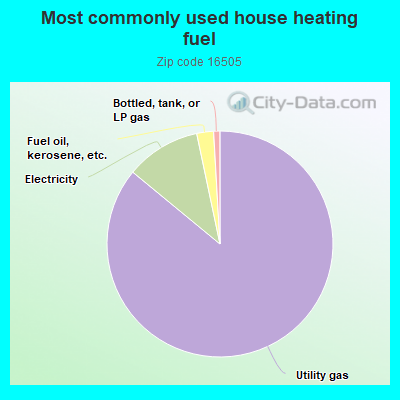
85.8%Utility gas
10.7%Electricity
2.4%Fuel oil, kerosene, etc.
0.9%Bottled, tank, or LP gas
Population in 1990: 17,753. Population change in the 1990s: +423 (+2.4%).
Place of birth for U.S.-born residents:
This state: 12,114
Northeast: 1,121
Midwest: 772
South: 908
West: 432
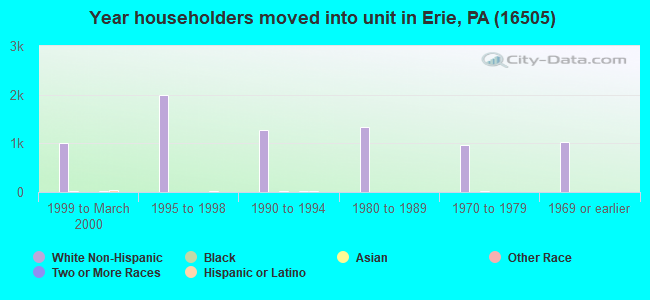
63% of the 16505 zip code residents lived in the same house 5 years ago. Out of people who lived in different houses, 77% lived in this county. Out of people who lived in different counties, 50% lived in Pennsylvania.
89% of the 16505 zip code residents lived in the same house 1 year ago. Out of people who lived in different houses, 72% moved from this county. Out of people who lived in different houses, 10% moved from different county within same state. Out of people who lived in different houses, 10% moved from different state. Out of people who lived in different houses, 7% moved from abroad.
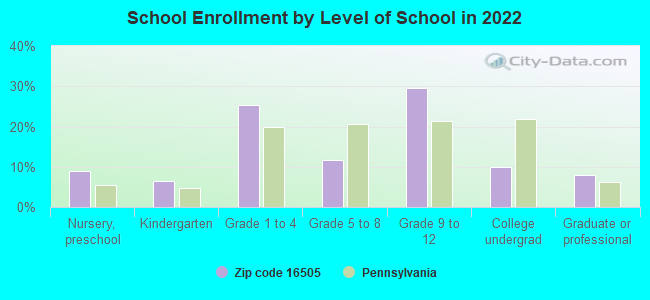
Private vs. public school enrollment:
Students in private schools in grades 1 to 8 (elementary and middle school): 256
Here:
27.2%
Pennsylvania:
15.7%
Students in private schools in grades 9 to 12 (high school): 74
Here:
10.0%
Pennsylvania:
13.4%
Students in private undergraduate colleges: 96
Here:
37.8%
Pennsylvania:
39.8%
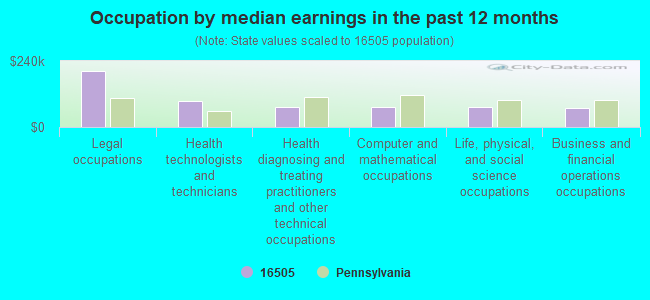
Occupation by median earnings in the past 12 months ($)
202,227Legal occupations
94,235Health technologists and technicians
74,286Health diagnosing and treating practitioners and other technical occupations
73,254Computer and mathematical occupations
71,517Life, physical, and social science occupations
69,218Business and financial operations occupations
Companies with federal contracts located in this zip code (ERIE, PA):
MID AMERICAN NATURAL RESOURCES (2005 W 8TH ST STE 201; small business) : $4,031,502 in 3 contractsfrom 2002 to 2005
$3,716,238 with Defense Logistics Agency for Gases: Compressed and Liquefied. Signed on 2005-06-27. Completion date: 2008-09-30.
$315,264, same as above.Signed on 2002-08-15. Completion date: 2003-09-30.
$0, same as above.Signed on 2002-08-15. Completion date: 2003-09-30.
HOSPITALITY MARKETING SERVICES (1005 PENINSULA DRIVE #2; small business) : $26,029 in 5 contractsfrom 2004 to 2005
Contracts for Miscellaneous Furniture and Fixtures, Office Furniture by Army, Navy Signed by year:2000: $0; 2001: $0; 2002: $0; 2003: $0; 2004: $12,309; 2005: $13,720; 2006: $0.
Biggest contracts:
$7,486 with Army for Miscellaneous Furniture and Fixtures. Signed on 2004-08-31. Completion date: 2004-09-15.
$5,409, same as above.Signed on 2005-08-26. Completion date: 2005-09-08.
$4,823 with Army for Office Furniture. Signed on 2004-09-13. Completion date: 2004-09-24.
$4,691 with Navy for Office Furniture. Signed on 2005-09-29. Completion date: 2005-11-17.
EXERCISE STORE INC (2311 W 12TH ST; small business) : $13,047 in 2 contractsin 2006
$10,847 with Army for Recreational and Gymnastic Equipment. Signed on 2006-02-28. Completion date: 2006-03-31.
$2,200, same as above.Signed on 2006-03-01. Completion date: 2006-03-31.
ERIE AVIATION, INC (1607 ASBURY RD; small business)
$3,840 with Defense Information Systems Agency for Combination and Miscellaneous Instruments. Signed on 2006-04-19. Completion date: 2006-04-28.
Top industries in this zip code by the number of employees in 2005:
2003 - 2018 National Fire Incident Reporting System (NFIRS) incidents
Based on the data from the years 2003 - 2018 the average number of fires per year is 16. The highest number of fire incidents - 69 took place in 2016, and the least - 0 in 2013. The data has a rising trend.
When looking into fire subcategories, the most incidents belonged to: Structure Fires (49.6%), and Outside Fires (33.2%).
Fire incident types reported to NFIRS in Zip Code 16505

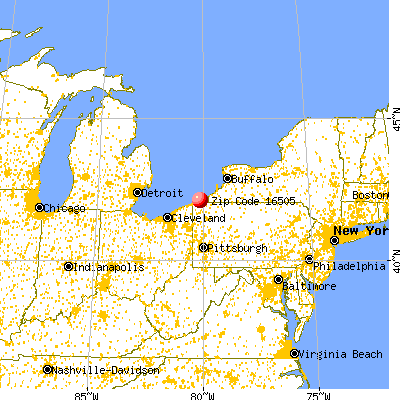


 Nearest zip codes: 16502, 16501, 16507, 16508, 16506, 16503.


 Based on the data from the years 2003 - 2018 the average number of fires per year is 16. The highest number of fire incidents - 69 took place in 2016, and the least - 0 in 2013. The data has a rising trend.
 When looking into fire subcategories, the most incidents belonged to: Structure Fires (49.6%), and Outside Fires (33.2%).