Estimated zip code population in 2022: 24,168 Zip code population in 2010: 23,720 Zip code population in 2000: 22,604
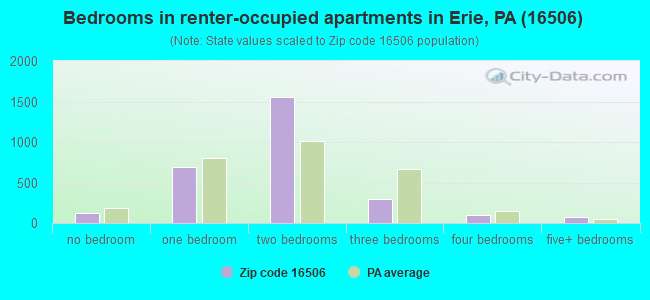
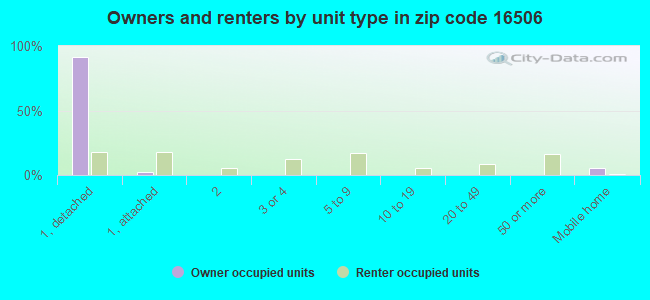
Houses and condos: 10,481 Renter-occupied apartments: 2,838
% of renters here:
28%
State:
31%
March 2022 cost of living index in zip code 16506: 92.2 (less than average, U.S. average is 100)
Land area: 14.0 sq. mi. Water area: 0.0 sq. mi.
Population density: 1,726 people per square mile
(low).
OSM Map
General Map
Google Map
MSN Map
OSM Map
General Map
Google Map
MSN Map
OSM Map
General Map
Google Map
MSN Map
OSM Map
General Map
Google Map
MSN Map
Please wait while loading the map...
Real estate property taxes paid for housing units in 2022:
This zip code:
1.5% ($3,513)
Pennsylvania:
1.3% ($3,094)
Median real estate property taxes paid for housing units with mortgages in 2022: $3,820 (1.5%) Median real estate property taxes paid for housing units with no mortgage in 2022: $3,033 (1.4%)
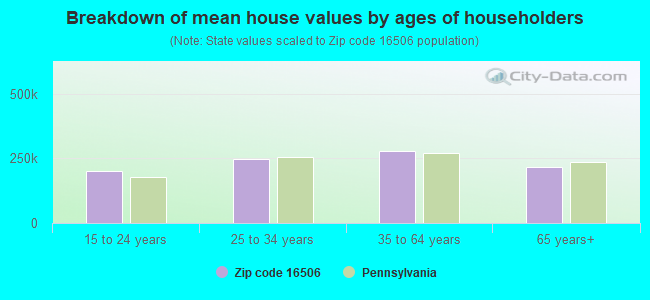
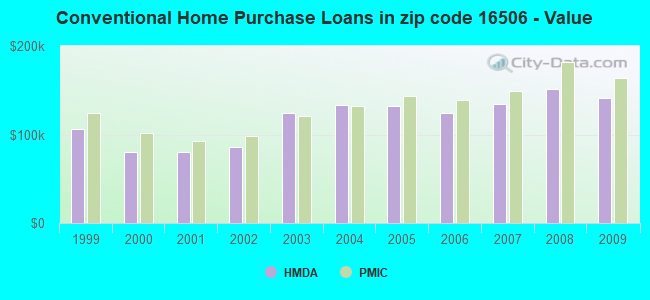
Estimated median house/condo value in 2022: $234,213
16506:
$234,213
Pennsylvania:
$245,500
According to our research of Pennsylvania and other state lists, there were 14 registered sex offenders living in 16506 zip code as of April 27, 2024. The ratio of all residents to sex offenders in zip code 16506 is 1,760 to 1. The ratio of registered sex offenders to all residents in this zip code is much lower than the state average.
Median resident age:
This zip code:
44.5 years
Pennsylvania median age:
40.9 years
Average household size:
This zip code:
2.4 people
Pennsylvania:
2.4 people
Averages for the 2020 tax year for zip code 16506, filed in 2021:
Average Adjusted Gross Income (AGI) in 2020: $85,028 (Individual Income Tax Returns)
Here:
$85,028
State:
$75,707
Salary/wage: $63,031 (reported on 79.0% of returns)
Here:
$63,031
State:
$62,806
(% of AGI for various income ranges: 1011.8% for AGIs below $25k, 3255.9% for AGIs $25k-50k, 5833.4% for AGIs $50k-75k, 8492.9% for AGIs $75k-100k, 16118.3% for AGIs $100k-200k, 77250.0% for AGIs over 200k)
Taxable interest for individuals: $1,734 (reported on 38.1% of returns)
This zip code:
$1,734
Pennsylvania:
$1,633
(% of AGI for various income ranges: 23.7% for AGIs below $25k, 25.3% for AGIs $25k-50k, 54.9% for AGIs $50k-75k, 80.1% for AGIs $75k-100k, 120.0% for AGIs $100k-200k, 1857.8% for AGIs over 200k)
Ordinary dividends: $5,823 (reported on 25.9% of returns)
Here:
$5,823
State:
$7,382
(% of AGI for various income ranges: 45.4% for AGIs below $25k, 47.1% for AGIs $25k-50k, 105.9% for AGIs $50k-75k, 147.0% for AGIs $75k-100k, 334.3% for AGIs $100k-200k, 4385.7% for AGIs over 200k)
Net capital gain/loss in AGI: +$23,601 (reported on 22.2% of returns)
Here:
+$23,601
State:
+$23,522
(% of AGI for various income ranges: 13.2% for AGIs below $25k, 30.3% for AGIs $25k-50k, 100.9% for AGIs $50k-75k, 176.0% for AGIs $75k-100k, 610.8% for AGIs $100k-200k, 23975.2% for AGIs over 200k)
Profit/loss from business: +$22,373 (reported on 11.5% of returns)
Here:
+$22,373
State:
+$16,274
(% of AGI for various income ranges: 50.1% for AGIs below $25k, 96.0% for AGIs $25k-50k, 184.7% for AGIs $50k-75k, 381.4% for AGIs $75k-100k, 774.0% for AGIs $100k-200k, 5991.7% for AGIs over 200k)
Taxable individual retirement arrangement distribution: $17,746 (reported on 14.1% of returns)
16506:
$17,746
Pennsylvania:
$18,583
(% of AGI for various income ranges: 109.4% for AGIs below $25k, 157.3% for AGIs $25k-50k, 346.7% for AGIs $50k-75k, 489.3% for AGIs $75k-100k, 943.3% for AGIs $100k-200k, 2056.5% for AGIs over 200k)
Self-employed (Keogh) retirement plans: $19,375 (reported on 0.9% of returns)
16506:
$19,375
Pennsylvania:
$25,407
(% of AGI for various income ranges: 7.0% for AGIs $25k-50k, 42.1% for AGIs $100k-200k, 717.4% for AGIs over 200k)
Total itemized deductions: $34,969 (reported on 5.1% of returns)
Here:
$34,969
State:
$34,850
(% of AGI for various income ranges: 49.5% for AGIs below $25k, 63.8% for AGIs $25k-50k, 147.3% for AGIs $50k-75k, 286.3% for AGIs $75k-100k, 501.2% for AGIs $100k-200k, 4045.2% for AGIs over 200k)
Charity contributions: $11,932 (reported on 3.9% of returns)
Here:
$11,932
State:
$12,392
(% of AGI for various income ranges: 2.0% for AGIs below $25k, 5.8% for AGIs $25k-50k, 22.7% for AGIs $50k-75k, 46.1% for AGIs $75k-100k, 118.9% for AGIs $100k-200k, 1570.0% for AGIs over 200k)
Taxes paid: $7,797 (reported on 5.0% of returns)
16506:
$7,797
State:
$8,200
(% of AGI for various income ranges: 6.0% for AGIs below $25k, 13.7% for AGIs $25k-50k, 33.2% for AGIs $50k-75k, 79.1% for AGIs $75k-100k, 122.2% for AGIs $100k-200k, 810.0% for AGIs over 200k)
Earned income credit: $1,970 (reported on 9.0% of returns)
Here:
$1,970
State:
$2,100
(% of AGI for various income ranges: 45.7% for AGIs below $25k, 46.4% for AGIs $25k-50k)
Percentage of individuals using paid preparers for their 2020 taxes: 93.5%
Here:
93%
State:
92%
(% for various income ranges: 92.2% for AGIs below $25k, 94.6% for AGIs $25k-50k, 93.5% for AGIs $50k-75k, 93.8% for AGIs $75k-100k, 93.6% for AGIs $100k-200k, 94.4% for AGIs over 200k)
Averages for the 2012 tax year for zip code 16506, filed in 2013:
Average Adjusted Gross Income (AGI) in 2012: $71,662 (Individual Income Tax Returns)
Here:
$71,662
State:
$61,346
Salary/wage: $54,889 (reported on 81.2% of returns)
Here:
$54,889
State:
$51,902
(% of AGI for various income ranges: 66.6% for AGIs below $25k, 73.1% for AGIs $25k-50k, 76.3% for AGIs $50k-75k, 75.3% for AGIs $75k-100k, 77.1% for AGIs $100k-200k, 39.7% for AGIs over 200k)
Taxable interest for individuals: $1,240 (reported on 45.7% of returns)
This zip code:
$1,240
Pennsylvania:
$1,588
(% of AGI for various income ranges: 2.0% for AGIs below $25k, 0.8% for AGIs $25k-50k, 0.7% for AGIs $50k-75k, 0.6% for AGIs $75k-100k, 0.8% for AGIs $100k-200k, 0.6% for AGIs over 200k)
Ordinary dividends: $4,770 (reported on 29.3% of returns)
Here:
$4,770
State:
$5,827
(% of AGI for various income ranges: 2.6% for AGIs below $25k, 1.6% for AGIs $25k-50k, 1.2% for AGIs $50k-75k, 1.4% for AGIs $75k-100k, 1.5% for AGIs $100k-200k, 2.7% for AGIs over 200k)
Net capital gain/loss in AGI: +$11,979 (reported on 20.1% of returns)
Here:
+$11,979
State:
+$14,495
(% of AGI for various income ranges: 0.4% for AGIs $25k-50k, 0.5% for AGIs $50k-75k, 0.8% for AGIs $75k-100k, 1.3% for AGIs $100k-200k, 7.9% for AGIs over 200k)
Profit/loss from business: +$19,695 (reported on 12.2% of returns)
Here:
+$19,695
State:
+$16,268
(% of AGI for various income ranges: 4.1% for AGIs below $25k, 2.7% for AGIs $25k-50k, 2.6% for AGIs $50k-75k, 2.8% for AGIs $75k-100k, 4.4% for AGIs $100k-200k, 3.1% for AGIs over 200k)
Taxable individual retirement arrangement distribution: $13,851 (reported on 14.4% of returns)
16506:
$13,851
Pennsylvania:
$14,550
(% of AGI for various income ranges: 6.6% for AGIs below $25k, 4.5% for AGIs $25k-50k, 3.1% for AGIs $50k-75k, 3.1% for AGIs $75k-100k, 3.3% for AGIs $100k-200k, 1.2% for AGIs over 200k)
Self-employment retirement plans: $18,217 (reported on 1.0% of returns)
16506:
$18,217
Pennsylvania:
$20,922
(% of AGI for various income ranges: 0.2% for AGIs $25k-50k, 0.3% for AGIs $100k-200k, 0.4% for AGIs over 200k)
Total itemized deductions: $23,001 (14% of AGI, reported on 30.3% of returns)
Here:
$23,001
State:
$23,538
Here:
14.4% of AGI
State:
18.4% of AGI
(% of AGI for various income ranges: 7.7% for AGIs below $25k, 8.0% for AGIs $25k-50k, 9.3% for AGIs $50k-75k, 10.0% for AGIs $75k-100k, 12.0% for AGIs $100k-200k, 9.1% for AGIs over 200k)
Charity contributions: $3,700 (reported on 24.7% of returns)
Here:
$3,700
State:
$4,025
(% of AGI for various income ranges: 0.5% for AGIs below $25k, 0.9% for AGIs $25k-50k, 1.0% for AGIs $50k-75k, 1.3% for AGIs $75k-100k, 1.8% for AGIs $100k-200k, 1.3% for AGIs over 200k)
Taxes paid: $9,932 (reported on 30.3% of returns)
16506:
$9,932
State:
$9,982
(% of AGI for various income ranges: 1.3% for AGIs below $25k, 2.3% for AGIs $25k-50k, 3.3% for AGIs $50k-75k, 4.1% for AGIs $75k-100k, 5.9% for AGIs $100k-200k, 4.4% for AGIs over 200k)
Earned income credit: $1,883 (reported on 10.5% of returns)
Here:
$1,883
State:
$2,106
(% of AGI for various income ranges: 3.5% for AGIs below $25k, 0.7% for AGIs $25k-50k)
Percentage of individuals using paid preparers for their 2012 taxes: 51.0%
Here:
51%
State:
53%
(% for various income ranges: 43.2% for AGIs below $25k, 49.2% for AGIs $25k-50k, 55.9% for AGIs $50k-75k, 55.1% for AGIs $75k-100k, 59.4% for AGIs $100k-200k, 82.4% for AGIs over 200k)
Averages for the 2004 tax year for zip code 16506, filed in 2005:
Average Adjusted Gross Income (AGI) in 2004: $49,967 (Individual Income Tax Returns)
Here:
$49,967
State:
$48,049
Salary/wage: $44,613 (reported on 82.0% of returns)
Here:
$44,613
State:
$42,646
(% of AGI for various income ranges: 271.5% for AGIs below $10k, 63.6% for AGIs $10k-25k, 78.4% for AGIs $25k-50k, 80.5% for AGIs $50k-75k, 83.9% for AGIs $75k-100k, 62.4% for AGIs over 100k)
Taxable interest for individuals: $1,604 (reported on 61.8% of returns)
This zip code:
$1,604
Pennsylvania:
$1,657
(% of AGI for various income ranges: 58.1% for AGIs below $10k, 4.6% for AGIs $10k-25k, 1.6% for AGIs $25k-50k, 1.5% for AGIs $50k-75k, 1.3% for AGIs $75k-100k, 1.3% for AGIs over 100k)
Taxable dividends: $3,770 (reported on 35.0% of returns)
Here:
$3,770
State:
$3,566
(% of AGI for various income ranges: 15.8% for AGIs below $10k, 2.7% for AGIs $10k-25k, 1.6% for AGIs $25k-50k, 1.3% for AGIs $50k-75k, 1.2% for AGIs $75k-100k, 3.9% for AGIs over 100k)
Net capital gain/loss: +$4,146 (reported on 25.6% of returns)
Here:
+$4,146
State:
+$9,716
(% of AGI for various income ranges: -8.8% for AGIs below $10k, 0.3% for AGIs $10k-25k, 0.3% for AGIs $25k-50k, 0.9% for AGIs $50k-75k, 0.9% for AGIs $75k-100k, 4.3% for AGIs over 100k)
Profit/loss from business: +$15,907 (reported on 12.8% of returns)
Here:
+$15,907
State:
+$14,267
(% of AGI for various income ranges: 3.8% for AGIs below $10k, 2.9% for AGIs $10k-25k, 3.5% for AGIs $25k-50k, 3.1% for AGIs $50k-75k, 3.0% for AGIs $75k-100k, 5.4% for AGIs over 100k)
IRA payment deduction: $2,952 (reported on 3.0% of returns)
16506:
$2,952
Pennsylvania:
$2,903
(% of AGI for various income ranges: 0.9% for AGIs below $10k, 0.2% for AGIs $10k-25k, 0.3% for AGIs $25k-50k, 0.2% for AGIs $50k-75k, 0.1% for AGIs $75k-100k, 0.1% for AGIs over 100k)
Self-employed pension: $14,336 (reported on 1.2% of returns)
Here:
$14,336
Pennsylvania:
$14,674
(% of AGI for various income ranges: 0.1% for AGIs $25k-50k, 0.1% for AGIs $50k-75k, 0.3% for AGIs $75k-100k, 0.6% for AGIs over 100k)
Total itemized deductions: $18,371 (18% of AGI, reported on 33.7% of returns)
Here:
$18,371
State:
$18,804
Here:
18.5% of AGI
State:
19.5% of AGI
(% of AGI for various income ranges: 30.0% for AGIs below $10k, 7.4% for AGIs $10k-25k, 9.5% for AGIs $25k-50k, 12.4% for AGIs $50k-75k, 14.0% for AGIs $75k-100k, 13.4% for AGIs over 100k)
Charity contributions deductions: $3,201 (3% of AGI, reported on 30.3% of returns)
Here:
$3,201
State:
$3,337
Here:
3.1% of AGI
State:
3.3% of AGI
(% of AGI for various income ranges: 1.6% for AGIs below $10k, 0.7% for AGIs $10k-25k, 1.2% for AGIs $25k-50k, 1.6% for AGIs $50k-75k, 1.7% for AGIs $75k-100k, 2.7% for AGIs over 100k)
Total tax: $8,356 (reported on 76.1% of returns)
16506:
$8,356
State:
$8,008
(% of AGI for various income ranges: 7.1% for AGIs below $10k, 4.1% for AGIs $10k-25k, 7.3% for AGIs $25k-50k, 8.7% for AGIs $50k-75k, 10.3% for AGIs $75k-100k, 19.0% for AGIs over 100k)
Earned income credit: $1,487 (reported on 8.6% of returns)
Here:
$1,487
State:
$1,643
Percentage of individuals using paid preparers for their 2004 taxes: 53.8%
Here:
54%
State:
56%
(% for various income ranges: 46.4% for AGIs below $10k, 53.9% for AGIs $10k-25k, 54.8% for AGIs $25k-50k, 55.4% for AGIs $50k-75k, 52.9% for AGIs $75k-100k, 66.4% for AGIs over 100k)
Household received Food Stamps/SNAP in the past 12 months: 786 Household did not receive Food Stamps/SNAP in the past 12 months: 9,215
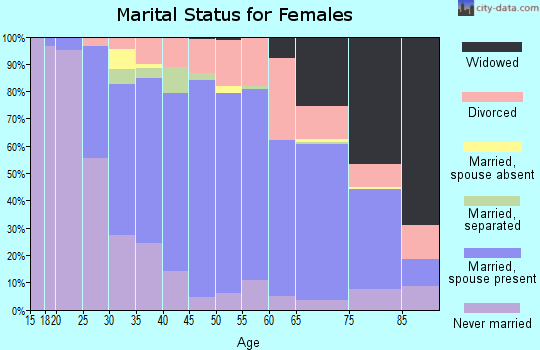
Women who had a birth in the past 12 months: 275 (267 now married, 21 unmarried) Women who did not have a birth in the past 12 months: 4,354 (2,240 now married, 2,095 unmarried)
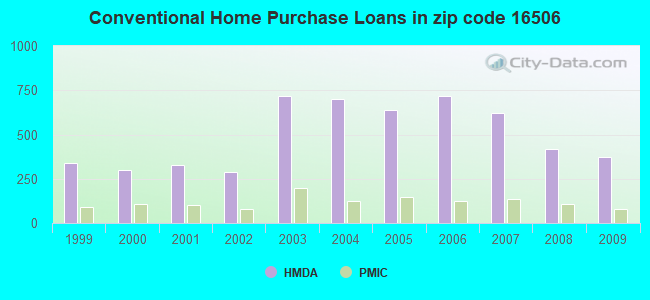
Housing units in zip code 16506 with a mortgage: 4,198 (472 second mortgage, 41 home equity loan, 395 both second mortgage and home equity loan) Houses without a mortgage: 407
Median monthly owner costs for units with a mortgage: $1,532 Median monthly owner costs for units without a mortgage: $612
Residents with income below the poverty level in 2022:
This zip code:
6.6%
Whole state:
11.8%
Residents with income below 50% of the poverty level in 2022:
This zip code:
4.2%
Whole state:
6.1%
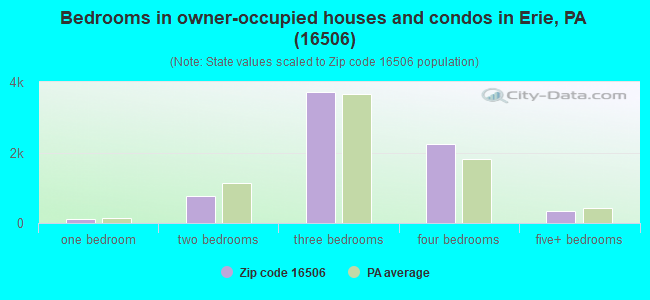
Median number of rooms in houses and condos:
Here:
6.9
State:
6.8
Median number of rooms in apartments:
Here:
4.2
State:
4.3
Notable locations in this zip code not listed on our city pages
Notable locations in zip code 16506: Erie Municipal Golf Course (A), Love Corners (B), Zuck Road Plaza (C), Plaza 79 (D), Kah Kwa Country Club (E), West Ridge Fire Department Headquarters (F), West Ridge Fire Department South Station (G). Display/hide their locations on the map
Churches in zip code 16506 include: Saint Paul's Lutheran Church (A), First Church of Christ Scientist (B), Saint Peter's Lutheran Church (C). Display/hide their locations on the map
3,871 married couples with children.
871 single-parent households (333 men, 538 women).
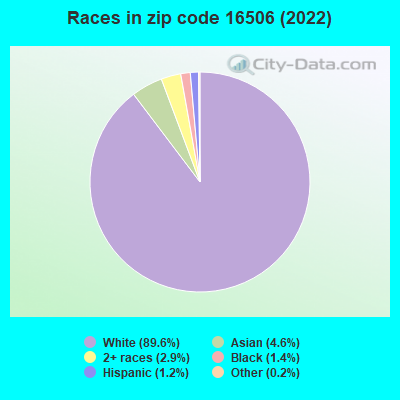
93.2% of residents of 16506 zip code speak English at home.
1.4% of residents speak Spanish at home (57% very well, 21% well, 22% not well).
2.4% of residents speak other Indo-European language at home (73% very well, 14% well, 6% not well, 7% not at all).
2.5% of residents speak Asian or Pacific Island language at home (84% very well, 13% well, 3% not well).
0.1% of residents speak other language at home (100% very well).
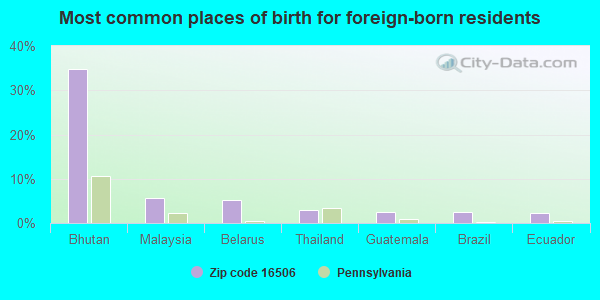
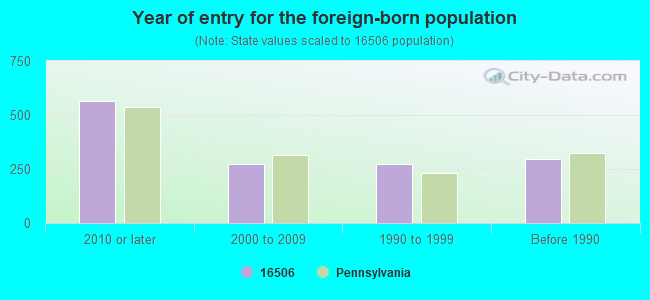
Foreign born population: 1,246 (5.2%) (56.2% of them are naturalized citizens)
Facilities with environmental interests located in this zip code:
APW ERIE (4000 WEST RIDGE ROAD in ERIE, PA)
AIR MINOR (AIRS/AFS) (Integrated Compliance Information System) - ICIS-03-2000-0050, FORMAL ENFORCEMENT ACTION COMPLIANCE ACTIVITY (Tracking inspections of insecticide, fungicide, and rodenticide, and toxic substances) CRITERIA AND HAZARDOUS AIR POLLUTANT INVENTORY (Inventory of air pollution sources) STATE MASTER (Pennsylvania database) - AFS-25-1661535-1, AIR PROGRAM HAZARDOUS WASTE BIENNIAL REPORTER (Resource Conservation and Recovery Act (tracking hazardous waste)) (Resource Conservation and Recovery Act (tracking hazardous waste)) TRI REPORTER (Tracking of toxic chemicals releasing facilities) Business SIC classification: SHEET METALWORK; COATING, ENGRAVING, AND ALLIED SERVICES; FABRICATED METAL PRODUCTS Business NAICS classification: ALL OTHER MISCELLANEOUS FABRICATED METAL PRODUCT MANUFACTURING. Organizations: GROTH RICHARD (CONTACT/OWNER)
, APW-ERIE, INC. (CONTACT/OWNER)
Alternative names: APW ERIE/ERIE, APW ERIE METALADE OF PA, APW METALADE COMPANY, ERVITE CORP, ERVITE DIV METALADE OF PA INC, METALADE OF PENNSYLVANIA, INC., METALADE OF PENNSYLVANIA, ERVITE DIV.
AUTOCLAVE ENGR DIV SNAP TITE (2930 W. 22ND ST. in ERIE, PA)
COMPLIANCE ACTIVITY (Tracking inspections of insecticide, fungicide, and rodenticide, and toxic substances) CRITERIA AND HAZARDOUS AIR POLLUTANT INVENTORY (Inventory of air pollution sources) STATE MASTER (Pennsylvania database) - RCRIS-PAD005028485, HAZARDOUS WASTE PROGRAM National Pollutant Discharge Elimination System NON-MAJOR (Tracking pollutant discharge elimination systems) - permit Conditionally Exempt Small Quantity Generators, less than 100 kg/month of hazardous waste (Resource Conservation and Recovery Act (tracking hazardous waste)) - notification TRI REPORTER (Tracking of toxic chemicals releasing facilities) Business SIC classification: FABRICATED PLATE WORK (BOILER SHOPS); SCREW MACHINE PRODUCTS; METAL STAMPINGS; VALVES AND PIPE FITTINGS; FABRICATED METAL PRODUCTS; LABORATORY APPARATUS AND FURNITURE Business NAICS classification: PRECISION TURNED PRODUCT MANUFACTURING. Organizations: OPERNAME (CONTACT/OPERATOR)
, AUTOCLAVE ENGINEERS INC (CONTACT/OWNER)
Alternative names: AUTOCLAVE ENGINEERS INC, SNAP-TITE INC, SNAP TITE INC. AUTOCLAVE ENGINEERS DIV.
BLILEY TECH (2545 W GRANDVIEW BLVD in ERIE, PA)
STATE MASTER (Pennsylvania database) - RCRIS-PAD005030085, HAZARDOUS WASTE PROGRAM HAZARDOUS WASTE BIENNIAL REPORTER (Resource Conservation and Recovery Act (tracking hazardous waste)) Small Quantity Generators, between 100 kg and 1000 kg of hazardous waste/month (Resource Conservation and Recovery Act (tracking hazardous waste)) - notification TRI REPORTER (Tracking of toxic chemicals releasing facilities) Business SIC classification: ELECTRONIC COMPONENTS Business NAICS classification: OTHER ELECTRONIC COMPONENT MANUFACTURING. Organizations: OPERNAME (CONTACT/OPERATOR)
, RICHARDS ROGER W (CONTACT/OWNER)
Alternative names: BLILEY ELECTRIC CO
BOB FERRANDO NISSAN (3457 WEST 26TH in ERIE, PA)
STATE MASTER (Pennsylvania database) - RCRIS-PAD982363236, HAZARDOUS WASTE PROGRAM (Resource Conservation and Recovery Act (tracking hazardous waste)) Organizations: OPERNAME (CONTACT/OPERATOR)
, BOB FERRANDO NISSAN INC (CONTACT/OWNER)
ASBURY EL SCH (3814 ASBURY RD in ERIE, PA)
(National Center for Education Statistics) - STATE ID-2053 Organizations: MILLCREEK TOWNSHIP SD (SCHOOL DISTRICT)
AEROSEPTCS PA INC. (2800 21ST. ST. in ERIE, PA)
COMPLIANCE ACTIVITY (Tracking inspections of insecticide, fungicide, and rodenticide, and toxic substances)
Housing units lacking complete plumbing facilities: 0.3% Housing units lacking complete kitchen facilities: 2.2%
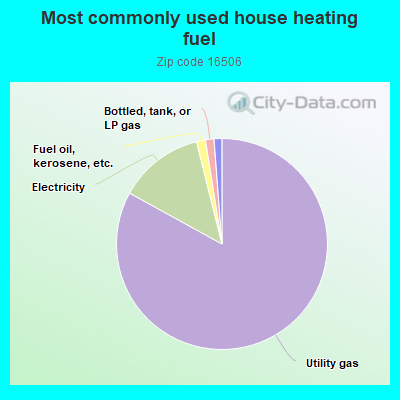
83.1%Utility gas
13.1%Electricity
1.4%Fuel oil, kerosene, etc.
1.3%Bottled, tank, or LP gas
1.2%Wood
Population in 1990: 19,269. Population change in the 1990s: +3,335 (+17.3%).
Place of birth for U.S.-born residents:
This state: 18,734
Northeast: 1,659
Midwest: 1,203
South: 834
West: 266
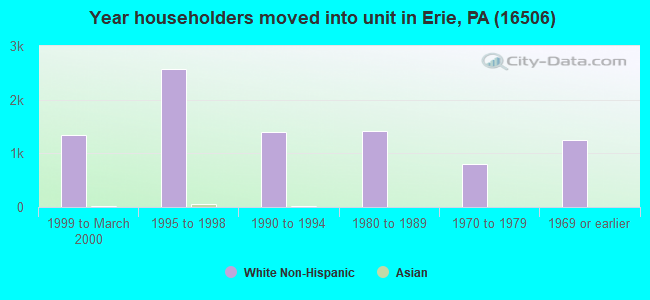
58% of the 16506 zip code residents lived in the same house 5 years ago. Out of people who lived in different houses, 72% lived in this county. Out of people who lived in different counties, 50% lived in Pennsylvania.
91% of the 16506 zip code residents lived in the same house 1 year ago. Out of people who lived in different houses, 70% moved from this county. Out of people who lived in different houses, 13% moved from different county within same state. Out of people who lived in different houses, 15% moved from different state. Out of people who lived in different houses, 1% moved from abroad.
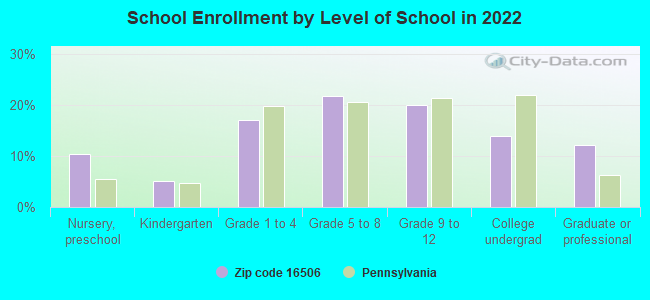
Private vs. public school enrollment:
Students in private schools in grades 1 to 8 (elementary and middle school): 276
Here:
12.9%
Pennsylvania:
15.7%
Students in private schools in grades 9 to 12 (high school): 134
Here:
12.1%
Pennsylvania:
13.4%
Students in private undergraduate colleges: 313
Here:
40.5%
Pennsylvania:
39.8%
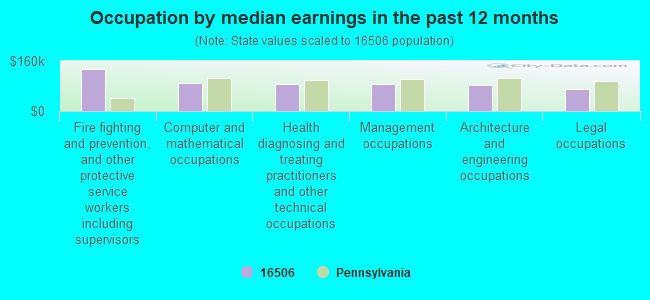
Occupation by median earnings in the past 12 months ($)
133,134Fire fighting and prevention, and other protective service workers including supervisors
88,441Computer and mathematical occupations
86,789Health diagnosing and treating practitioners and other technical occupations
86,770Management occupations
81,658Architecture and engineering occupations
71,859Legal occupations
Companies with federal contracts located in this zip code (ERIE, PA):
STERIS CORPORATION (2545 W 23RD ST) : $314,587 in 7 contractsfrom 1999 to 2001
Contracts for Hospital Furniture, Equipment, Utensils, and Supplies, Medical and Surgical Instruments, Equipment, and Supplies, Maintenance, Repair and Rebuilding of Equipment -- Medical, Dental, and Veterinary Equipment and Supplies by Navy, Department of Veterans Affairs Signed by year:2000: $33,000; 2001: $205,587; 2002: $0; 2003: $0; 2004: $0; 2005: $0; 2006: $0.
Biggest contracts:
$78,460 with Navy for Hospital Furniture, Equipment, Utensils, and Supplies. Signed on 2001-10-01. Completion date: 2001-10-01.
$70,000 with Department of Veterans Affairs for Medical and Surgical Instruments, Equipment, and Supplies. Taking place in OH. Signed on 2001-01-15. Completion date: 2001-01-15.
$57,127 with Navy for Hospital Furniture, Equipment, Utensils, and Supplies. Signed on 2001-01-19. Completion date: 2001-01-30.
$43,000 with Department of Veterans Affairs for Maintenance, Repair and Rebuilding of Equipment -- Medical, Dental, and Veterinary Equipment and Supplies. Taking place in FL. Signed on 1999-10-15. Completion date: 2000-09-15.
BLILEY TECHNOLOGIES, INC (2545 W GRANDVIEW BLVD; small business) : $131,433 in 12 contractsfrom 2004 to 2006
Contracts for Oscillators and Piezoelectric Crystals, Miscellaneous Electrical and Electronic Components, Motor Vehicle Maintenance and Repair Shop Specialized Equipment by Defense Logistics Agency, Navy Signed by year:2000: $0; 2001: $0; 2002: $0; 2003: $0; 2004: $39,261; 2005: $80,018; 2006: $12,154.
Biggest contracts:
$44,332 with Defense Logistics Agency for Oscillators and Piezoelectric Crystals. Signed on 2005-11-01. Completion date: 2006-04-04.
$31,521 with Navy for Miscellaneous Electrical and Electronic Components. Signed on 2004-07-08. Completion date: 2004-09-16.
$18,368 with Defense Logistics Agency for Oscillators and Piezoelectric Crystals. Signed on 2005-09-27. Completion date: 2006-01-26.
$8,103, same as above.Signed on 2006-05-02. Completion date: 2006-06-02.
KINETIC BIOMEDICAL SERVICES, I (4509 W RIDGE RD) : $55,000 in 2 contractsin 2005
$50,000 with Air Force for Maintenance, Repair and Rebuilding of Equipment -- Office Machines, Text Processing Systems and Visible Record Equipment. Taking place in LA. Signed on 2005-11-01. Completion date: 2006-10-31.
$5,000 with Federal Emergency Management Agency for Laboratory Testing Services. Signed on 2005-10-05. Completion date: 2005-10-05.
ORGAN SUPPLY INDUSTRIES INC (2320 W 50TH ST; small business)
$8,849 with Army for Ecclesiastical Equipment, Furnishings, and Supplies. Signed on 2005-08-30. Completion date: 2005-10-14.
SIGNAL TECH (4985 PTTSBURGH AVE; small business) : $5,837 in 2 contractsin 2006
$5,738 with Defense Logistics Agency for Traffic and Transit Signal Systems. Signed on 2006-01-05. Completion date: 2006-01-25.
$99, same as above.Signed on 2006-01-17. Completion date: 2006-01-25.
Top industries in this zip code by the number of employees in 2005:
Administrative and Support and Waste Management and Remediation Services: Telemarketing Bureaus (over 1000 employees: 1 establishment)
Administrative and Support and Waste Management and Remediation Services: Telephone Answering Services (250-499: 1)
2006 - 2018 National Fire Incident Reporting System (NFIRS) incidents
Based on the data from the years 2006 - 2018 the average number of fires per year is 35. The highest number of fire incidents - 86 took place in 2018, and the least - 0 in 2008. The data has a rising trend.
When looking into fire subcategories, the most incidents belonged to: Structure Fires (46.6%), and Other (22.4%).
Fire incident types reported to NFIRS in Zip Code 16506

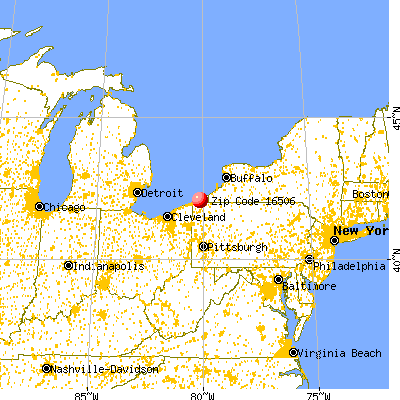


 Nearest zip codes: 16508, 16502, 16505, 16415, 16426, 16501.
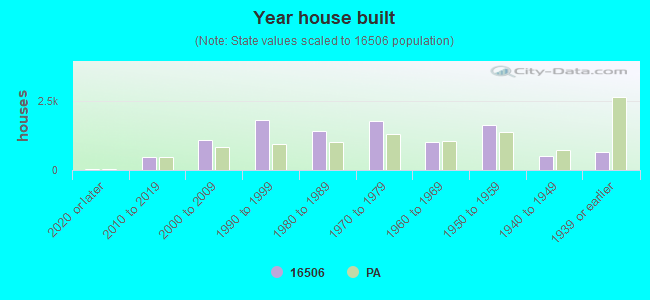


 Based on the data from the years 2006 - 2018 the average number of fires per year is 35. The highest number of fire incidents - 86 took place in 2018, and the least - 0 in 2008. The data has a rising trend.
 When looking into fire subcategories, the most incidents belonged to: Structure Fires (46.6%), and Other (22.4%).