Estimated zip code population in 2022: 13,036 Zip code population in 2010: 13,488 Zip code population in 2000: 13,026
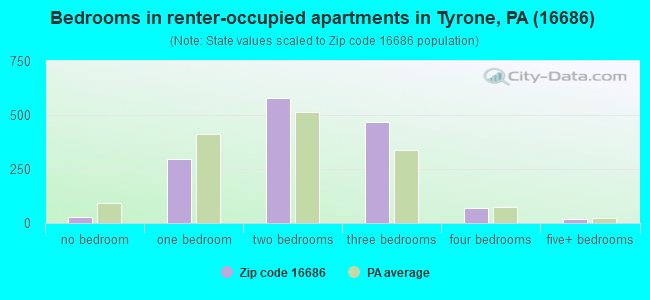
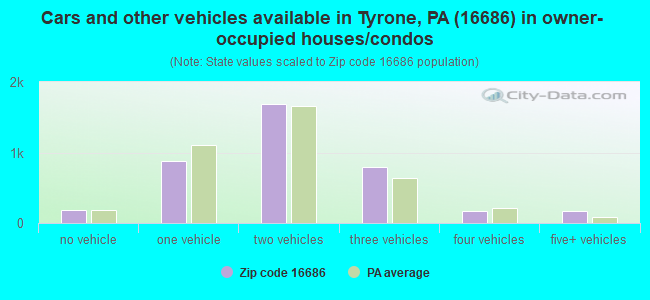
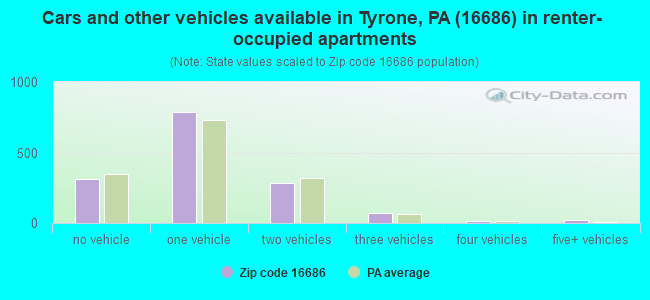
Houses and condos: 5,947 Renter-occupied apartments: 1,476
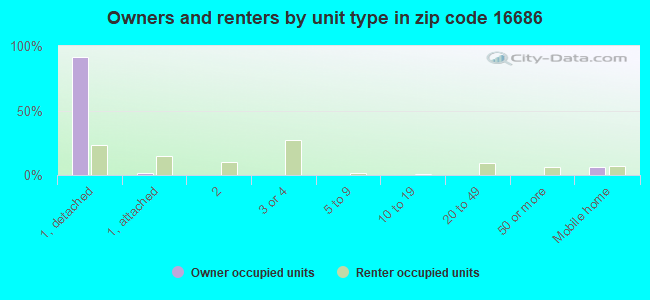
% of renters here:
28%
State:
31%
March 2022 cost of living index in zip code 16686: 90.8 (less than average, U.S. average is 100)
Land area: 135.1 sq. mi. Water area: 0.2 sq. mi.
Population density: 96 people per square mile
(very low).
OSM Map
General Map
Google Map
MSN Map
OSM Map
General Map
Google Map
MSN Map
OSM Map
General Map
Google Map
MSN Map
OSM Map
General Map
Google Map
MSN Map
Please wait while loading the map...
Real estate property taxes paid for housing units in 2022:
This zip code:
0.8% ($1,386)
Pennsylvania:
1.3% ($3,094)
Median real estate property taxes paid for housing units with mortgages in 2022: $1,382 (0.8%) Median real estate property taxes paid for housing units with no mortgage in 2022: $1,396 (0.8%)
Business Search- 14 Million verified businesses
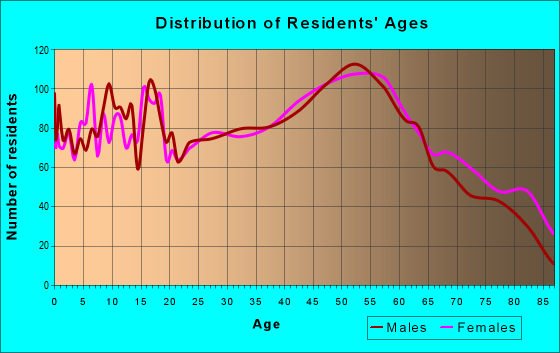
Males: 6,401
(49.1%)
Females: 6,635
(50.9%)
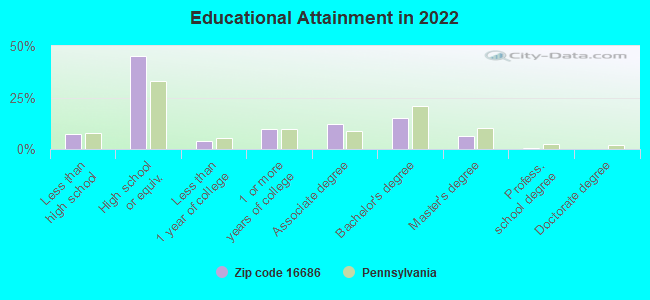
For population 25 years and over in 16686:
High school or higher: 91.5%
Bachelor's degree or higher: 21.8%
Graduate or professional degree: 7.1%
Unemployed: 3.7%
Mean travel time to work (commute): 21.9 minutes
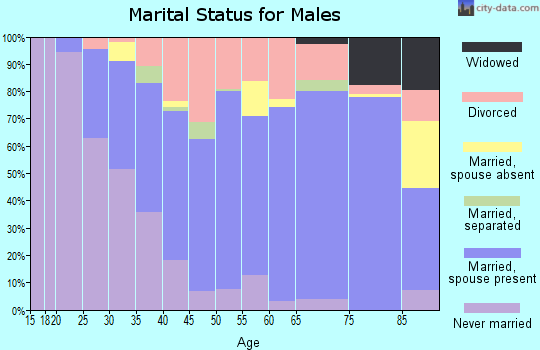
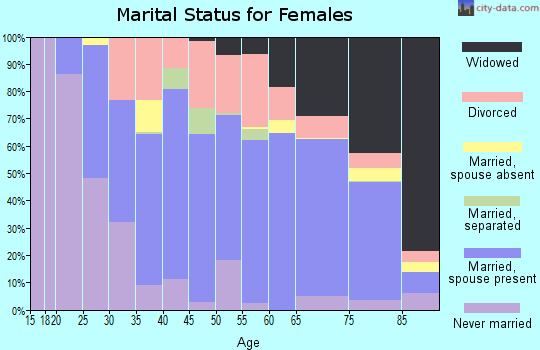
For population 15 years and over in 16686:
Never married: 28.3%
Now married: 51.0%
Separated: 2.0%
Widowed: 8.2%
Divorced: 10.5%
Zip code 16686 compared to state average:
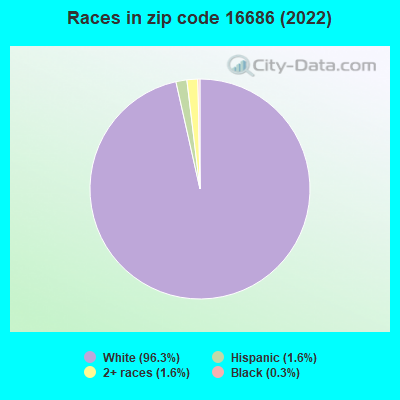
Black race population percentage significantly below state average.
Hispanic race population percentage significantly below state average.
Foreign-born population percentage significantly below state average.
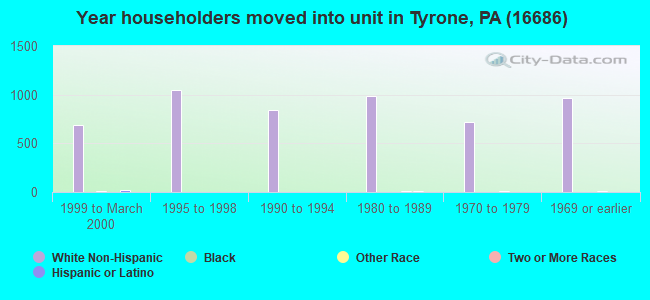
Length of stay since moving in significantly above state average.
Percentage of population with a bachelor's degree or higher below state average.
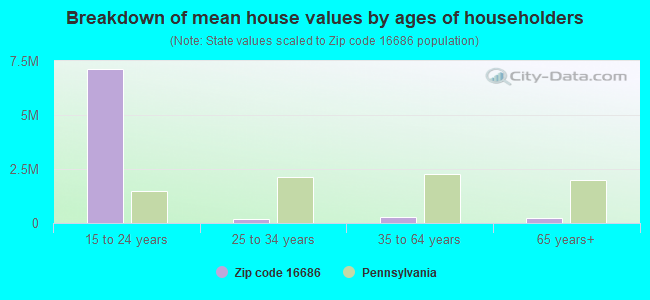
Estimated median house/condo value in 2022: $178,536
16686:
$178,536
Pennsylvania:
$245,500
According to our research of Pennsylvania and other state lists, there were 22 registered sex offenders living in 16686 zip code as of April 26, 2024. The ratio of all residents to sex offenders in zip code 16686 is 612 to 1. The ratio of registered sex offenders to all residents in this zip code is near the state average.
Median resident age:
This zip code:
40.6 years
Pennsylvania median age:
40.9 years
Average household size:
This zip code:
2.4 people
Pennsylvania:
2.4 people
Averages for the 2020 tax year for zip code 16686, filed in 2021:
Average Adjusted Gross Income (AGI) in 2020: $55,809 (Individual Income Tax Returns)
Here:
$55,809
State:
$75,707
Salary/wage: $46,977 (reported on 81.5% of returns)
Here:
$46,977
State:
$62,806
(% of AGI for various income ranges: 1004.2% for AGIs below $25k, 3223.8% for AGIs $25k-50k, 5741.0% for AGIs $50k-75k, 8182.2% for AGIs $75k-100k, 14181.1% for AGIs $100k-200k, 64293.3% for AGIs over 200k)
Taxable interest for individuals: $849 (reported on 27.4% of returns)
This zip code:
$849
Pennsylvania:
$1,633
(% of AGI for various income ranges: 16.1% for AGIs below $25k, 12.9% for AGIs $25k-50k, 28.4% for AGIs $50k-75k, 54.9% for AGIs $75k-100k, 64.5% for AGIs $100k-200k, 676.7% for AGIs over 200k)
Ordinary dividends: $3,252 (reported on 15.9% of returns)
Here:
$3,252
State:
$7,382
(% of AGI for various income ranges: 20.8% for AGIs below $25k, 19.7% for AGIs $25k-50k, 51.4% for AGIs $50k-75k, 83.9% for AGIs $75k-100k, 203.6% for AGIs $100k-200k, 2600.0% for AGIs over 200k)
Net capital gain/loss in AGI: +$14,466 (reported on 12.3% of returns)
Here:
+$14,466
State:
+$23,522
(% of AGI for various income ranges: 14.3% for AGIs below $25k, 28.9% for AGIs $25k-50k, 101.1% for AGIs $50k-75k, 112.9% for AGIs $75k-100k, 305.5% for AGIs $100k-200k, 25846.7% for AGIs over 200k)
Profit/loss from business: +$12,388 (reported on 10.1% of returns)
Here:
+$12,388
State:
+$16,274
(% of AGI for various income ranges: 71.3% for AGIs below $25k, 61.2% for AGIs $25k-50k, 183.0% for AGIs $50k-75k, 180.8% for AGIs $75k-100k, 338.5% for AGIs $100k-200k, 6133.3% for AGIs over 200k)
Taxable individual retirement arrangement distribution: $10,993 (reported on 11.2% of returns)
16686:
$10,993
Pennsylvania:
$18,583
(% of AGI for various income ranges: 81.0% for AGIs below $25k, 98.8% for AGIs $25k-50k, 176.4% for AGIs $50k-75k, 252.7% for AGIs $75k-100k, 469.4% for AGIs $100k-200k)
Total itemized deductions: $34,143 (reported on 2.2% of returns)
Here:
$34,143
State:
$34,850
(% of AGI for various income ranges: 69.3% for AGIs $25k-50k, 140.0% for AGIs $75k-100k, 302.6% for AGIs $100k-200k, 4833.3% for AGIs over 200k)
Charity contributions: $13,392 (reported on 1.9% of returns)
Here:
$13,392
State:
$12,392
(% of AGI for various income ranges: 54.6% for AGIs $50k-75k, 84.9% for AGIs $100k-200k, 2346.7% for AGIs over 200k)
Taxes paid: $7,036 (reported on 2.2% of returns)
16686:
$7,036
State:
$8,200
(% of AGI for various income ranges: 10.8% for AGIs $25k-50k, 20.8% for AGIs $75k-100k, 81.3% for AGIs $100k-200k, 970.0% for AGIs over 200k)
Earned income credit: $2,129 (reported on 13.1% of returns)
Here:
$2,129
State:
$2,100
(% of AGI for various income ranges: 69.4% for AGIs below $25k, 50.2% for AGIs $25k-50k)
Percentage of individuals using paid preparers for their 2020 taxes: 95.5%
Here:
95%
State:
92%
(% for various income ranges: 94.4% for AGIs below $25k, 95.9% for AGIs $25k-50k, 95.3% for AGIs $50k-75k, 97.0% for AGIs $75k-100k, 96.0% for AGIs $100k-200k, 100.0% for AGIs over 200k)
Averages for the 2012 tax year for zip code 16686, filed in 2013:
Average Adjusted Gross Income (AGI) in 2012: $41,735 (Individual Income Tax Returns)
Here:
$41,735
State:
$61,346
Salary/wage: $37,362 (reported on 84.2% of returns)
Here:
$37,362
State:
$51,902
(% of AGI for various income ranges: 71.6% for AGIs below $25k, 80.1% for AGIs $25k-50k, 80.1% for AGIs $50k-75k, 79.6% for AGIs $75k-100k, 74.8% for AGIs $100k-200k, 38.9% for AGIs over 200k)
Taxable interest for individuals: $826 (reported on 28.8% of returns)
This zip code:
$826
Pennsylvania:
$1,588
(% of AGI for various income ranges: 1.0% for AGIs below $25k, 0.4% for AGIs $25k-50k, 0.6% for AGIs $50k-75k, 0.3% for AGIs $75k-100k, 0.4% for AGIs $100k-200k, 1.3% for AGIs over 200k)
Ordinary dividends: $2,280 (reported on 16.5% of returns)
Here:
$2,280
State:
$5,827
(% of AGI for various income ranges: 0.9% for AGIs below $25k, 0.5% for AGIs $25k-50k, 0.6% for AGIs $50k-75k, 0.8% for AGIs $75k-100k, 1.1% for AGIs $100k-200k, 2.8% for AGIs over 200k)
Net capital gain/loss in AGI: +$5,389 (reported on 10.2% of returns)
Here:
+$5,389
State:
+$14,495
(% of AGI for various income ranges: 0.2% for AGIs below $25k, 0.7% for AGIs $25k-50k, 0.6% for AGIs $50k-75k, 0.8% for AGIs $75k-100k, 1.0% for AGIs $100k-200k, 10.3% for AGIs over 200k)
Profit/loss from business: +$10,396 (reported on 10.5% of returns)
Here:
+$10,396
State:
+$16,268
(% of AGI for various income ranges: 4.0% for AGIs below $25k, 2.0% for AGIs $25k-50k, 1.6% for AGIs $50k-75k, 1.6% for AGIs $75k-100k, 5.8% for AGIs $100k-200k)
Taxable individual retirement arrangement distribution: $10,655 (reported on 10.3% of returns)
16686:
$10,655
Pennsylvania:
$14,550
(% of AGI for various income ranges: 3.7% for AGIs below $25k, 1.6% for AGIs $25k-50k, 2.4% for AGIs $50k-75k, 2.2% for AGIs $75k-100k, 4.8% for AGIs $100k-200k)
Total itemized deductions: $17,049 (19% of AGI, reported on 15.2% of returns)
Here:
$17,049
State:
$23,538
Here:
19.3% of AGI
State:
18.4% of AGI
(% of AGI for various income ranges: 3.7% for AGIs below $25k, 4.4% for AGIs $25k-50k, 4.9% for AGIs $50k-75k, 7.2% for AGIs $75k-100k, 9.8% for AGIs $100k-200k, 9.6% for AGIs over 200k)
Charity contributions: $4,031 (reported on 10.9% of returns)
Here:
$4,031
State:
$4,025
(% of AGI for various income ranges: 0.3% for AGIs below $25k, 0.5% for AGIs $25k-50k, 0.8% for AGIs $50k-75k, 1.0% for AGIs $75k-100k, 1.9% for AGIs $100k-200k, 3.0% for AGIs over 200k)
Taxes paid: $5,502 (reported on 15.2% of returns)
16686:
$5,502
State:
$9,982
(% of AGI for various income ranges: 0.6% for AGIs below $25k, 1.0% for AGIs $25k-50k, 1.4% for AGIs $50k-75k, 2.4% for AGIs $75k-100k, 4.0% for AGIs $100k-200k, 4.0% for AGIs over 200k)
Earned income credit: $2,061 (reported on 17.5% of returns)
Here:
$2,061
State:
$2,106
(% of AGI for various income ranges: 5.2% for AGIs below $25k, 1.0% for AGIs $25k-50k)
Percentage of individuals using paid preparers for their 2012 taxes: 58.0%
Here:
58%
State:
53%
(% for various income ranges: 52.9% for AGIs below $25k, 57.4% for AGIs $25k-50k, 66.7% for AGIs $50k-75k, 62.1% for AGIs $75k-100k, 65.8% for AGIs $100k-200k, 80.0% for AGIs over 200k)
Averages for the 2004 tax year for zip code 16686, filed in 2005:
Average Adjusted Gross Income (AGI) in 2004: $34,260 (Individual Income Tax Returns)
Here:
$34,260
State:
$48,049
Salary/wage: $31,113 (reported on 84.9% of returns)
Here:
$31,113
State:
$42,646
(% of AGI for various income ranges: 89.6% for AGIs below $10k, 74.4% for AGIs $10k-25k, 82.7% for AGIs $25k-50k, 85.0% for AGIs $50k-75k, 79.7% for AGIs $75k-100k, 52.0% for AGIs over 100k)
Taxable interest for individuals: $1,193 (reported on 40.2% of returns)
This zip code:
$1,193
Pennsylvania:
$1,657
(% of AGI for various income ranges: 4.9% for AGIs below $10k, 1.9% for AGIs $10k-25k, 0.9% for AGIs $25k-50k, 1.1% for AGIs $50k-75k, 1.5% for AGIs $75k-100k, 1.6% for AGIs over 100k)
Taxable dividends: $1,711 (reported on 21.2% of returns)
Here:
$1,711
State:
$3,566
(% of AGI for various income ranges: 3.0% for AGIs below $10k, 0.7% for AGIs $10k-25k, 0.7% for AGIs $25k-50k, 0.5% for AGIs $50k-75k, 1.2% for AGIs $75k-100k, 2.5% for AGIs over 100k)
Net capital gain/loss: +$5,814 (reported on 14.4% of returns)
Here:
+$5,814
State:
+$9,716
(% of AGI for various income ranges: -0.4% for AGIs below $10k, 0.7% for AGIs $10k-25k, 0.4% for AGIs $25k-50k, 0.8% for AGIs $50k-75k, 1.9% for AGIs $75k-100k, 11.2% for AGIs over 100k)
Profit/loss from business: +$7,627 (reported on 12.1% of returns)
Here:
+$7,627
State:
+$14,267
(% of AGI for various income ranges: 0.9% for AGIs below $10k, 4.1% for AGIs $10k-25k, 2.2% for AGIs $25k-50k, 1.8% for AGIs $50k-75k, 2.1% for AGIs $75k-100k, 4.8% for AGIs over 100k)
IRA payment deduction: $2,404 (reported on 2.7% of returns)
16686:
$2,404
Pennsylvania:
$2,903
(% of AGI for various income ranges: 0.3% for AGIs $10k-25k, 0.3% for AGIs $25k-50k, 0.1% for AGIs $50k-75k, 0.1% for AGIs $75k-100k, 0.2% for AGIs over 100k)
Self-employed pension: $4,417 (reported on 0.2% of returns)
Here:
$4,417
Pennsylvania:
$14,674
Total itemized deductions: $14,805 (21% of AGI, reported on 16.5% of returns)
Here:
$14,805
State:
$18,804
Here:
21.0% of AGI
State:
19.5% of AGI
(% of AGI for various income ranges: 4.5% for AGIs below $10k, 5.3% for AGIs $10k-25k, 5.5% for AGIs $25k-50k, 7.1% for AGIs $50k-75k, 10.4% for AGIs $75k-100k, 9.3% for AGIs over 100k)
Charity contributions deductions: $2,914 (4% of AGI, reported on 12.8% of returns)
Here:
$2,914
State:
$3,337
Here:
3.8% of AGI
State:
3.3% of AGI
(% of AGI for various income ranges: 0.3% for AGIs below $10k, 0.5% for AGIs $10k-25k, 0.6% for AGIs $25k-50k, 0.9% for AGIs $50k-75k, 1.8% for AGIs $75k-100k, 2.3% for AGIs over 100k)
Total tax: $4,320 (reported on 71.6% of returns)
16686:
$4,320
State:
$8,008
(% of AGI for various income ranges: 2.2% for AGIs below $10k, 4.0% for AGIs $10k-25k, 6.3% for AGIs $25k-50k, 8.5% for AGIs $50k-75k, 10.5% for AGIs $75k-100k, 18.9% for AGIs over 100k)
Earned income credit: $1,537 (reported on 16.6% of returns)
Here:
$1,537
State:
$1,643
Percentage of individuals using paid preparers for their 2004 taxes: 63.6%
Here:
64%
State:
56%
(% for various income ranges: 55.2% for AGIs below $10k, 63.4% for AGIs $10k-25k, 66.2% for AGIs $25k-50k, 68.8% for AGIs $50k-75k, 69.2% for AGIs $75k-100k, 70.1% for AGIs over 100k)
Likely homosexual households (counted as self-reported same-sex unmarried-partner households)
Lesbian couples: 0.3% of all households
Gay men: 0.2% of all households
Household received Food Stamps/SNAP in the past 12 months: 905 Household did not receive Food Stamps/SNAP in the past 12 months: 4,466
Women who had a birth in the past 12 months: 203 (115 now married, 81 unmarried) Women who did not have a birth in the past 12 months: 2,715 (1,219 now married, 1,491 unmarried)
Housing units in zip code 16686 with a mortgage: 2,226 (165 second mortgage, 14 home equity loan, 125 both second mortgage and home equity loan) Houses without a mortgage: 179
Median monthly owner costs for units with a mortgage: $1,149 Median monthly owner costs for units without a mortgage: $472
Residents with income below the poverty level in 2022:
This zip code:
10.0%
Whole state:
11.8%
Residents with income below 50% of the poverty level in 2022:
This zip code:
5.4%
Whole state:
6.1%
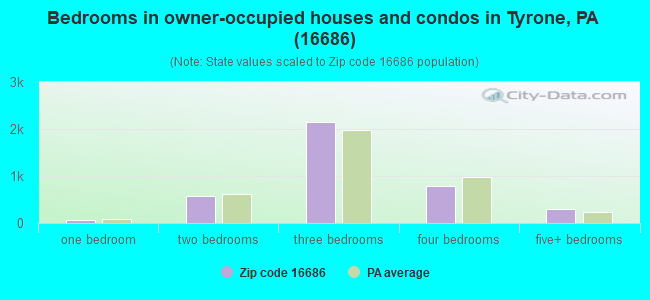
Median number of rooms in houses and condos:
Here:
6.8
State:
6.8
Median number of rooms in apartments:
Here:
4.4
State:
4.3
Notable locations in this zip code not listed on our city pages
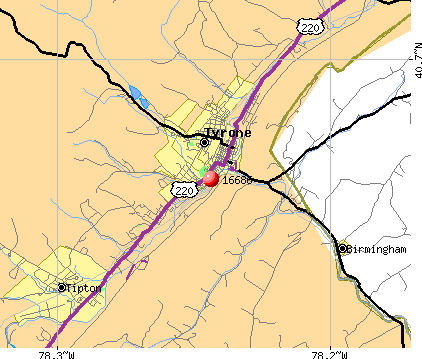
Notable locations in zip code 16686: Anderson Camp (A), McKenrick Mills (B), Grazier Mill (C), Neptune Steam Fire Company 1 (D), Bald Eagle Volunteer Fire Company Station 36 (E), Tipton - Antis District Volunteer Fire Company Station 21 (F), Blazing Arrow Hook and Ladder Fire Company Station 33 (G). Display/hide their locations on the map
Cemeteries: Baughman Cemetery (1), Branstetter Cemetery (2), Grazier Cemetery (3), Birmingham Cemetery (4), Beck Cemetery (5), Burket Cemetery (6), Gray Memorial Field (7). Display/hide their locations on the map
Reservoirs: Tyrone Reservoir Number One (A), Tyrone Reservoir Number Two (B), Tipton Reservoir (C), Tyrone Reservoir (D), Bellwood Reservoir (E). Display/hide their locations on the map
Streams, rivers, and creeks: Warriors Mark Run (A), Sinking Run (B), Vanscoyoc Run (C), Hutchinson Run (D), Tipton Run (E), Three Springs Run (F), Sugar Run (G), Gypsy Run (H), Gensimore Run (I). Display/hide their locations on the map
2,067 married couples with children.
464 single-parent households (109 men, 355 women).
96.6% of residents of 16686 zip code speak English at home.
0.8% of residents speak Spanish at home (59% very well, 18% well, 23% not well).
2.2% of residents speak other Indo-European language at home (50% very well, 30% well, 16% not well, 4% not at all).
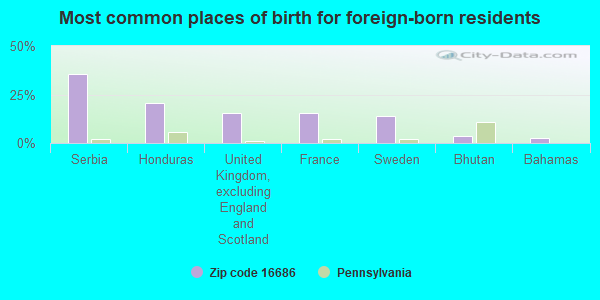
Foreign born population: 164 (1.3%) (66.1% of them are naturalized citizens)
This zip code:
1.3%
Whole state:
7.5%
35%Serbia
21%Honduras
15%United Kingdom, excluding England and Scotland
15%France
14%Sweden
4%Bhutan
2%Bahamas
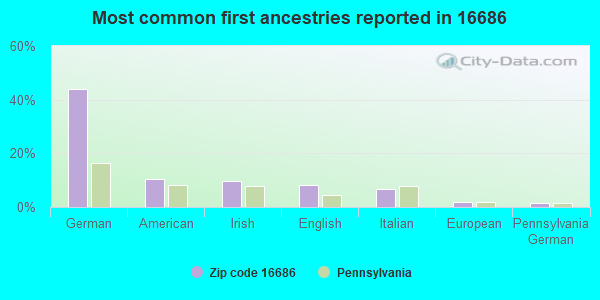
44%German
10%American
10%Irish
8%English
7%Italian
2%European
1%Pennsylvania German
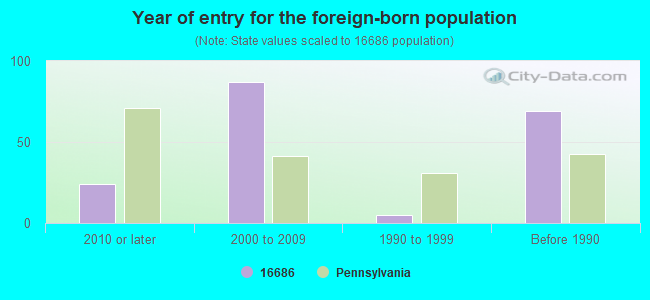
Year of entry for the foreign-born population
242010 or later
872000 to 2009
51990 to 1999
69Before 1990
Facilities with environmental interests located in this zip code:
ALBEMARLE TYRONE CHEM PLT (2 ADAMS AVENUE TYRONE INDUSTRIAL PARK in TYRONE, PA)
AIR SYNTHETIC MINOR (AIRS/AFS) (Integrated Compliance Information System) - ICIS-03-1988-0625, FORMAL ENFORCEMENT ACTION COMPLIANCE ACTIVITY (Tracking inspections of insecticide, fungicide, and rodenticide, and toxic substances) CRITERIA AND HAZARDOUS AIR POLLUTANT INVENTORY (Inventory of air pollution sources) STATE MASTER (Pennsylvania database) - AFS-54-1692118-1, AIR PROGRAM, RCRIS-PAD030069140, HAZARDOUS WASTE PROGRAM HAZARDOUS WASTE BIENNIAL REPORTER (Resource Conservation and Recovery Act (tracking hazardous waste)) Large Quantity Generators, more that 1000 kg of hazardous waste/month (Resource Conservation and Recovery Act (tracking hazardous waste)) - notification TRI REPORTER (Tracking of toxic chemicals releasing facilities) Business SIC classification: MEDICINAL CHEMICALS AND BOTANICAL PRODUCTS; PHARMACEUTICAL PREPARATIONS; CYCLIC ORGANIC CRUDES AND INTERMEDIATES, AND ORGANIC DYES AND PIGMENTS; INDUSTRIAL ORGANIC CHEMICALS Business NAICS classification: ALL OTHER BASIC ORGANIC CHEMICAL MANUFACTURING. Organizations: ALBEMARLE CORP (CONTACT/OPERATOR)
Alternative names: ALBEMARLE CORP., ALBEMARLE CORP., ALBEMARLE/TYRONE QUALITY CHEM, ALBERMARLE CORP, CHEMFIRST FINE CHEMICALS INC., QUALITY CHEMICALS INC, QUALITY CHEM PLT
ALBERT MICHAELS CONSERVATION INC (2055 COLUMBIA AVE in TYRONE, PA)
Large Quantity Generators, more that 1000 kg of hazardous waste/month (Resource Conservation and Recovery Act (tracking hazardous waste)) Organizations: ALBERTMICHAELS CONSERVATION INC (CONTACT/OPERATOR)
, CAREY GARMAN (CONTACT/OWNER)
ALBEMARLE CORP (TYRONE SITE in TYRONE, PA)
National Pollutant Discharge Elimination System NON-MAJOR (Tracking pollutant discharge elimination systems) - permit Business SIC classification: INDUSTRIAL ORGANIC CHEMICALS Alternative names: QUALITY CHEMICALS INC
ANDERS GARAGE (RD # 5, BOX 24A in TYRONE, PA)
AIR MINOR (AIRS/AFS) Business SIC classification: AUTOMOTIVE REPAIR SHOPS
Housing units lacking complete plumbing facilities: 2.8% Housing units lacking complete kitchen facilities: 6.9%
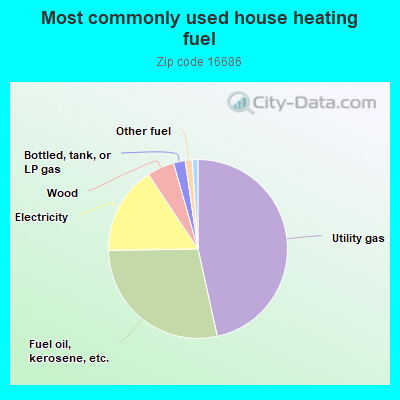
46.5%Utility gas
28.2%Fuel oil, kerosene, etc.
15.9%Electricity
4.9%Wood
2.1%Bottled, tank, or LP gas
1.3%Other fuel
1.0%Coal or coke
Population in 1990: 11,290. Population change in the 1990s: +1,736 (+15.4%).
Place of birth for U.S.-born residents:
This state: 11,405
Northeast: 211
Midwest: 367
South: 604
West: 162
70% of the 16686 zip code residents lived in the same house 5 years ago. Out of people who lived in different houses, 74% lived in this county. Out of people who lived in different counties, 50% lived in Pennsylvania.
91% of the 16686 zip code residents lived in the same house 1 year ago. Out of people who lived in different houses, 54% moved from this county. Out of people who lived in different houses, 42% moved from different county within same state. Out of people who lived in different houses, 3% moved from different state.
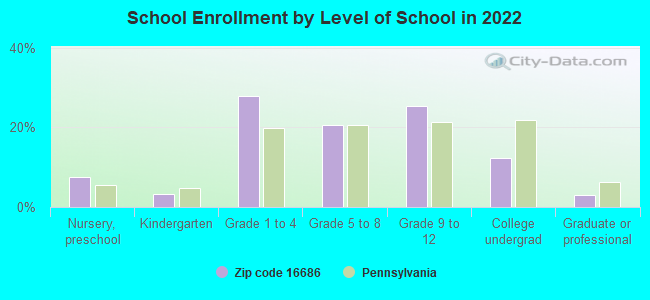
Private vs. public school enrollment:
Students in private schools in grades 1 to 8 (elementary and middle school): 255
Here:
19.6%
Pennsylvania:
15.7%
Students in private schools in grades 9 to 12 (high school): 102
Here:
14.8%
Pennsylvania:
13.4%
Students in private undergraduate colleges: 116
Here:
35.4%
Pennsylvania:
39.8%
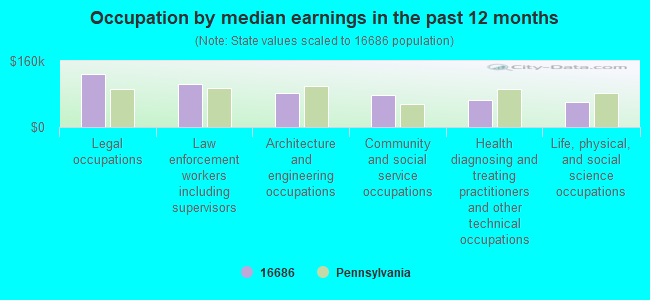
Occupation by median earnings in the past 12 months ($)
128,226Legal occupations
104,109Law enforcement workers including supervisors
81,422Architecture and engineering occupations
76,631Community and social service occupations
64,948Health diagnosing and treating practitioners and other technical occupations
61,730Life, physical, and social science occupations
Companies with federal contracts located in this zip code:
SNARSKI, JOHN (308 W 11ST 2ND FL in TYRONE, PA; small business) : $17,384 in 2 contractsin 2004
$8,692 with Army for Surveillance Services. Signed on 2004-05-19. Completion date: 2006-05-31.
$8,692 with U.S. Army Corps of Engineers - civil program financing only for Surveillance Services. Signed on 2004-05-19. Completion date: 2006-05-31.
LYKENS, GREGORY S (1114 LINCOLN AVE in TYRONE, PA; small business)
$6,400 with Army for Maintenance, Repair or Alteration of Real Property -- Miscellaneous Buildings. Signed on 2004-02-06. Completion date: 2004-03-06.
Top industries in this zip code by the number of employees in 2005:
Health Care and Social Assistance: Homes for the Elderly (100-249 employees: 1 establishment, 1-4 employees: 1 establishment)
Health Care and Social Assistance: Nursing Care Facilities (100-249: 1)
Health Care and Social Assistance: General Medical and Surgical Hospitals (100-249: 1)
Educational Services: Elementary and Secondary Schools (100-249: 1)
2005 - 2018 National Fire Incident Reporting System (NFIRS) incidents
According to the data from the years 2005 - 2018 the average number of fire incidents per year is 21. The highest number of reported fire incidents - 84 took place in 2017, and the least - 1 in 2005. The data has an increasing trend.
When looking into fire subcategories, the most reports belonged to: Structure Fires (48.8%), and Outside Fires (22.2%).
Fire incident types reported to NFIRS in Zip Code 16686
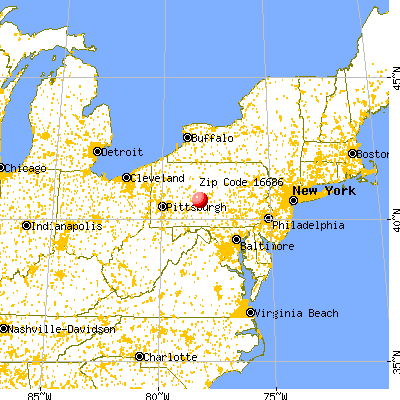


 Nearest zip codes: 16617, 16677, 16680, 16611, 16601, 16866.
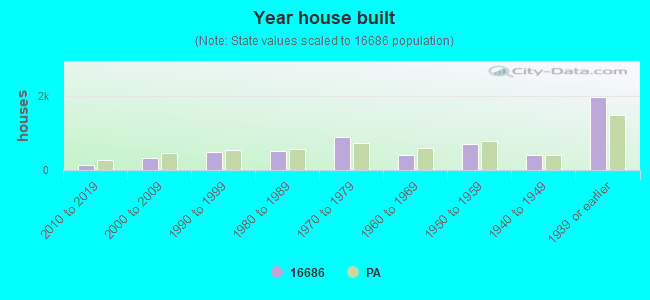


 According to the data from the years 2005 - 2018 the average number of fire incidents per year is 21. The highest number of reported fire incidents - 84 took place in 2017, and the least - 1 in 2005. The data has an increasing trend.
 When looking into fire subcategories, the most reports belonged to: Structure Fires (48.8%), and Outside Fires (22.2%).