Estimated zip code population in 2022: 1,828 Zip code population in 2010: 1,821 Zip code population in 2000: 1,936
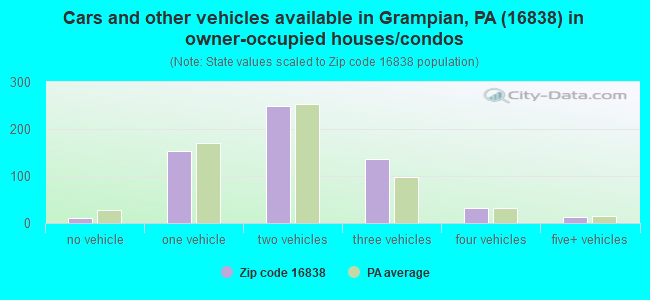
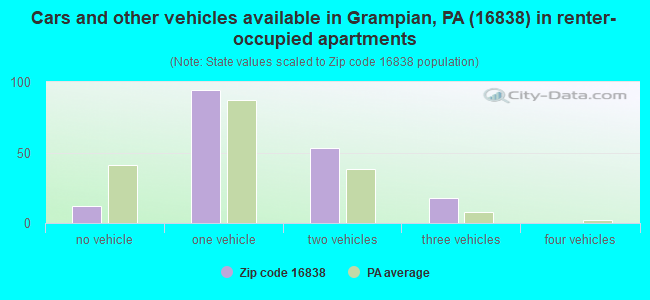
Houses and condos: 960 Renter-occupied apartments: 176
% of renters here:
23%
State:
31%
March 2022 cost of living index in zip code 16838: 91.2 (less than average, U.S. average is 100)
Land area: 40.9 sq. mi. Water area: 0.1 sq. mi.
Population density: 45 people per square mile
(very low).
OSM Map
General Map
Google Map
MSN Map
OSM Map
General Map
Google Map
MSN Map
OSM Map
General Map
Google Map
MSN Map
OSM Map
General Map
Google Map
MSN Map
Please wait while loading the map...
Real estate property taxes paid for housing units in 2022:
This zip code:
1.0% ($1,248)
Pennsylvania:
1.3% ($3,094)
Median real estate property taxes paid for housing units with mortgages in 2022: $1,488 (0.8%) Median real estate property taxes paid for housing units with no mortgage in 2022: $1,127 (1.1%)
Business Search- 14 Million verified businesses
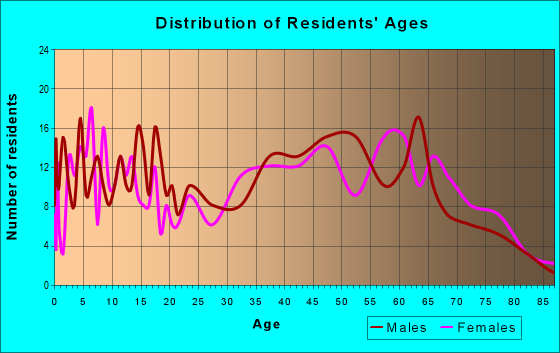
Males: 1,017
(55.6%)
Females: 811
(44.4%)
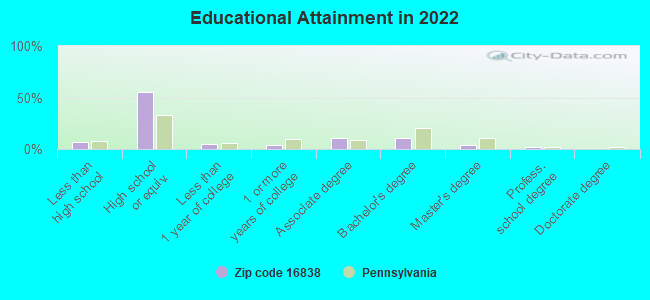
For population 25 years and over in 16838:
High school or higher: 92.8%
Bachelor's degree or higher: 17.4%
Graduate or professional degree: 6.6%
Unemployed: 6.1%
Mean travel time to work (commute): 26.7 minutes
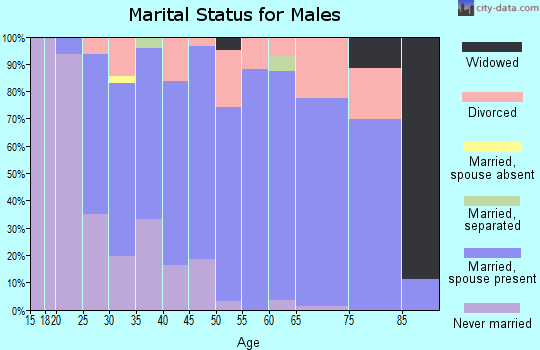
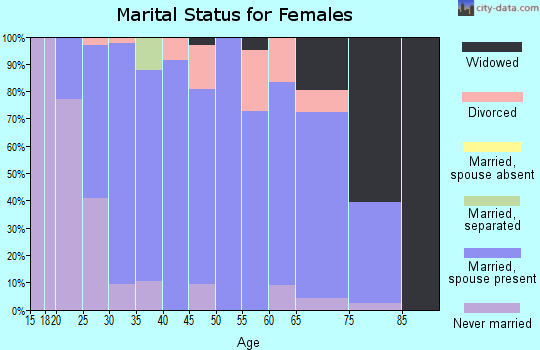
For population 15 years and over in 16838:
Never married: 23.1%
Now married: 57.6%
Separated: 5.1%
Widowed: 6.7%
Divorced: 7.6%
Zip code 16838 compared to state average:
Median house value below state average.
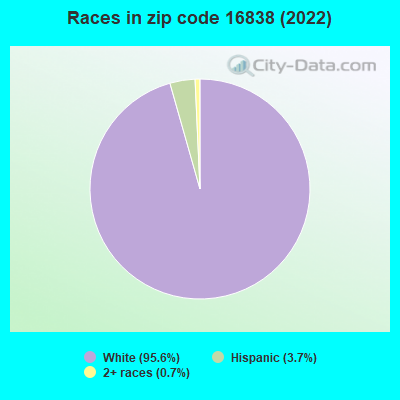
Black race population percentage significantly below state average.
Hispanic race population percentage below state average.
Median age above state average.
Foreign-born population percentage significantly below state average.
Length of stay since moving in significantly above state average.
Number of college students below state average.
Percentage of population with a bachelor's degree or higher below state average.
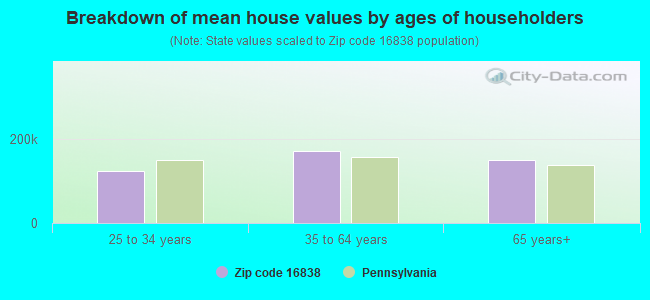
Estimated median house/condo value in 2022: $122,099
16838:
$122,099
Pennsylvania:
$245,500
According to our research of Pennsylvania and other state lists, there were 5 registered sex offenders living in 16838 zip code as of April 26, 2024. The ratio of all residents to sex offenders in zip code 16838 is 384 to 1.
Median resident age:
This zip code:
48.6 years
Pennsylvania median age:
40.9 years
Average household size:
This zip code:
2.4 people
Pennsylvania:
2.4 people
Averages for the 2020 tax year for zip code 16838, filed in 2021:
Average Adjusted Gross Income (AGI) in 2020: $50,334 (Individual Income Tax Returns)
Here:
$50,334
State:
$75,707
Salary/wage: $48,511 (reported on 75.9% of returns)
Here:
$48,511
State:
$62,806
(% of AGI for various income ranges: 1139.5% for AGIs below $25k, 3649.4% for AGIs $25k-50k, 5704.4% for AGIs $50k-75k, 8710.0% for AGIs $75k-100k, 15521.2% for AGIs $100k-200k)
Taxable interest for individuals: $612 (reported on 27.6% of returns)
This zip code:
$612
Pennsylvania:
$1,633
(% of AGI for various income ranges: 22.6% for AGIs below $25k, 40.6% for AGIs $25k-50k, 11.1% for AGIs $50k-75k, 14.3% for AGIs $75k-100k, 18.8% for AGIs $100k-200k)
Ordinary dividends: $1,329 (reported on 16.1% of returns)
Here:
$1,329
State:
$7,382
(% of AGI for various income ranges: 15.8% for AGIs below $25k, 31.2% for AGIs $25k-50k, 62.2% for AGIs $50k-75k, 58.8% for AGIs $100k-200k)
Net capital gain/loss in AGI: +$3,525 (reported on 9.2% of returns)
Here:
+$3,525
State:
+$23,522
(% of AGI for various income ranges: 48.9% for AGIs below $25k, 44.4% for AGIs $50k-75k, 186.2% for AGIs $100k-200k)
Profit/loss from business: +$9,000 (reported on 11.5% of returns)
Here:
+$9,000
State:
+$16,274
(% of AGI for various income ranges: 67.4% for AGIs below $25k, 166.5% for AGIs $25k-50k, 698.6% for AGIs $75k-100k)
Taxable individual retirement arrangement distribution: $11,164 (reported on 12.6% of returns)
16838:
$11,164
Pennsylvania:
$18,583
(% of AGI for various income ranges: 159.5% for AGIs below $25k, 217.6% for AGIs $25k-50k, 792.9% for AGIs $75k-100k)
Earned income credit: $1,662 (reported on 14.9% of returns)
Here:
$1,662
State:
$2,100
(% of AGI for various income ranges: 63.2% for AGIs below $25k, 56.5% for AGIs $25k-50k)
Percentage of individuals using paid preparers for their 2020 taxes: 93.1%
Here:
93%
State:
92%
(% for various income ranges: 90.6% for AGIs below $25k, 95.5% for AGIs $25k-50k, 91.7% for AGIs $50k-75k, 100.0% for AGIs $75k-100k, 91.7% for AGIs $100k-200k)
Averages for the 2012 tax year for zip code 16838, filed in 2013:
Average Adjusted Gross Income (AGI) in 2012: $41,484 (Individual Income Tax Returns)
Here:
$41,484
State:
$61,346
Salary/wage: $38,909 (reported on 81.9% of returns)
Here:
$38,909
State:
$51,902
(% of AGI for various income ranges: 68.2% for AGIs below $25k, 76.5% for AGIs $25k-50k, 80.5% for AGIs $50k-75k, 83.0% for AGIs $75k-100k, 72.5% for AGIs $100k-200k)
Taxable interest for individuals: $670 (reported on 36.1% of returns)
This zip code:
$670
Pennsylvania:
$1,588
(% of AGI for various income ranges: 1.7% for AGIs below $25k, 1.0% for AGIs $25k-50k, 0.1% for AGIs $50k-75k, 0.3% for AGIs $75k-100k, 0.2% for AGIs $100k-200k)
Ordinary dividends: $907 (reported on 18.1% of returns)
Here:
$907
State:
$5,827
(% of AGI for various income ranges: 0.6% for AGIs below $25k, 0.2% for AGIs $25k-50k, 0.4% for AGIs $50k-75k, 0.4% for AGIs $75k-100k, 0.5% for AGIs $100k-200k)
Net capital gain/loss in AGI: +$5,740 (reported on 12.0% of returns)
Here:
+$5,740
State:
+$14,495
(% of AGI for various income ranges: 1.2% for AGIs below $25k, 0.4% for AGIs $25k-50k, 6.8% for AGIs $75k-100k)
Profit/loss from business: +$9,873 (reported on 13.3% of returns)
Here:
+$9,873
State:
+$16,268
(% of AGI for various income ranges: 5.5% for AGIs below $25k, 8.5% for AGIs $25k-50k, 2.4% for AGIs $75k-100k)
Taxable individual retirement arrangement distribution: $7,040 (reported on 12.0% of returns)
16838:
$7,040
Pennsylvania:
$14,550
(% of AGI for various income ranges: 4.7% for AGIs below $25k, 3.9% for AGIs $25k-50k, 2.6% for AGIs $75k-100k)
Total itemized deductions: $18,220 (20% of AGI, reported on 12.0% of returns)
Here:
$18,220
State:
$23,538
Here:
20.2% of AGI
State:
18.4% of AGI
(% of AGI for various income ranges: 8.3% for AGIs $25k-50k, 5.6% for AGIs $75k-100k, 10.3% for AGIs $100k-200k)
Charity contributions: $4,057 (reported on 8.4% of returns)
Here:
$4,057
State:
$4,025
Taxes paid: $5,250 (reported on 12.0% of returns)
16838:
$5,250
State:
$9,982
(% of AGI for various income ranges: 1.8% for AGIs $25k-50k, 1.6% for AGIs $75k-100k, 3.7% for AGIs $100k-200k)
Earned income credit: $1,638 (reported on 19.3% of returns)
Here:
$1,638
State:
$2,106
(% of AGI for various income ranges: 4.2% for AGIs below $25k, 1.0% for AGIs $25k-50k)
Percentage of individuals using paid preparers for their 2012 taxes: 56.6%
Here:
57%
State:
53%
(% for various income ranges: 50.0% for AGIs below $25k, 59.1% for AGIs $25k-50k, 58.3% for AGIs $50k-75k, 62.5% for AGIs $75k-100k, 80.0% for AGIs $100k-200k)
Averages for the 2004 tax year for zip code 16838, filed in 2005:
Average Adjusted Gross Income (AGI) in 2004: $30,945 (Individual Income Tax Returns)
Here:
$30,945
State:
$48,049
Salary/wage: $28,629 (reported on 85.9% of returns)
Here:
$28,629
State:
$42,646
(% of AGI for various income ranges: 133.0% for AGIs below $10k, 77.0% for AGIs $10k-25k, 83.7% for AGIs $25k-50k, 79.6% for AGIs $50k-75k, 79.3% for AGIs $75k-100k, 61.3% for AGIs over 100k)
Taxable interest for individuals: $983 (reported on 41.6% of returns)
This zip code:
$983
Pennsylvania:
$1,657
(% of AGI for various income ranges: 11.9% for AGIs below $10k, 2.5% for AGIs $10k-25k, 1.1% for AGIs $25k-50k, 0.9% for AGIs $50k-75k, 0.3% for AGIs $75k-100k, 0.5% for AGIs over 100k)
Taxable dividends: $1,080 (reported on 21.7% of returns)
Here:
$1,080
State:
$3,566
(% of AGI for various income ranges: 4.0% for AGIs below $10k, 0.6% for AGIs $10k-25k, 0.3% for AGIs $25k-50k, 0.5% for AGIs $50k-75k, 1.4% for AGIs $75k-100k, 1.5% for AGIs over 100k)
Net capital gain/loss: +$3,233 (reported on 15.4% of returns)
Here:
+$3,233
State:
+$9,716
(% of AGI for various income ranges: -1.1% for AGIs below $10k, -0.2% for AGIs $10k-25k, 0.0% for AGIs $25k-50k, 1.5% for AGIs $50k-75k, 1.0% for AGIs $75k-100k, 10.0% for AGIs over 100k)
Profit/loss from business: +$8,057 (reported on 14.1% of returns)
Here:
+$8,057
State:
+$14,267
(% of AGI for various income ranges: -4.9% for AGIs below $10k, 5.4% for AGIs $10k-25k, 5.3% for AGIs $25k-50k, 4.8% for AGIs $50k-75k)
IRA payment deduction: $3,273 (reported on 3.8% of returns)
16838:
$3,273
Pennsylvania:
$2,903
Total itemized deductions: $13,811 (21% of AGI, reported on 12.8% of returns)
Here:
$13,811
State:
$18,804
Here:
21.1% of AGI
State:
19.5% of AGI
(% of AGI for various income ranges: 4.1% for AGIs $10k-25k, 4.1% for AGIs $25k-50k, 6.5% for AGIs $50k-75k, 8.6% for AGIs $75k-100k, 8.2% for AGIs over 100k)
Charity contributions deductions: $2,815 (4% of AGI, reported on 10.6% of returns)
Here:
$2,815
State:
$3,337
Here:
4.2% of AGI
State:
3.3% of AGI
(% of AGI for various income ranges: 0.5% for AGIs $10k-25k, 0.3% for AGIs $25k-50k, 1.2% for AGIs $50k-75k, 2.1% for AGIs $75k-100k, 1.7% for AGIs over 100k)
Total tax: $3,718 (reported on 68.5% of returns)
16838:
$3,718
State:
$8,008
(% of AGI for various income ranges: 4.2% for AGIs below $10k, 4.0% for AGIs $10k-25k, 6.3% for AGIs $25k-50k, 8.7% for AGIs $50k-75k, 11.3% for AGIs $75k-100k, 15.6% for AGIs over 100k)
Earned income credit: $1,516 (reported on 18.4% of returns)
Here:
$1,516
State:
$1,643
Percentage of individuals using paid preparers for their 2004 taxes: 62.8%
Here:
63%
State:
56%
(% for various income ranges: 56.0% for AGIs below $10k, 63.7% for AGIs $10k-25k, 64.8% for AGIs $25k-50k, 67.5% for AGIs $50k-75k, 76.7% for AGIs $75k-100k, 45.5% for AGIs over 100k)
Household received Food Stamps/SNAP in the past 12 months: 162 Household did not receive Food Stamps/SNAP in the past 12 months: 615
Women who had a birth in the past 12 months: 15 (13 now married, 2 unmarried) Women who did not have a birth in the past 12 months: 335 (203 now married, 129 unmarried)
Housing units in zip code 16838 with a mortgage: 252 (30 second mortgage, 29 both second mortgage and home equity loan) Houses without a mortgage: 70
Median monthly owner costs for units with a mortgage: $1,058 Median monthly owner costs for units without a mortgage: $472
Residents with income below the poverty level in 2022:
This zip code:
21.9%
Whole state:
11.8%
Residents with income below 50% of the poverty level in 2022:
This zip code:
11.0%
Whole state:
6.1%
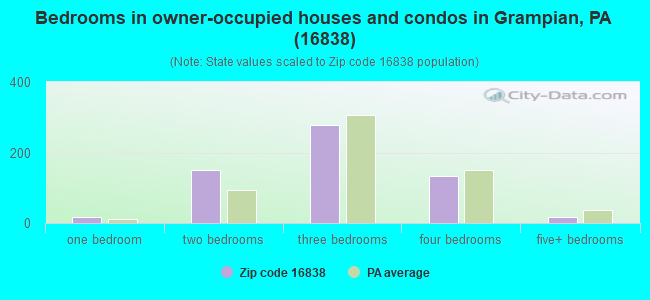
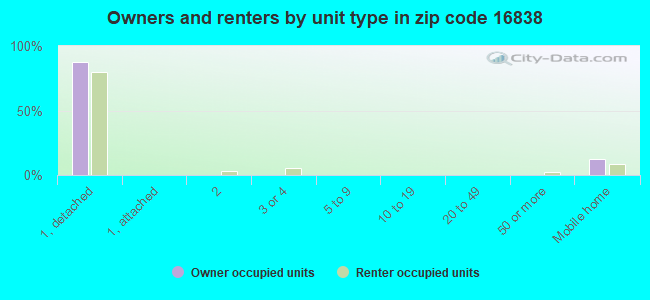
Median number of rooms in houses and condos:
Here:
6.3
State:
6.8
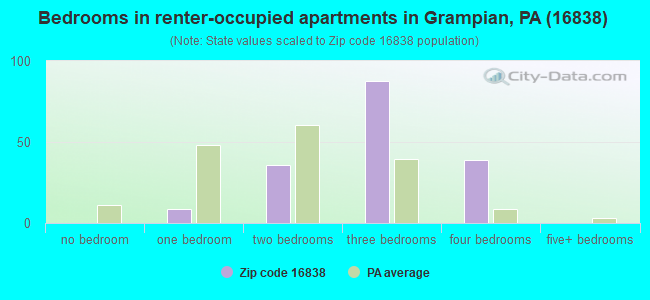
Median number of rooms in apartments:
Here:
5.8
State:
4.3
Notable locations in this zip code not listed on our city pages
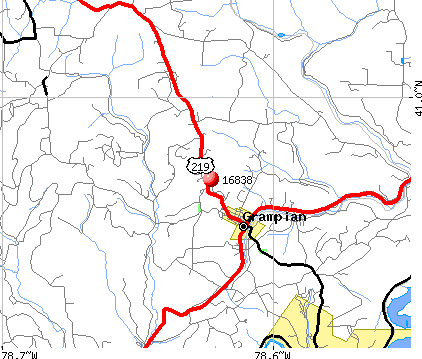
Notable locations in zip code 16838: Belfast Number 2 Mine Station (A), Grampian - Penn - Bloom Volunteer Fire Company Station 9 (B). Display/hide their locations on the map
Streams, rivers, and creeks: Panther Run (A), Hughey Run (B), Fenton Run (C), Daily Run (D), Little Anderson Creek (E), Rock Run (F). Display/hide their locations on the map
Size of family households: 248 2-persons, 149 3-persons, 113 4-persons, 12 5-persons, 6 6-persons, 3 7-or-more-persons
Size of nonfamily households: 204 1-person, 32 2-persons, 1 3-persons
215 married couples with children.
95 single-parent households (19 men, 76 women).
95.1% of residents of 16838 zip code speak English at home.
4.0% of residents speak Spanish at home (96% very well, 4% not well).
0.3% of residents speak other Indo-European language at home (67% very well, 33% well).
0.1% of residents speak Asian or Pacific Island language at home (100% very well).
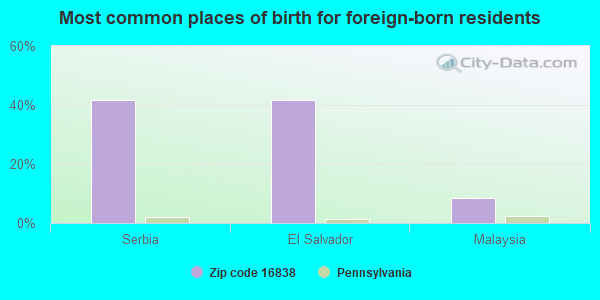
Foreign born population: 12 (0.7%) (100.0% of them are naturalized citizens)
This zip code:
0.7%
Whole state:
7.5%
42%Serbia
42%El Salvador
8%Malaysia
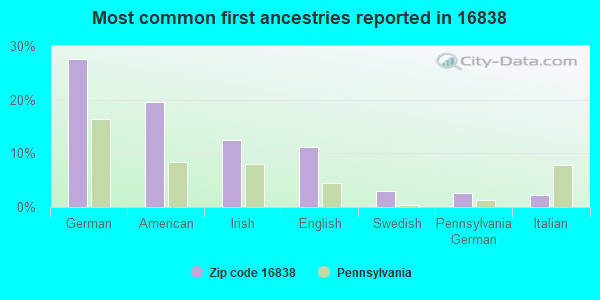
28%German
20%American
12%Irish
11%English
3%Swedish
3%Pennsylvania German
2%Italian
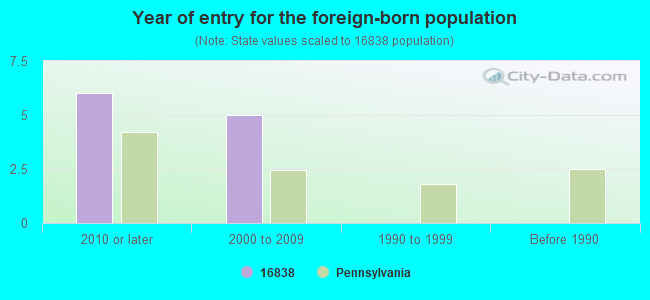
Year of entry for the foreign-born population
62010 or later
52000 to 2009
01990 to 1999
0Before 1990
Facilities with environmental interests located in this zip code:
AUTO SPECIALITIES (RT 219 N 3 BLOCKS FROM in GRAMPIAN, PA)
Conditionally Exempt Small Quantity Generators, less than 100 kg/month of hazardous waste (Resource Conservation and Recovery Act (tracking hazardous waste)) - notification Organizations: PETRACCA JOSEPH (CONTACT/OWNER)
Housing units lacking complete plumbing facilities: 5.0% Housing units lacking complete kitchen facilities: 1.8%
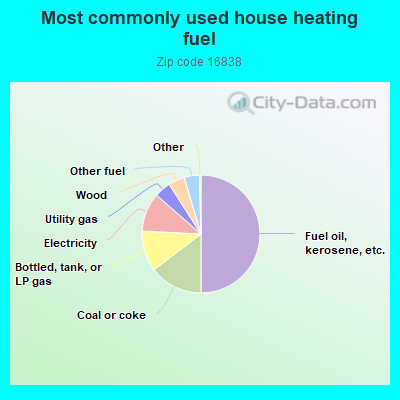
50.2%Fuel oil, kerosene, etc.
14.7%Coal or coke
11.2%Bottled, tank, or LP gas
10.7%Electricity
4.5%Utility gas
4.5%Wood
4.2%Other fuel
Population in 1990: 3,187.
Place of birth for U.S.-born residents:
This state: 1,601
Northeast: 115
Midwest: 16
South: 33
West: 37
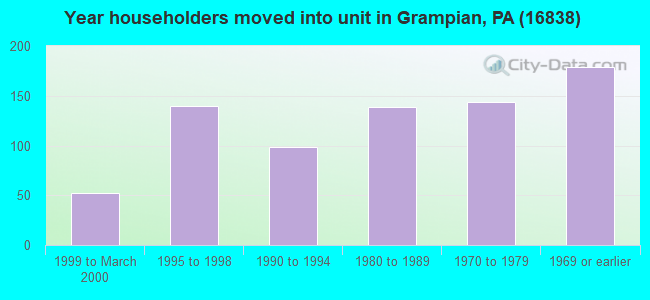
75% of the 16838 zip code residents lived in the same house 5 years ago. Out of people who lived in different houses, 86% lived in this county. Out of people who lived in different counties, 50% lived in Pennsylvania.
94% of the 16838 zip code residents lived in the same house 1 year ago. Out of people who lived in different houses, 63% moved from this county. Out of people who lived in different houses, 37% moved from different county within same state.
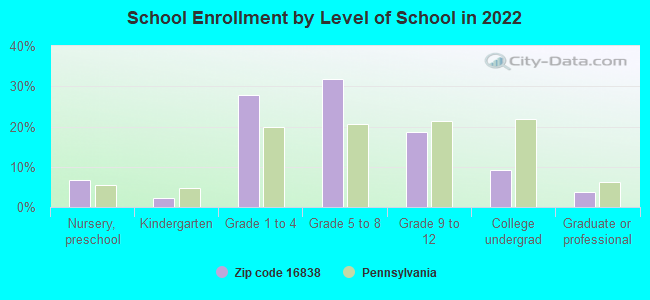
Private vs. public school enrollment:
Students in private schools in grades 1 to 8 (elementary and middle school): 19
Here:
14.5%
Pennsylvania:
15.7%
Students in private schools in grades 9 to 12 (high school): 2
Here:
5.1%
Pennsylvania:
13.4%
Students in private undergraduate colleges: 2
Here:
14.2%
Pennsylvania:
39.8%
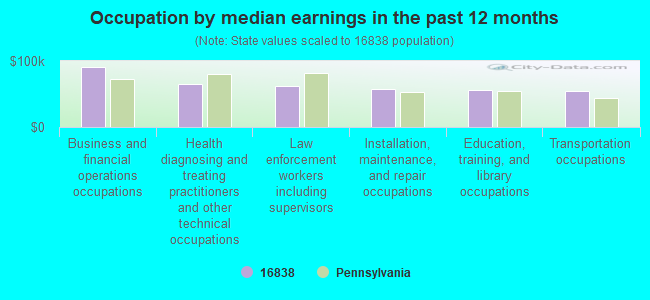
Occupation by median earnings in the past 12 months ($)
90,897Business and financial operations occupations
65,387Health diagnosing and treating practitioners and other technical occupations
61,524Law enforcement workers including supervisors
57,468Installation, maintenance, and repair occupations
56,304Education, training, and library occupations
55,257Transportation occupations
Top industries in this zip code by the number of employees in 2005:
Professional, Scientific, and Technical Services: Testing Laboratories (20-49: 1)
Utilities: Sewage Treatment Facilities (5-9: 1)
Wholesale Trade: Industrial Machinery and Equipment Merchant Wholesalers (5-9: 1)
Real Estate and Rental and Leasing: Lessors of Nonresidential Buildings (except Miniwarehouses) (5-9: 1)
Other Services (except Public Administration): Religious Organizations (1-4: 3)
Fatal accident statistics in 2013:
Fatal accident count: 1
Vehicles involved in fatal accidents: 1
Fatal accidents caused by drunken drivers: 0
Fatalities: 1
Persons involved in fatal accidents: 1
Pedestrians involved in fatal accidents: 0
Fatal accident statistics in 2012:
Fatal accident count: 1
Vehicles involved in fatal accidents: 1
Fatal accidents caused by drunken drivers: 1
Fatalities: 1
Persons involved in fatal accidents: 1
Pedestrians involved in fatal accidents: 0
2005 - 2018 National Fire Incident Reporting System (NFIRS) incidents
According to the data from the years 2005 - 2018 the average number of fires per year is 7. The highest number of fires - 16 took place in 2016, and the least - 0 in 2006. The data has a rising trend.
When looking into fire subcategories, the most reports belonged to: Structure Fires (73.3%), and Outside Fires (19.8%).
Fire incident types reported to NFIRS in Zip Code 16838
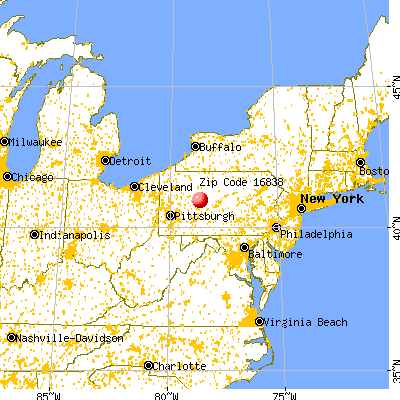


 Nearest zip codes: 15848, 15856, 16833, 15757, 15801, 15866.
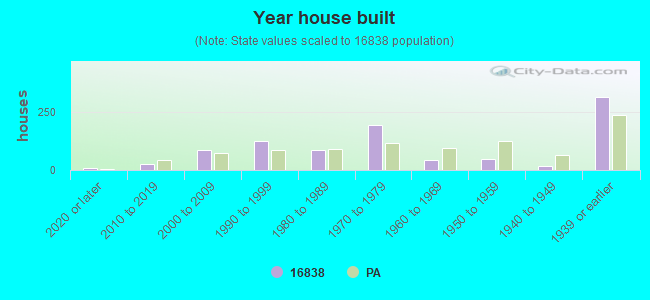


 According to the data from the years 2005 - 2018 the average number of fires per year is 7. The highest number of fires - 16 took place in 2016, and the least - 0 in 2006. The data has a rising trend.
 When looking into fire subcategories, the most reports belonged to: Structure Fires (73.3%), and Outside Fires (19.8%).