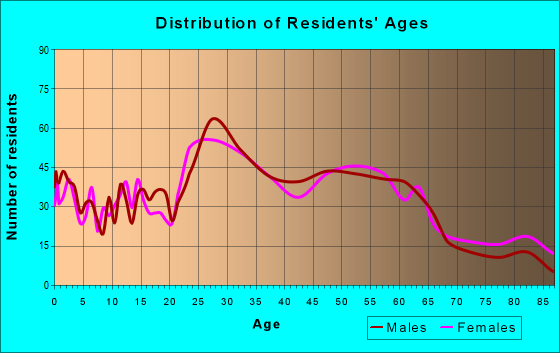
Estimated zip code population in 2022: 5,850 Zip code population in 2010: 5,957 Zip code population in 2000: 5,682
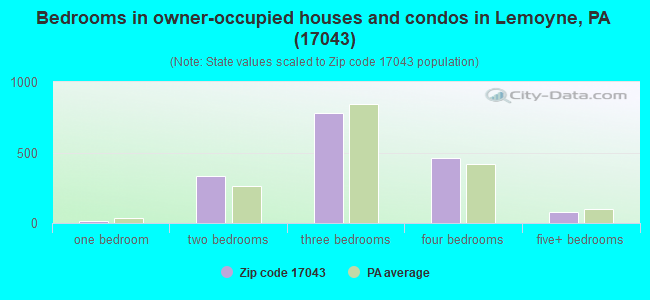
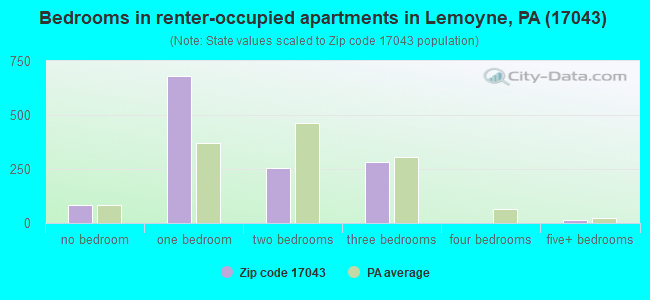
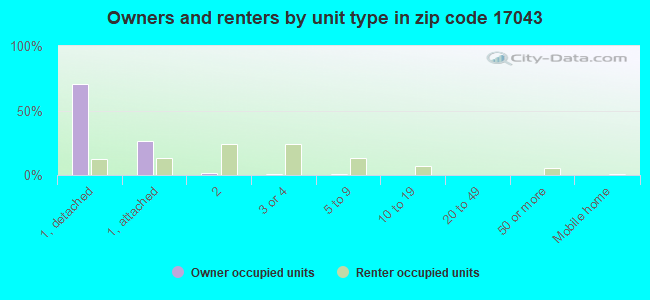
Houses and condos: 3,018 Renter-occupied apartments: 1,299
% of renters here:
44%
State:
31%
March 2022 cost of living index in zip code 17043: 95.6 (near average, U.S. average is 100)
Land area: 2.0 sq. mi. Water area: 0.0 sq. mi.
Population density: 2,894 people per square mile
(average).
OSM Map
General Map
Google Map
MSN Map
OSM Map
General Map
Google Map
MSN Map
OSM Map
General Map
Google Map
MSN Map
OSM Map
General Map
Google Map
MSN Map
Please wait while loading the map...
Real estate property taxes paid for housing units in 2022:
This zip code:
1.3% ($2,676)
Pennsylvania:
1.3% ($3,094)
Median real estate property taxes paid for housing units with mortgages in 2022: $2,436 (1.2%) Median real estate property taxes paid for housing units with no mortgage in 2022: $3,370 (1.4%)
Averages for the 2020 tax year for zip code 17043, filed in 2021:
Average Adjusted Gross Income (AGI) in 2020: $71,473 (Individual Income Tax Returns)
Here:
$71,473
State:
$75,707
Salary/wage: $52,545 (reported on 81.6% of returns)
Here:
$52,545
State:
$62,806
(% of AGI for various income ranges: 1113.5% for AGIs below $25k, 3630.4% for AGIs $25k-50k, 6407.1% for AGIs $50k-75k, 8335.5% for AGIs $75k-100k, 17651.7% for AGIs $100k-200k, 103246.7% for AGIs over 200k)
Taxable interest for individuals: $2,746 (reported on 27.7% of returns)
This zip code:
$2,746
Pennsylvania:
$1,633
(% of AGI for various income ranges: 13.8% for AGIs below $25k, 23.6% for AGIs $25k-50k, 22.0% for AGIs $50k-75k, 83.5% for AGIs $75k-100k, 108.9% for AGIs $100k-200k, 6156.7% for AGIs over 200k)
Ordinary dividends: $11,816 (reported on 18.4% of returns)
Here:
$11,816
State:
$7,382
(% of AGI for various income ranges: 29.2% for AGIs below $25k, 31.3% for AGIs $25k-50k, 66.0% for AGIs $50k-75k, 230.0% for AGIs $75k-100k, 742.2% for AGIs $100k-200k, 16250.0% for AGIs over 200k)
Net capital gain/loss in AGI: +$34,271 (reported on 16.3% of returns)
Here:
+$34,271
State:
+$23,522
(% of AGI for various income ranges: 8.3% for AGIs below $25k, 25.3% for AGIs $25k-50k, 53.3% for AGIs $50k-75k, 166.5% for AGIs $75k-100k, 735.0% for AGIs $100k-200k, 56736.7% for AGIs over 200k)
Profit/loss from business: +$16,163 (reported on 13.4% of returns)
Here:
+$16,163
State:
+$16,274
(% of AGI for various income ranges: 88.2% for AGIs below $25k, 138.4% for AGIs $25k-50k, 122.7% for AGIs $50k-75k, 420.0% for AGIs $75k-100k, 555.6% for AGIs $100k-200k, 10773.3% for AGIs over 200k)
Taxable individual retirement arrangement distribution: $26,438 (reported on 8.5% of returns)
17043:
$26,438
Pennsylvania:
$18,583
(% of AGI for various income ranges: 36.2% for AGIs below $25k, 59.5% for AGIs $25k-50k, 164.0% for AGIs $50k-75k, 372.0% for AGIs $75k-100k, 910.6% for AGIs $100k-200k, 12596.7% for AGIs over 200k)
Self-employed (Keogh) retirement plans: $38,050 (reported on 0.6% of returns)
17043:
$38,050
Pennsylvania:
$25,407
(% of AGI for various income ranges: 422.8% for AGIs $100k-200k)
Total itemized deductions: $36,391 (reported on 6.7% of returns)
Here:
$36,391
State:
$34,850
(% of AGI for various income ranges: 87.5% for AGIs $25k-50k, 202.2% for AGIs $50k-75k, 504.0% for AGIs $75k-100k, 990.6% for AGIs $100k-200k, 13083.3% for AGIs over 200k)
Charity contributions: $13,489 (reported on 5.2% of returns)
Here:
$13,489
State:
$12,392
(% of AGI for various income ranges: 16.9% for AGIs $25k-50k, 45.5% for AGIs $75k-100k, 219.4% for AGIs $100k-200k, 5993.3% for AGIs over 200k)
Taxes paid: $8,396 (reported on 6.7% of returns)
17043:
$8,396
State:
$8,200
(% of AGI for various income ranges: 25.5% for AGIs $25k-50k, 33.6% for AGIs $50k-75k, 101.5% for AGIs $75k-100k, 279.4% for AGIs $100k-200k, 2856.7% for AGIs over 200k)
Earned income credit: $1,890 (reported on 14.0% of returns)
Here:
$1,890
State:
$2,100
(% of AGI for various income ranges: 68.1% for AGIs below $25k, 49.1% for AGIs $25k-50k)
Percentage of individuals using paid preparers for their 2020 taxes: 91.5%
Here:
92%
State:
92%
(% for various income ranges: 90.7% for AGIs below $25k, 91.6% for AGIs $25k-50k, 91.7% for AGIs $50k-75k, 93.1% for AGIs $75k-100k, 91.2% for AGIs $100k-200k, 93.8% for AGIs over 200k)
Averages for the 2012 tax year for zip code 17043, filed in 2013:
Average Adjusted Gross Income (AGI) in 2012: $85,084 (Individual Income Tax Returns)
Here:
$85,084
State:
$61,346
Salary/wage: $48,629 (reported on 83.2% of returns)
Here:
$48,629
State:
$51,902
(% of AGI for various income ranges: 74.5% for AGIs below $25k, 85.0% for AGIs $25k-50k, 74.6% for AGIs $50k-75k, 74.3% for AGIs $75k-100k, 64.7% for AGIs $100k-200k, 23.9% for AGIs over 200k)
Taxable interest for individuals: $4,260 (reported on 33.8% of returns)
This zip code:
$4,260
Pennsylvania:
$1,588
(% of AGI for various income ranges: 1.2% for AGIs below $25k, 0.6% for AGIs $25k-50k, 0.6% for AGIs $50k-75k, 0.9% for AGIs $75k-100k, 1.4% for AGIs $100k-200k, 2.4% for AGIs over 200k)
Ordinary dividends: $13,744 (reported on 20.9% of returns)
Here:
$13,744
State:
$5,827
(% of AGI for various income ranges: 1.6% for AGIs below $25k, 0.8% for AGIs $25k-50k, 1.2% for AGIs $50k-75k, 2.3% for AGIs $75k-100k, 3.0% for AGIs $100k-200k, 4.8% for AGIs over 200k)
Net capital gain/loss in AGI: +$24,377 (reported on 15.6% of returns)
Here:
+$24,377
State:
+$14,495
(% of AGI for various income ranges: 0.3% for AGIs $25k-50k, 0.1% for AGIs $75k-100k, 2.1% for AGIs $100k-200k, 7.9% for AGIs over 200k)
Profit/loss from business: +$17,954 (reported on 11.5% of returns)
Here:
+$17,954
State:
+$16,268
(% of AGI for various income ranges: 4.7% for AGIs below $25k, 2.0% for AGIs $25k-50k, 3.4% for AGIs $50k-75k, 2.1% for AGIs $75k-100k, 3.0% for AGIs $100k-200k, 2.0% for AGIs over 200k)
Taxable individual retirement arrangement distribution: $17,986 (reported on 10.3% of returns)
17043:
$17,986
Pennsylvania:
$14,550
(% of AGI for various income ranges: 2.2% for AGIs below $25k, 1.2% for AGIs $25k-50k, 2.5% for AGIs $50k-75k, 3.4% for AGIs $75k-100k, 6.7% for AGIs $100k-200k, 1.3% for AGIs over 200k)
Self-employment retirement plans: $30,767 (reported on 0.9% of returns)
17043:
$30,767
Pennsylvania:
$20,922
(% of AGI for various income ranges: 3.2% for AGIs $100k-200k)
Total itemized deductions: $30,566 (13% of AGI, reported on 25.3% of returns)
Here:
$30,566
State:
$23,538
Here:
12.6% of AGI
State:
18.4% of AGI
(% of AGI for various income ranges: 5.1% for AGIs below $25k, 6.5% for AGIs $25k-50k, 9.2% for AGIs $50k-75k, 10.2% for AGIs $75k-100k, 13.6% for AGIs $100k-200k, 9.1% for AGIs over 200k)
Charity contributions: $7,912 (reported on 20.3% of returns)
Here:
$7,912
State:
$4,025
(% of AGI for various income ranges: 0.4% for AGIs below $25k, 0.6% for AGIs $25k-50k, 1.1% for AGIs $50k-75k, 1.4% for AGIs $75k-100k, 2.6% for AGIs $100k-200k, 2.4% for AGIs over 200k)
Taxes paid: $11,548 (reported on 25.0% of returns)
17043:
$11,548
State:
$9,982
(% of AGI for various income ranges: 1.0% for AGIs below $25k, 1.7% for AGIs $25k-50k, 3.1% for AGIs $50k-75k, 3.7% for AGIs $75k-100k, 5.8% for AGIs $100k-200k, 3.6% for AGIs over 200k)
Earned income credit: $1,784 (reported on 15.0% of returns)
Here:
$1,784
State:
$2,106
(% of AGI for various income ranges: 4.1% for AGIs below $25k, 0.7% for AGIs $25k-50k)
Percentage of individuals using paid preparers for their 2012 taxes: 45.3%
Here:
45%
State:
53%
(% for various income ranges: 39.4% for AGIs below $25k, 42.5% for AGIs $25k-50k, 48.9% for AGIs $50k-75k, 50.0% for AGIs $75k-100k, 59.1% for AGIs $100k-200k, 78.6% for AGIs over 200k)
Averages for the 2004 tax year for zip code 17043, filed in 2005:
Average Adjusted Gross Income (AGI) in 2004: $60,018 (Individual Income Tax Returns)
Here:
$60,018
State:
$48,049
Salary/wage: $46,955 (reported on 82.9% of returns)
Here:
$46,955
State:
$42,646
(% of AGI for various income ranges: 86.2% for AGIs below $10k, 76.1% for AGIs $10k-25k, 84.0% for AGIs $25k-50k, 82.6% for AGIs $50k-75k, 75.1% for AGIs $75k-100k, 50.1% for AGIs over 100k)
Taxable interest for individuals: $3,314 (reported on 45.9% of returns)
This zip code:
$3,314
Pennsylvania:
$1,657
(% of AGI for various income ranges: 5.6% for AGIs below $10k, 2.2% for AGIs $10k-25k, 1.4% for AGIs $25k-50k, 1.0% for AGIs $50k-75k, 1.6% for AGIs $75k-100k, 3.4% for AGIs over 100k)
Taxable dividends: $7,707 (reported on 26.0% of returns)
Here:
$7,707
State:
$3,566
(% of AGI for various income ranges: 8.1% for AGIs below $10k, 1.4% for AGIs $10k-25k, 0.9% for AGIs $25k-50k, 1.3% for AGIs $50k-75k, 2.4% for AGIs $75k-100k, 5.1% for AGIs over 100k)
Net capital gain/loss: +$20,919 (reported on 18.9% of returns)
Here:
+$20,919
State:
+$9,716
(% of AGI for various income ranges: 0.8% for AGIs below $10k, 0.4% for AGIs $10k-25k, 0.1% for AGIs $25k-50k, 0.9% for AGIs $50k-75k, 1.0% for AGIs $75k-100k, 12.1% for AGIs over 100k)
Profit/loss from business: +$11,599 (reported on 9.8% of returns)
Here:
+$11,599
State:
+$14,267
(% of AGI for various income ranges: -6.0% for AGIs below $10k, 3.4% for AGIs $10k-25k, 1.1% for AGIs $25k-50k, 1.5% for AGIs $50k-75k, 1.0% for AGIs $75k-100k, 2.3% for AGIs over 100k)
IRA payment deduction: $2,603 (reported on 2.3% of returns)
17043:
$2,603
Pennsylvania:
$2,903
(% of AGI for various income ranges: 0.1% for AGIs $10k-25k, 0.1% for AGIs $25k-50k, 0.2% for AGIs $50k-75k, 0.1% for AGIs over 100k)
Self-employed pension: $22,677 (reported on 0.9% of returns)
Here:
$22,677
Pennsylvania:
$14,674
Total itemized deductions: $28,900 (19% of AGI, reported on 25.7% of returns)
Here:
$28,900
State:
$18,804
Here:
18.5% of AGI
State:
19.5% of AGI
(% of AGI for various income ranges: 12.4% for AGIs below $10k, 4.5% for AGIs $10k-25k, 6.9% for AGIs $25k-50k, 10.8% for AGIs $50k-75k, 12.4% for AGIs $75k-100k, 15.8% for AGIs over 100k)
Charity contributions deductions: $6,660 (5% of AGI, reported on 21.7% of returns)
Here:
$6,660
State:
$3,337
Here:
4.6% of AGI
State:
3.3% of AGI
(% of AGI for various income ranges: 0.5% for AGIs $10k-25k, 0.8% for AGIs $25k-50k, 1.4% for AGIs $50k-75k, 2.2% for AGIs $75k-100k, 3.6% for AGIs over 100k)
Total tax: $12,027 (reported on 80.7% of returns)
17043:
$12,027
State:
$8,008
(% of AGI for various income ranges: 2.2% for AGIs below $10k, 5.0% for AGIs $10k-25k, 8.3% for AGIs $25k-50k, 10.1% for AGIs $50k-75k, 11.6% for AGIs $75k-100k, 23.0% for AGIs over 100k)
Earned income credit: $1,491 (reported on 10.3% of returns)
Here:
$1,491
State:
$1,643
Percentage of individuals using paid preparers for their 2004 taxes: 47.4%
Here:
47%
State:
56%
(% for various income ranges: 42.1% for AGIs below $10k, 48.3% for AGIs $10k-25k, 40.7% for AGIs $25k-50k, 52.9% for AGIs $50k-75k, 50.3% for AGIs $75k-100k, 73.1% for AGIs over 100k)
Household received Food Stamps/SNAP in the past 12 months: 294 Household did not receive Food Stamps/SNAP in the past 12 months: 2,658
Women who had a birth in the past 12 months: 120 (73 now married, 44 unmarried) Women who did not have a birth in the past 12 months: 1,274 (522 now married, 751 unmarried)
Housing units in zip code 17043 with a mortgage: 1,122 (117 second mortgage, 117 both second mortgage and home equity loan) Houses without a mortgage: 60
Median monthly owner costs for units with a mortgage: $1,473 Median monthly owner costs for units without a mortgage: $687
Residents with income below the poverty level in 2022:
This zip code:
11.1%
Whole state:
11.8%
Residents with income below 50% of the poverty level in 2022:
This zip code:
7.1%
Whole state:
6.1%
Median number of rooms in houses and condos:
Here:
6.5
State:
6.8
Median number of rooms in apartments:
Here:
4.2
State:
4.3
Notable locations in this zip code not listed on our city pages
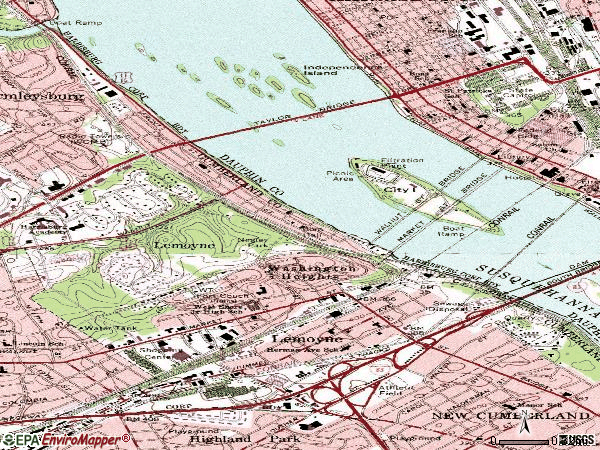
Notable locations in zip code 17043: West Shore Plaza (A), White Hill Station (B), West Shore Bureau of Fire Station 13 - 1 Headquarters (C), West Shore Bureau of Fire Station 13 - 2 (D). Display/hide their locations on the map
In group quarters: 19 (-1 institutionalized population)
Size of family households: 795 2-persons, 285 3-persons, 307 4-persons, 38 5-persons, 17 6-persons
Size of nonfamily households: 1,270 1-person, 255 2-persons, 7 3-persons
581 married couples with children.
181 single-parent households (45 men, 136 women).
93.1% of residents of 17043 zip code speak English at home.
1.0% of residents speak Spanish at home (41% very well, 33% well, 26% not well).
4.5% of residents speak other Indo-European language at home (63% very well, 37% well).
0.8% of residents speak other language at home (100% well).
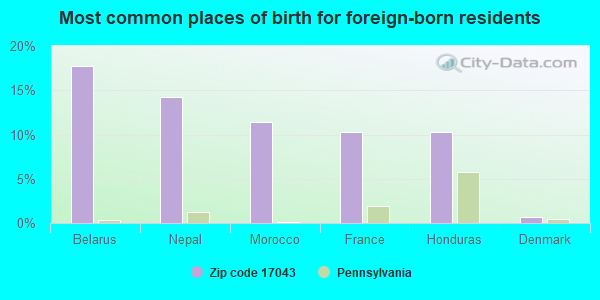
Foreign born population: 280 (4.8%) (44.9% of them are naturalized citizens)
This zip code:
4.8%
Whole state:
7.5%
18%Belarus
14%Nepal
11%Morocco
10%France
10%Honduras
1%Denmark
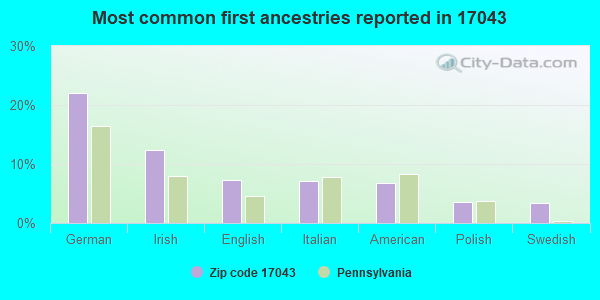
22%German
12%Irish
7%English
7%Italian
7%American
4%Polish
3%Swedish
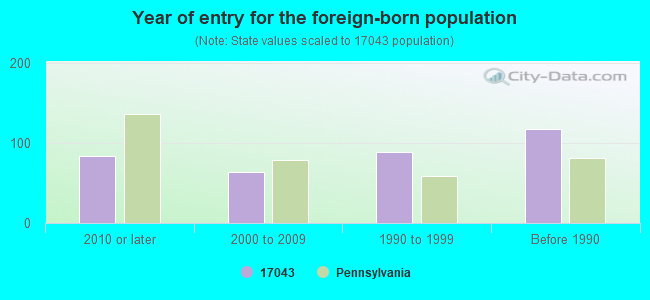
Year of entry for the foreign-born population
842010 or later
642000 to 2009
891990 to 1999
118Before 1990
Facilities with environmental interests located in this zip code:
AMER NATL CAN LEMOYNE METAL CAN MFG (221 S 10TH ST in LEMOYNE, PA)
AIR MINOR (AIRS/AFS) STATE MASTER (Pennsylvania database) - RCRIS-PAD003024551, HAZARDOUS WASTE PROGRAM (Resource Conservation and Recovery Act (tracking hazardous waste)) TRI REPORTER (Tracking of toxic chemicals releasing facilities) Business SIC classification: METAL CANS Business NAICS classification: METAL CAN MANUFACTURING. Organizations: AMERICAN NATIONAL CAN COMPANY (CONTACT/OWNER)
Alternative names: AMERICAN NATL CAN, AMERICAN NATIONAL CAN COMPANY LEMOYNE, AMERICAN NATL. CAN CO. LEMOYNE FACILITY
BAPS AUTO PAINT & SUPPLY (630 OAK ST in LEMOYNE, PA)
Small Quantity Generators, between 100 kg and 1000 kg of hazardous waste/month (Resource Conservation and Recovery Act (tracking hazardous waste)) - notification
Housing units lacking complete kitchen facilities: 2.2%
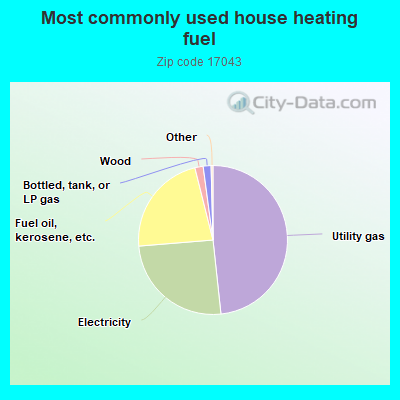
48.3%Utility gas
25.4%Electricity
22.4%Fuel oil, kerosene, etc.
1.8%Wood
1.7%Bottled, tank, or LP gas
Population in 1990: 5,340. Population change in the 1990s: +342 (+6.4%).
Place of birth for U.S.-born residents:
This state: 4,407
Northeast: 293
Midwest: 303
South: 377
West: 86
57% of the 17043 zip code residents lived in the same house 5 years ago. Out of people who lived in different houses, 52% lived in this county. Out of people who lived in different counties, 50% lived in Pennsylvania.
89% of the 17043 zip code residents lived in the same house 1 year ago. Out of people who lived in different houses, 51% moved from this county. Out of people who lived in different houses, 45% moved from different county within same state. Out of people who lived in different houses, 2% moved from different state.
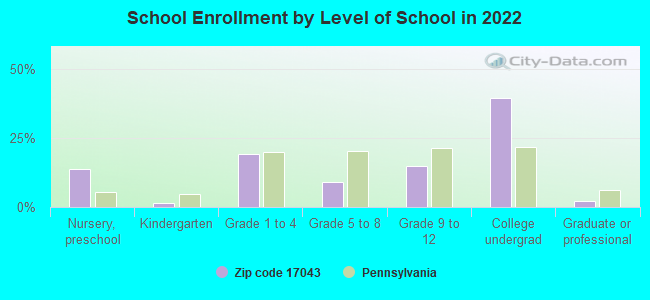
Private vs. public school enrollment:
Students in private schools in grades 1 to 8 (elementary and middle school): 17
Here:
6.4%
Pennsylvania:
15.7%
Students in private schools in grades 9 to 12 (high school): 3
Here:
2.2%
Pennsylvania:
13.4%
Students in private undergraduate colleges: 100
Here:
26.0%
Pennsylvania:
39.8%
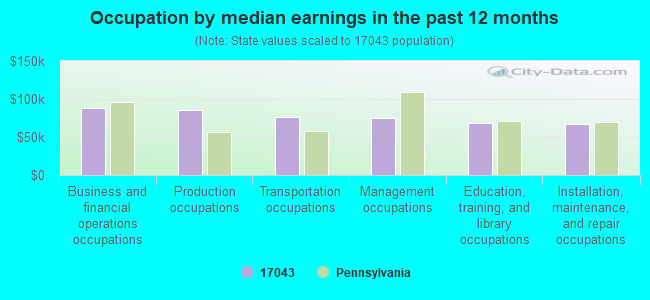
Occupation by median earnings in the past 12 months ($)
88,304Business and financial operations occupations
85,437Production occupations
76,113Transportation occupations
75,074Management occupations
68,816Education, training, and library occupations
67,456Installation, maintenance, and repair occupations
Companies with federal contracts located in this zip code:
TRUCK & MOTOR COMPANY (835B PEAR ST in LEMOYNE, PA; small business) : $1,920,829 in 97 contractsfrom 2000 to 2006
Contracts for Diesel Engines and Components, O-Ring, Packing and Gasket Materials, Bolts, and moreby Defense Logistics Agency Signed by year:2000: $27,888; 2001: $620,440; 2002: $394,632; 2003: $29,040; 2004: $279,775; 2005: $430,562; 2006: $138,492.
Biggest contracts:
$394,632 with Defense Logistics Agency for Diesel Engines and Components. Signed on 2002-03-19. Completion date: 2002-03-27.
$394,632, same as above.Signed on 2001-11-07. Completion date: 2002-03-07.
$73,405 with Defense Logistics Agency for O-Ring. Signed on 2005-02-23. Completion date: 2005-05-24.
$71,083 with Defense Logistics Agency for Packing and Gasket Materials. Signed on 2001-01-24. Completion date: 2001-04-24.
HARRISBURG TAXICAB BGGAGE CO (50 MARKET ST in LEMOYNE, PA; small business) : $143,773 in 29 contractsfrom 2002 to 2004
Contracts for Military Personnel Recruitment by Army Signed by year:2000: $0; 2001: $0; 2002: $12,040; 2003: $110,031; 2004: $21,702; 2005: $0; 2006: $0.
Biggest contracts:
$12,401 with Army for Military Personnel Recruitment. Signed on 2003-12-01. Completion date: 2003-12-31.
$12,401, same as above.Signed on 2004-01-01. Completion date: 2004-01-31.
$12,401, same as above.Signed on 2003-11-01. Completion date: 2003-11-30.
$12,401, same as above.Signed on 2003-10-01. Completion date: 2003-10-31.
PENNSYLVANIA OFFICE SERVICE GR (309 S 10TH ST in LEMOYNE, PA; small business) : $100,979 in 5 contractsfrom 2000 to 2005
Contracts for Office Furniture by Army, Defense Logistics Agency, Federal Supply Service Signed by year:2000: $30,244; 2001: $0; 2002: $29,922; 2003: $2,000; 2004: $0; 2005: $38,813; 2006: $0.
Biggest contracts:
$30,244 with Army for Office Furniture. Signed on 2000-02-29. Completion date: 2000-05-31.
$29,922 with Defense Logistics Agency for Office Furniture. Signed on 2002-09-03. Completion date: 2002-11-04.
$20,660, same as above.Signed on 2005-02-14. Completion date: 2005-04-05.
$18,153, same as above.Signed on 2005-09-30. Completion date: 2005-11-18.
KESSLERS INCORPORATED (1201 HUMMEL AVE in LEMOYNE, PA; small business) : $44,008 in 10 contractsfrom 2004 to 2006
Contracts for Food Items For Resale, Non-Food Items For Resale by Defense Commissary Agency Signed by year:2000: $0; 2001: $0; 2002: $0; 2003: $0; 2004: $10,730; 2005: $25,517; 2006: $7,761.
Biggest contracts:
$9,460 with Defense Commissary Agency for Food Items For Resale. Signed on 2004-10-01. Completion date: 2005-02-28.
$8,566, same as above.Signed on 2005-04-01. Completion date: 2005-08-31.
$7,761 with Defense Commissary Agency for Non-Food Items For Resale. Signed on 2006-01-01. Completion date: 2006-03-31.
$6,568, same as above.Signed on 2005-10-01. Completion date: 2005-12-31.
LEMOYNE SLEEPER COMPANY INC (57 S 3RD ST in LEMOYNE, PA)
$8,333 with Army for Household Furnishings. Signed on 2004-08-18. Completion date: 2004-09-30.
DOE & JERRYS, INC (902 N FRONT STREET in WORMLEYSBURG, PA; small business)
$7,978 with Navy for Food Services. Signed on 2004-09-18. Completion date: 2004-09-23.
LEDEBOHM, STEVE (1221 MARKET ST in LEMOYNE, PA; small business)
$4,835 with Navy for Modification of Equipment -- Ground Effect Vehicles, Motor Vehicles, Trailers, and Cycles. Signed on 2004-09-24. Completion date: 2004-09-24.
DENIS J MILKE, MD (1013 MUMMA ROAD, SUITE 203 in WORMLEYSBURG, PA; small business) : -$5,305 in 4 contractsin 2004
$0 with Navy for Medical/Psychiatric Consultation Services. Signed on 2004-09-08. Completion date: 2004-09-30.
$0, same as above.Signed on 2004-09-07. Completion date: 2004-09-30.
-$305, same as above.Signed on 2004-09-07. Completion date: 2004-09-30.
-$5,000, same as above.Signed on 2004-09-08. Completion date: 2004-09-30.
Top industries in this zip code by the number of employees in 2005:
Administrative and Support and Waste Management and Remediation Services: Temporary Help Services (250-499 employees: 1 establishment, 100-249 employees: 2 establishments, 50-99 employees: 2 establishments, 10-19 employees: 1 establishment, 1-4 employees: 1 establishment)
Health Care and Social Assistance: Offices of Physicians (except Mental Health Specialists) (50-99: 3, 20-49: 4, 10-19: 3, 5-9: 2, 1-4: 1)
Finance and Insurance: Direct Health and Medical Insurance Carriers (250-499: 1, 1-4: 1)
Administrative and Support and Waste Management and Remediation Services: Facilities Support Services (250-499: 1)
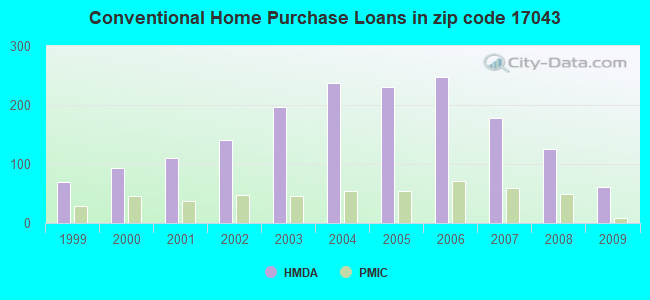
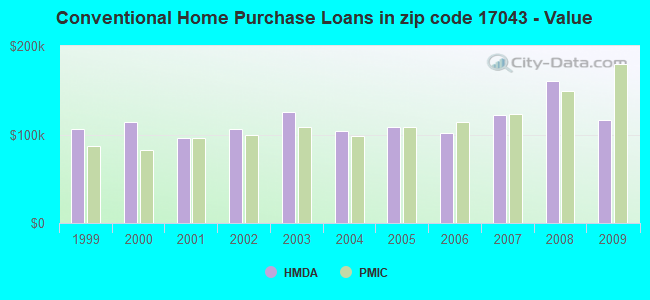
Detailed PMIC statistics for the following Tracts:0103.00
, 0106.00
2003 - 2018 National Fire Incident Reporting System (NFIRS) incidents
According to the data from the years 2003 - 2018 the average number of fire incidents per year is 28. The highest number of reported fire incidents - 58 took place in 2008, and the least - 6 in 2003. The data has a rising trend.
When looking into fire subcategories, the most reports belonged to: Structure Fires (60.4%), and Mobile Property/Vehicle Fires (15.2%).
Fire incident types reported to NFIRS in Zip Code 17043
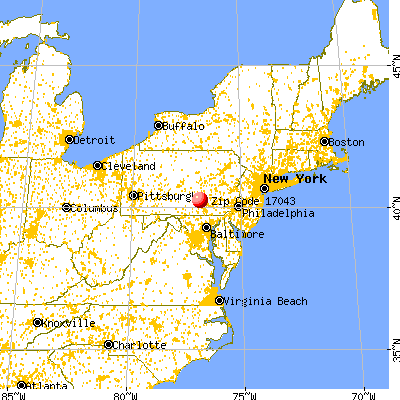


 Nearest zip codes: 17101, 17102, 17120, 17011, 17104, 17103.
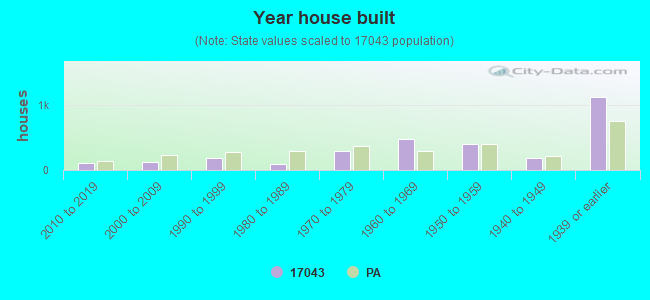


 According to the data from the years 2003 - 2018 the average number of fire incidents per year is 28. The highest number of reported fire incidents - 58 took place in 2008, and the least - 6 in 2003. The data has a rising trend.
 When looking into fire subcategories, the most reports belonged to: Structure Fires (60.4%), and Mobile Property/Vehicle Fires (15.2%).