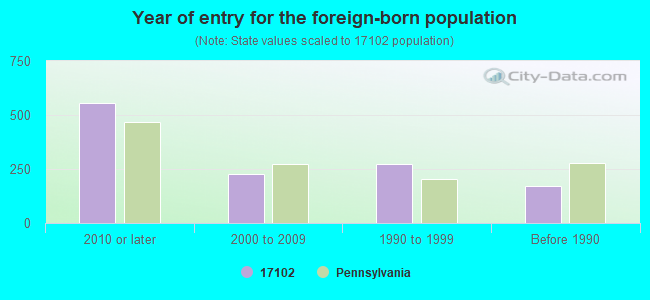
Estimated zip code population in 2022: 8,162 Zip code population in 2010: 7,628 Zip code population in 2000: 8,004
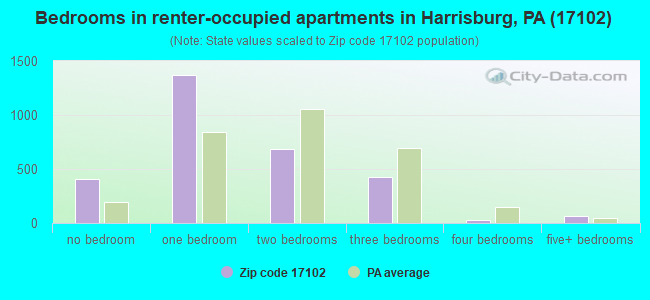
Houses and condos: 5,089 Renter-occupied apartments: 2,923
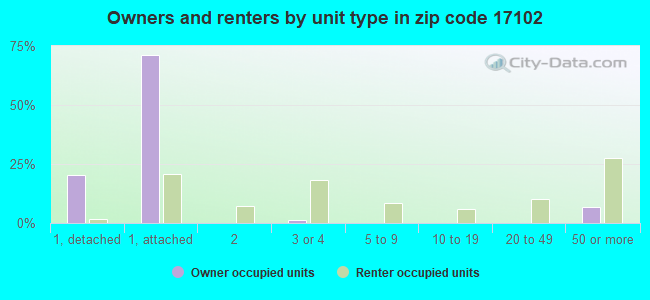
% of renters here:
64%
State:
31%
March 2022 cost of living index in zip code 17102: 95.9 (near average, U.S. average is 100)
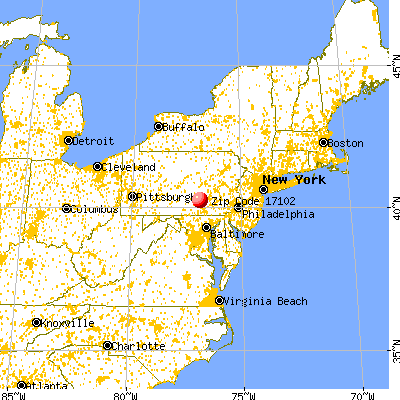
Land area: 0.8 sq. mi. Water area: 0.9 sq. mi.
Population density: 10,403 people per square mile
(high).
OSM Map
General Map
Google Map
MSN Map
OSM Map
General Map
Google Map
MSN Map
OSM Map
General Map
Google Map
MSN Map
OSM Map
General Map
Google Map
MSN Map
Please wait while loading the map...
Real estate property taxes paid for housing units in 2022:
This zip code:
1.6% ($2,913)
Pennsylvania:
1.3% ($3,094)
Median real estate property taxes paid for housing units with mortgages in 2022: $3,127 (1.7%) Median real estate property taxes paid for housing units with no mortgage in 2022: $2,406 (1.4%)
Averages for the 2020 tax year for zip code 17102, filed in 2021:
Average Adjusted Gross Income (AGI) in 2020: $49,414 (Individual Income Tax Returns)
Here:
$49,414
State:
$75,707
Salary/wage: $43,840 (reported on 86.7% of returns)
Here:
$43,840
State:
$62,806
(% of AGI for various income ranges: 1057.0% for AGIs below $25k, 3660.0% for AGIs $25k-50k, 6953.0% for AGIs $50k-75k, 10264.3% for AGIs $75k-100k, 18922.8% for AGIs $100k-200k, 43426.7% for AGIs over 200k)
Taxable interest for individuals: $622 (reported on 18.3% of returns)
This zip code:
$622
Pennsylvania:
$1,633
(% of AGI for various income ranges: 3.8% for AGIs below $25k, 5.1% for AGIs $25k-50k, 14.0% for AGIs $50k-75k, 25.2% for AGIs $75k-100k, 75.0% for AGIs $100k-200k, 380.0% for AGIs over 200k)
Ordinary dividends: $3,130 (reported on 12.8% of returns)
Here:
$3,130
State:
$7,382
(% of AGI for various income ranges: 4.7% for AGIs below $25k, 10.5% for AGIs $25k-50k, 48.4% for AGIs $50k-75k, 63.9% for AGIs $75k-100k, 370.6% for AGIs $100k-200k, 1530.0% for AGIs over 200k)
Net capital gain/loss in AGI: +$8,818 (reported on 11.9% of returns)
Here:
+$8,818
State:
+$23,522
(% of AGI for various income ranges: 1.7% for AGIs below $25k, 14.5% for AGIs $25k-50k, 75.2% for AGIs $50k-75k, 93.0% for AGIs $75k-100k, 623.9% for AGIs $100k-200k, 8356.7% for AGIs over 200k)
Profit/loss from business: +$11,053 (reported on 10.7% of returns)
Here:
+$11,053
State:
+$16,274
(% of AGI for various income ranges: 50.6% for AGIs below $25k, 69.5% for AGIs $25k-50k, 173.8% for AGIs $50k-75k, 184.3% for AGIs $75k-100k, 1281.1% for AGIs $100k-200k)
Taxable individual retirement arrangement distribution: $18,389 (reported on 4.3% of returns)
17102:
$18,389
Pennsylvania:
$18,583
(% of AGI for various income ranges: 21.5% for AGIs below $25k, 32.9% for AGIs $25k-50k, 88.0% for AGIs $50k-75k, 147.0% for AGIs $75k-100k, 1060.0% for AGIs $100k-200k)
Total itemized deductions: $21,057 (reported on 5.0% of returns)
Here:
$21,057
State:
$34,850
(% of AGI for various income ranges: 56.4% for AGIs $25k-50k, 143.6% for AGIs $50k-75k, 278.3% for AGIs $75k-100k, 901.1% for AGIs $100k-200k, 2606.7% for AGIs over 200k)
Charity contributions: $6,907 (reported on 3.3% of returns)
Here:
$6,907
State:
$12,392
(% of AGI for various income ranges: 44.6% for AGIs $50k-75k, 50.4% for AGIs $75k-100k, 348.9% for AGIs $100k-200k)
Taxes paid: $7,280 (reported on 4.8% of returns)
17102:
$7,280
State:
$8,200
(% of AGI for various income ranges: 5.9% for AGIs below $25k, 58.8% for AGIs $50k-75k, 116.5% for AGIs $75k-100k, 323.3% for AGIs $100k-200k, 823.3% for AGIs over 200k)
Earned income credit: $1,956 (reported on 18.5% of returns)
Here:
$1,956
State:
$2,100
(% of AGI for various income ranges: 89.1% for AGIs below $25k, 45.9% for AGIs $25k-50k)
Percentage of individuals using paid preparers for their 2020 taxes: 93.8%
Here:
94%
State:
92%
(% for various income ranges: 92.1% for AGIs below $25k, 94.3% for AGIs $25k-50k, 94.0% for AGIs $50k-75k, 97.0% for AGIs $75k-100k, 93.9% for AGIs $100k-200k, 100.0% for AGIs over 200k)
Averages for the 2012 tax year for zip code 17102, filed in 2013:
Average Adjusted Gross Income (AGI) in 2012: $38,974 (Individual Income Tax Returns)
Here:
$38,974
State:
$61,346
Salary/wage: $36,086 (reported on 88.1% of returns)
Here:
$36,086
State:
$51,902
(% of AGI for various income ranges: 80.5% for AGIs below $25k, 86.5% for AGIs $25k-50k, 86.7% for AGIs $50k-75k, 83.6% for AGIs $75k-100k, 79.0% for AGIs $100k-200k, 58.4% for AGIs over 200k)
Taxable interest for individuals: $502 (reported on 21.0% of returns)
This zip code:
$502
Pennsylvania:
$1,588
(% of AGI for various income ranges: 0.4% for AGIs below $25k, 0.2% for AGIs $25k-50k, 0.3% for AGIs $50k-75k, 0.4% for AGIs $75k-100k, 0.2% for AGIs $100k-200k, 0.3% for AGIs over 200k)
Ordinary dividends: $2,854 (reported on 12.3% of returns)
Here:
$2,854
State:
$5,827
(% of AGI for various income ranges: 0.8% for AGIs below $25k, 0.7% for AGIs $25k-50k, 0.7% for AGIs $50k-75k, 0.7% for AGIs $75k-100k, 1.7% for AGIs $100k-200k, 0.8% for AGIs over 200k)
Net capital gain/loss in AGI: +$1,409 (reported on 8.4% of returns)
Here:
+$1,409
State:
+$14,495
(% of AGI for various income ranges: 0.1% for AGIs $50k-75k, 0.6% for AGIs $75k-100k, 0.5% for AGIs $100k-200k, 1.7% for AGIs over 200k)
Profit/loss from business: +$9,726 (reported on 10.4% of returns)
Here:
+$9,726
State:
+$16,268
(% of AGI for various income ranges: 4.2% for AGIs below $25k, 2.3% for AGIs $25k-50k, 1.5% for AGIs $50k-75k, 2.8% for AGIs $75k-100k, 4.2% for AGIs $100k-200k)
Taxable individual retirement arrangement distribution: $9,200 (reported on 4.4% of returns)
17102:
$9,200
Pennsylvania:
$14,550
(% of AGI for various income ranges: 1.0% for AGIs below $25k, 1.0% for AGIs $25k-50k, 2.6% for AGIs $50k-75k, 0.7% for AGIs $100k-200k)
Total itemized deductions: $16,127 (20% of AGI, reported on 21.7% of returns)
Here:
$16,127
State:
$23,538
Here:
19.9% of AGI
State:
18.4% of AGI
(% of AGI for various income ranges: 4.5% for AGIs below $25k, 8.1% for AGIs $25k-50k, 10.2% for AGIs $50k-75k, 11.9% for AGIs $75k-100k, 11.5% for AGIs $100k-200k, 7.9% for AGIs over 200k)
Charity contributions: $2,384 (reported on 15.8% of returns)
Here:
$2,384
State:
$4,025
(% of AGI for various income ranges: 0.3% for AGIs below $25k, 0.6% for AGIs $25k-50k, 0.9% for AGIs $50k-75k, 1.4% for AGIs $75k-100k, 1.7% for AGIs $100k-200k, 1.4% for AGIs over 200k)
Taxes paid: $5,786 (reported on 21.7% of returns)
17102:
$5,786
State:
$9,982
(% of AGI for various income ranges: 0.7% for AGIs below $25k, 1.8% for AGIs $25k-50k, 3.8% for AGIs $50k-75k, 4.6% for AGIs $75k-100k, 5.0% for AGIs $100k-200k, 5.4% for AGIs over 200k)
Earned income credit: $1,908 (reported on 23.5% of returns)
Here:
$1,908
State:
$2,106
(% of AGI for various income ranges: 6.6% for AGIs below $25k, 0.7% for AGIs $25k-50k)
Percentage of individuals using paid preparers for their 2012 taxes: 37.5%
Here:
38%
State:
53%
(% for various income ranges: 37.6% for AGIs below $25k, 34.1% for AGIs $25k-50k, 36.5% for AGIs $50k-75k, 39.1% for AGIs $75k-100k, 50.0% for AGIs $100k-200k, 100.0% for AGIs over 200k)
Averages for the 2004 tax year for zip code 17102, filed in 2005:
Average Adjusted Gross Income (AGI) in 2004: $31,289 (Individual Income Tax Returns)
Here:
$31,289
State:
$48,049
Salary/wage: $29,772 (reported on 91.2% of returns)
Here:
$29,772
State:
$42,646
(% of AGI for various income ranges: 102.1% for AGIs below $10k, 88.3% for AGIs $10k-25k, 91.8% for AGIs $25k-50k, 90.9% for AGIs $50k-75k, 82.6% for AGIs $75k-100k, 67.7% for AGIs over 100k)
Taxable interest for individuals: $779 (reported on 27.0% of returns)
This zip code:
$779
Pennsylvania:
$1,657
(% of AGI for various income ranges: 1.4% for AGIs below $10k, 0.5% for AGIs $10k-25k, 0.6% for AGIs $25k-50k, 0.8% for AGIs $50k-75k, 1.1% for AGIs $75k-100k, 0.5% for AGIs over 100k)
Taxable dividends: $2,193 (reported on 12.1% of returns)
Here:
$2,193
State:
$3,566
(% of AGI for various income ranges: 1.6% for AGIs below $10k, 0.3% for AGIs $10k-25k, 0.4% for AGIs $25k-50k, 0.9% for AGIs $50k-75k, 1.4% for AGIs $75k-100k, 1.9% for AGIs over 100k)
Net capital gain/loss: +$3,840 (reported on 9.3% of returns)
Here:
+$3,840
State:
+$9,716
(% of AGI for various income ranges: -0.8% for AGIs below $10k, 0.0% for AGIs $10k-25k, 0.3% for AGIs $25k-50k, 0.2% for AGIs $50k-75k, 1.8% for AGIs $75k-100k, 5.7% for AGIs over 100k)
Profit/loss from business: +$10,162 (reported on 7.2% of returns)
Here:
+$10,162
State:
+$14,267
(% of AGI for various income ranges: 7.3% for AGIs below $10k, 1.8% for AGIs $10k-25k, 1.2% for AGIs $25k-50k, 1.0% for AGIs $50k-75k, 2.9% for AGIs $75k-100k, 6.1% for AGIs over 100k)
IRA payment deduction: $2,000 (reported on 1.2% of returns)
17102:
$2,000
Pennsylvania:
$2,903
Total itemized deductions: $12,553 (20% of AGI, reported on 21.5% of returns)
Here:
$12,553
State:
$18,804
Here:
19.8% of AGI
State:
19.5% of AGI
(% of AGI for various income ranges: 5.8% for AGIs below $10k, 2.8% for AGIs $10k-25k, 7.2% for AGIs $25k-50k, 11.7% for AGIs $50k-75k, 13.1% for AGIs $75k-100k, 12.5% for AGIs over 100k)
Charity contributions deductions: $2,239 (3% of AGI, reported on 18.2% of returns)
Here:
$2,239
State:
$3,337
Here:
3.5% of AGI
State:
3.3% of AGI
(% of AGI for various income ranges: 0.4% for AGIs below $10k, 0.3% for AGIs $10k-25k, 0.9% for AGIs $25k-50k, 1.8% for AGIs $50k-75k, 2.3% for AGIs $75k-100k, 2.2% for AGIs over 100k)
Total tax: $4,537 (reported on 72.8% of returns)
17102:
$4,537
State:
$8,008
(% of AGI for various income ranges: 1.7% for AGIs below $10k, 4.4% for AGIs $10k-25k, 8.9% for AGIs $25k-50k, 12.2% for AGIs $50k-75k, 14.4% for AGIs $75k-100k, 18.8% for AGIs over 100k)
Earned income credit: $1,519 (reported on 23.8% of returns)
Here:
$1,519
State:
$1,643
Percentage of individuals using paid preparers for their 2004 taxes: 48.4%
Here:
48%
State:
56%
(% for various income ranges: 51.7% for AGIs below $10k, 52.6% for AGIs $10k-25k, 42.6% for AGIs $25k-50k, 45.2% for AGIs $50k-75k, 42.6% for AGIs $75k-100k, 61.4% for AGIs over 100k)
Likely homosexual households (counted as self-reported same-sex unmarried-partner households)
Lesbian couples: 0.1% of all households
Gay men: 0.5% of all households
Household received Food Stamps/SNAP in the past 12 months: 978 Household did not receive Food Stamps/SNAP in the past 12 months: 3,627
Women who had a birth in the past 12 months: 110 (66 now married, 40 unmarried) Women who did not have a birth in the past 12 months: 2,138 (530 now married, 1,619 unmarried)
Housing units in zip code 17102 with a mortgage: 1,100 (74 second mortgage, 57 both second mortgage and home equity loan) Houses without a mortgage: 29
Median monthly owner costs for units with a mortgage: $1,413 Median monthly owner costs for units without a mortgage: $449
Residents with income below the poverty level in 2022:
This zip code:
26.4%
Whole state:
11.8%
Residents with income below 50% of the poverty level in 2022:
This zip code:
9.3%
Whole state:
6.1%
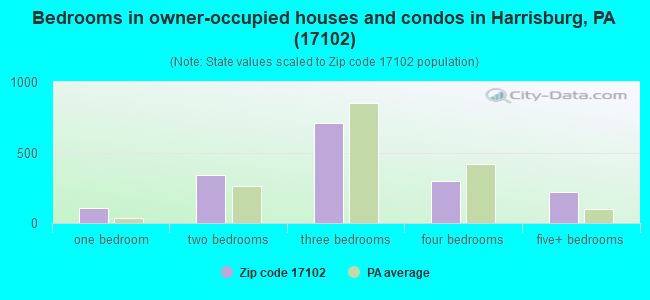
Median number of rooms in houses and condos:
Here:
6.5
State:
6.8
Median number of rooms in apartments:
Here:
3.6
State:
4.3
Notable locations in this zip code not listed on our city pages
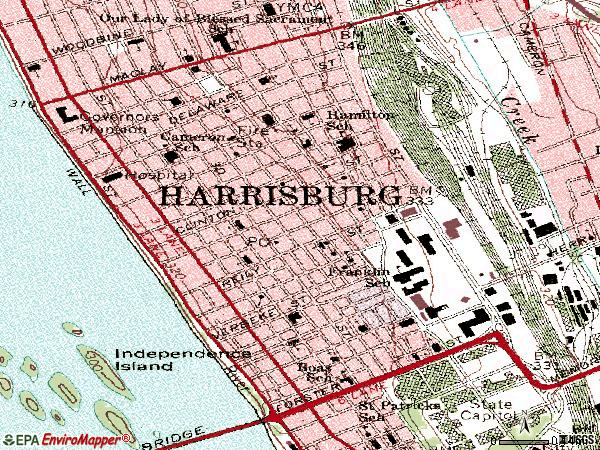
Notable locations in zip code 17102: Harrisburg Bureau of Fire Station 1 (A), Governors Mansion (B), Broad Street Market (C). Display/hide their locations on the map
Parks in zip code 17102 include: Penn and Sayford Park (1), Penn and Dauphin Park (2), Fourth and Dauphin Park (3), Delaware and Wallace Park (4). Display/hide their locations on the map
328 married couples with children.
563 single-parent households (24 men, 539 women).
85.5% of residents of 17102 zip code speak English at home.
9.3% of residents speak Spanish at home (48% very well, 13% well, 12% not well, 27% not at all).
1.2% of residents speak other Indo-European language at home (64% very well, 36% well).
1.7% of residents speak Asian or Pacific Island language at home (13% very well, 70% well, 11% not well, 6% not at all).
2.0% of residents speak other language at home (94% very well, 6% well).
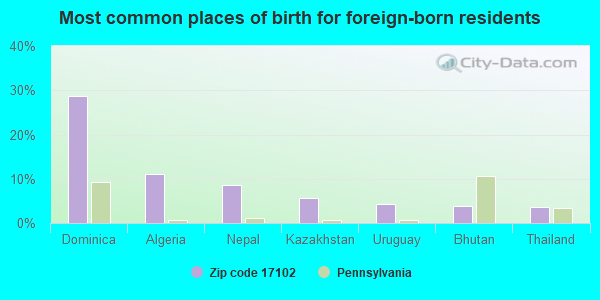
Foreign born population: 614 (7.5%) (54.6% of them are naturalized citizens)
Facilities with environmental interests located in this zip code:
AT&T DEV SITE 7TH ST HBG (1501 N 7TH ST in HARRISBURG, PA)
AIR MAJOR (AIRS/AFS) STATE MASTER (Pennsylvania database) - RCRIS-PAD051659035, HAZARDOUS WASTE PROGRAM Large Quantity Generators, more that 1000 kg of hazardous waste/month (Resource Conservation and Recovery Act (tracking hazardous waste)) - notification TRI REPORTER (Tracking of toxic chemicals releasing facilities) Business SIC classification: WRECKING AND DEMOLITION WORK; BOOK PRINTING; COMMERCIAL PRINTING; LAND SUBDIVIDERS AND DEVELOPERS, EXCEPT CEMETERIES Organizations: OPERNAME (CONTACT/OPERATOR)
, BOYERTOWN PACKAGING CORPORATION (CONTACT/OWNER)
, HARGRO FLEXIBLE PACKAGING (CONTACT/OWNER)
, MAZZOCCHI WRECKING, INC. (CONTACT/OWNER)
, HARGRO FLEXIBLE PACKAGING (OWNER/OPERATOR)
, MAZZOCCHI WRECKING, INC. (OWNER/OPERATOR)
Alternative names: HARGRO FLEXIBLE PACKAGING, HARGRO FLEXIBLE PACKAGING CORPORATION HBG, HARGRO FLEXIBLE PKG/HARRISBURG PKG, HARGRO FLEXIBLE PKG MATERIAL MFG HBG, HARRISBURG PACKAGING CO
BIOLIFE PLASMA SRV LP (931 N 7TH ST in HARRISBURG, PA)
STATE MASTER (Pennsylvania database) - RCRIS-PAR000507061, HAZARDOUS WASTE PROGRAM Conditionally Exempt Small Quantity Generators, less than 100 kg/month of hazardous waste (Resource Conservation and Recovery Act (tracking hazardous waste)) - notification Organizations: BIOLIFE PLASMA SERVICES L P (CONTACT/OWNER)
, BIOLIFE PLASMA SERVICES, L.P. (CONTACT/OWNER)
Alternative names: BIOLIFE PLASMA SERVICES L P
A-1 UNITED AUTO SERVICES (1330 N. 3RD STREET in HARRISBURG, PA)
AIR MINOR (AIRS/AFS) Business SIC classification: AUTOMOTIVE REPAIR SHOPS
ALBERT MICHAELS CONSERVATION (1116 N THIRD ST in HARRISBURG, PA)
Small Quantity Generators, between 100 kg and 1000 kg of hazardous waste/month (Resource Conservation and Recovery Act (tracking hazardous waste)) - notification Organizations: MICHAELS ALBERT CONSERVATION INC (CONTACT/OWNER)
AMP INCORPORATED MANUFACTURING (1523 N 4TH ST in HARRISBURG, PA)
Conditionally Exempt Small Quantity Generators, less than 100 kg/month of hazardous waste (Resource Conservation and Recovery Act (tracking hazardous waste)) - notification Business NAICS classification: SPECIAL DIE AND TOOL, DIE SET, JIG, AND FIXTURE MANUFACTURING. Organizations: OPERNAME (CONTACT/OPERATOR)
Housing units lacking complete plumbing facilities: 1.4% Housing units lacking complete kitchen facilities: 1.3%
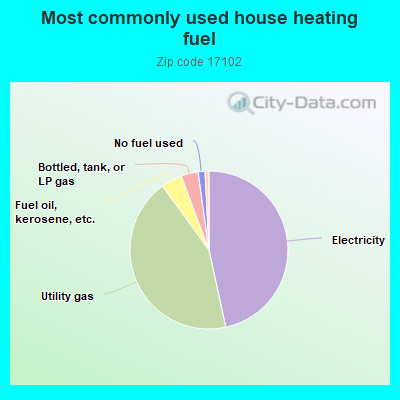
46.6%Electricity
43.4%Utility gas
4.3%Fuel oil, kerosene, etc.
3.5%Bottled, tank, or LP gas
1.4%No fuel used
0.8%Other fuel
Population in 1990: 8,862.
Place of birth for U.S.-born residents:
This state: 4,628
Northeast: 999
Midwest: 588
South: 645
West: 139
44% of the 17102 zip code residents lived in the same house 5 years ago. Out of people who lived in different houses, 58% lived in this county. Out of people who lived in different counties, 50% lived in Pennsylvania.
80% of the 17102 zip code residents lived in the same house 1 year ago. Out of people who lived in different houses, 33% moved from this county. Out of people who lived in different houses, 46% moved from different county within same state. Out of people who lived in different houses, 17% moved from different state. Out of people who lived in different houses, 1% moved from abroad.
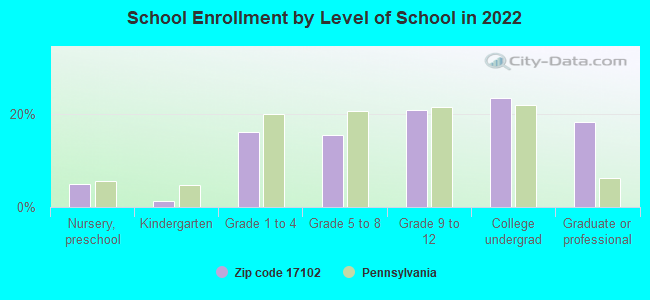
Private vs. public school enrollment:
Students in private schools in grades 1 to 8 (elementary and middle school): 112
Here:
23.2%
Pennsylvania:
15.7%
Students in private schools in grades 9 to 12 (high school): 90
Here:
27.8%
Pennsylvania:
13.4%
Students in private undergraduate colleges: 58
Here:
16.5%
Pennsylvania:
39.8%
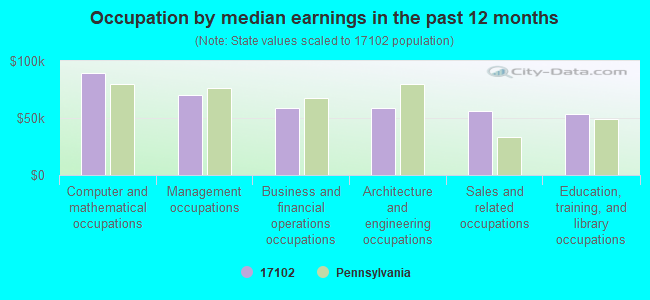
Occupation by median earnings in the past 12 months ($)
89,544Computer and mathematical occupations
70,114Management occupations
58,927Business and financial operations occupations
58,442Architecture and engineering occupations
56,147Sales and related occupations
53,900Education, training, and library occupations
Companies with federal contracts located in this zip code (HARRISBURG, PA):
J P LILLEY & SON INC (2009 N 3RD ST; small business) : $490,432 in 20 contractsfrom 2001 to 2006
Contracts for Office Information System Equipment, Automated Information System Design and Integration Services, Video Recording and Reproducing Equipment, ADP Support Equipment, and moreby Army, Navy, Defense Logistics Agency, Department of Veterans Affairs, and others Signed by year:2000: $0; 2001: $30,000; 2002: $26,000; 2003: $148,519; 2004: $120,895; 2005: $126,805; 2006: $38,213.
Biggest contracts:
$105,965 with Army for Office Information System Equipment. Signed on 2004-09-22. Completion date: 2004-10-22.
$105,811 with Navy for Automated Information System Design and Integration Services. Signed on 2003-09-26. Completion date: 2003-09-26.
$86,650 with Defense Logistics Agency for Video Recording and Reproducing Equipment. Signed on 2005-08-25. Completion date: 2005-09-30.
$38,496 with Navy for ADP Support Equipment. Signed on 2003-09-26. Completion date: 2003-10-26.
PENNSYLVANIA INDUSTRIES FOR TH (1007 N FRONT ST; small business) : $48,022 in 2 contractsfrom 1999 to 2003
$45,000 with Department of Veterans Affairs for Lease or Rental of Facilities -- Hospitals and Infirmaries. Signed on 1999-10-15. Completion date: 2000-09-15.
$3,022 with Army for Draperies, Awnings, and Shades. Signed on 2003-08-08. Completion date: 2003-09-15.
JP LILLEY AND SONS INC (2009 N 3RD ST)
$37,537 with Navy for Other Management Support Services. Signed on 2003-05-23. Completion date: 2003-05-23.
CHAD M RUEGSEGGER (255 REILY ST; small business) : $17,350 in 3 contractsin 2005
$14,000 with Army for Other Social Services. Signed on 2005-10-19. Completion date: 2005-10-31.
$3,350, same as above.Signed on 2005-08-09. Completion date: 2005-10-31.
$0, same as above.Signed on 2005-10-19. Completion date: 2005-10-31.
Top industries in this zip code by the number of employees in 2005:
Health Care and Social Assistance: Child and Youth Services (100-249 employees: 1 establishment, 20-49 employees: 1 establishment)
Health Care and Social Assistance: Continuing Care Retirement Communities (100-249: 1)
Health Care and Social Assistance: Psychiatric and Substance Abuse Hospitals (100-249: 1)
Professional, Scientific, and Technical Services: Engineering Services (100-249: 1)
Health Care and Social Assistance: Vocational Rehabilitation Services (100-249: 1)
Other Services (except Public Administration): Business Associations (50-99: 1, 10-19: 4, 5-9: 2, 1-4: 2)
Professional, Scientific, and Technical Services: Offices of Lawyers (20-49: 1, 5-9: 5, 1-4: 10)
Other Services (except Public Administration): Labor Unions and Similar Labor Organizations (50-99: 1, 5-9: 1, 1-4: 3)
Health Care and Social Assistance: Offices of Physicians (except Mental Health Specialists) (20-49: 1, 10-19: 3, 1-4: 3)
Health Care and Social Assistance: Services for the Elderly and Persons with Disabilities (50-99: 1, 1-4: 1)
People in group quarters in 2010:
98 people in correctional residential facilities
95 people in emergency and transitional shelters (with sleeping facilities) for people experiencing homelessness
89 people in nursing facilities/skilled-nursing facilities
49 people in residential treatment centers for adults
37 people in other noninstitutional facilities
10 people in group homes intended for adults
People in group quarters in 2000:
256 people in nursing homes
140 people in other noninstitutional group quarters
54 people in halfway houses
37 people in mental (psychiatric) hospitals or wards
12 people in homes for the mentally ill
5 people in homes or halfway houses for drug/alcohol abuse
Fatal accident statistics in 2012:
Fatal accident count: 2
Vehicles involved in fatal accidents: 2
Fatal accidents caused by drunken drivers: 1
Fatalities: 2
Persons involved in fatal accidents: 2
Pedestrians involved in fatal accidents: 1
Fatal accident statistics in 2011:
Fatal accident count: 1
Vehicles involved in fatal accidents: 1
Fatal accidents caused by drunken drivers: 1
Fatalities: 1
Persons involved in fatal accidents: 1
Pedestrians involved in fatal accidents: 0
Home Mortgage Disclosure Act Aggregated Statistics For Year 2009 (Based on 4 full and 2 partial tracts)
A) FHA, FSA/RHS & VA Home Purchase Loans
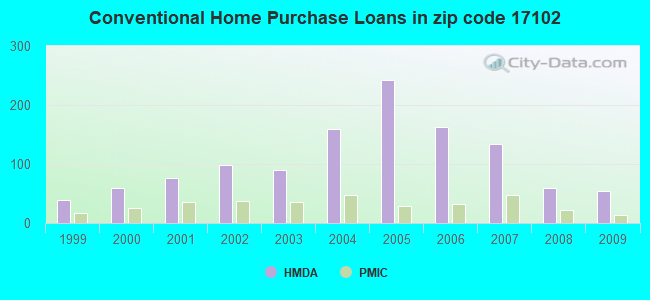
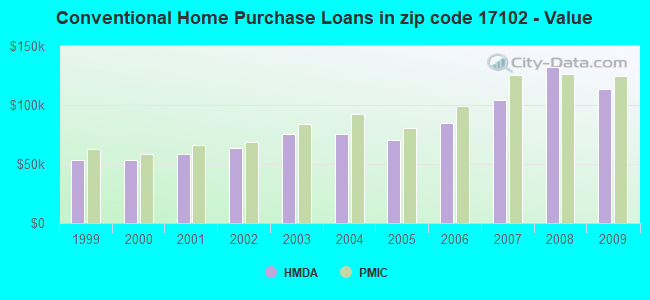
B) Conventional Home Purchase Loans
C) Refinancings
D) Home Improvement Loans
E) Loans on Dwellings For 5+ Families
F) Non-occupant Loans on < 5 Family Dwellings (A B C & D)
Number
Average Value
Number
Average Value
Number
Average Value
Number
Average Value
Number
Average Value
Number
Average Value
LOANS ORIGINATED
53
$124,985
54
$113,188
86
$113,815
9
$31,038
2
$165,395
33
$103,793
APPLICATIONS APPROVED, NOT ACCEPTED
0
$0
3
$95,613
13
$120,175
1
$10,000
0
$0
3
$104,483
APPLICATIONS DENIED
8
$88,660
3
$124,487
33
$115,161
10
$24,738
1
$18,500,000
5
$79,250
APPLICATIONS WITHDRAWN
6
$120,563
2
$121,580
33
$119,069
0
$0
0
$0
3
$105,973
FILES CLOSED FOR INCOMPLETENESS
0
$0
0
$0
6
$126,760
1
$88,350
0
$0
0
$0
Aggregated Statistics For Year 2008 (Based on 4 full and 2 partial tracts)
A) FHA, FSA/RHS & VA Home Purchase Loans
B) Conventional Home Purchase Loans
C) Refinancings
D) Home Improvement Loans
E) Loans on Dwellings For 5+ Families
F) Non-occupant Loans on < 5 Family Dwellings (A B C & D)
Number
Average Value
Number
Average Value
Number
Average Value
Number
Average Value
Number
Average Value
Number
Average Value
LOANS ORIGINATED
40
$131,033
60
$132,000
87
$110,823
35
$45,137
6
$649,172
53
$117,444
APPLICATIONS APPROVED, NOT ACCEPTED
4
$114,272
6
$96,093
13
$105,318
2
$72,220
0
$0
9
$80,611
APPLICATIONS DENIED
2
$169,255
4
$152,030
68
$96,886
28
$50,125
1
$175,000
22
$96,137
APPLICATIONS WITHDRAWN
3
$138,370
6
$107,528
35
$93,888
2
$13,935
0
$0
11
$85,456
FILES CLOSED FOR INCOMPLETENESS
0
$0
0
$0
6
$115,460
0
$0
0
$0
4
$105,625
Aggregated Statistics For Year 2007 (Based on 4 full and 2 partial tracts)
A) FHA, FSA/RHS & VA Home Purchase Loans
B) Conventional Home Purchase Loans
C) Refinancings
D) Home Improvement Loans
E) Loans on Dwellings For 5+ Families
F) Non-occupant Loans on < 5 Family Dwellings (A B C & D)
G) Loans On Manufactured Home Dwelling (A B C & D)
Number
Average Value
Number
Average Value
Number
Average Value
Number
Average Value
Number
Average Value
Number
Average Value
Number
Average Value
LOANS ORIGINATED
13
$126,922
134
$104,456
89
$93,374
33
$38,639
5
$215,844
56
$99,983
0
$0
APPLICATIONS APPROVED, NOT ACCEPTED
1
$133,000
16
$93,983
24
$70,794
5
$20,966
0
$0
10
$69,405
1
$20,000
APPLICATIONS DENIED
4
$101,842
22
$72,696
88
$97,341
44
$34,657
0
$0
31
$72,577
1
$19,730
APPLICATIONS WITHDRAWN
2
$89,500
10
$107,870
56
$109,642
4
$19,818
0
$0
13
$73,040
0
$0
FILES CLOSED FOR INCOMPLETENESS
0
$0
3
$116,650
9
$77,296
1
$92,680
0
$0
2
$104,375
0
$0
Aggregated Statistics For Year 2006 (Based on 4 full and 2 partial tracts)
A) FHA, FSA/RHS & VA Home Purchase Loans
B) Conventional Home Purchase Loans
C) Refinancings
D) Home Improvement Loans
E) Loans on Dwellings For 5+ Families
F) Non-occupant Loans on < 5 Family Dwellings (A B C & D)
G) Loans On Manufactured Home Dwelling (A B C & D)
Number
Average Value
Number
Average Value
Number
Average Value
Number
Average Value
Number
Average Value
Number
Average Value
Number
Average Value
LOANS ORIGINATED
25
$146,006
163
$84,556
98
$80,196
40
$35,598
5
$310,402
79
$81,853
1
$81,000
APPLICATIONS APPROVED, NOT ACCEPTED
1
$105,000
20
$77,030
15
$78,149
2
$15,500
0
$0
17
$64,178
0
$0
APPLICATIONS DENIED
0
$0
23
$96,648
75
$72,974
37
$37,616
0
$0
33
$75,513
0
$0
APPLICATIONS WITHDRAWN
0
$0
49
$64,988
30
$87,498
1
$32,000
0
$0
31
$48,198
1
$76,000
FILES CLOSED FOR INCOMPLETENESS
0
$0
9
$99,786
7
$87,743
0
$0
0
$0
3
$63,090
1
$76,000
Aggregated Statistics For Year 2005 (Based on 4 full and 2 partial tracts)
A) FHA, FSA/RHS & VA Home Purchase Loans
B) Conventional Home Purchase Loans
C) Refinancings
D) Home Improvement Loans
E) Loans on Dwellings For 5+ Families
F) Non-occupant Loans on < 5 Family Dwellings (A B C & D)
G) Loans On Manufactured Home Dwelling (A B C & D)
Number
Average Value
Number
Average Value
Number
Average Value
Number
Average Value
Number
Average Value
Number
Average Value
Number
Average Value
LOANS ORIGINATED
22
$126,589
243
$70,484
124
$91,191
39
$29,204
8
$1,814,256
113
$71,695
0
$0
APPLICATIONS APPROVED, NOT ACCEPTED
0
$0
10
$96,995
30
$61,338
4
$60,368
1
$88,000
5
$70,590
0
$0
APPLICATIONS DENIED
3
$64,843
57
$56,895
110
$77,224
34
$31,571
0
$0
55
$52,781
0
$0
APPLICATIONS WITHDRAWN
1
$101,990
30
$81,743
55
$90,196
13
$100,057
1
$938,200
15
$56,959
1
$95,430
FILES CLOSED FOR INCOMPLETENESS
0
$0
2
$91,315
11
$69,308
1
$40,000
0
$0
0
$0
0
$0
Aggregated Statistics For Year 2004 (Based on 4 full and 2 partial tracts)
A) FHA, FSA/RHS & VA Home Purchase Loans
B) Conventional Home Purchase Loans
C) Refinancings
D) Home Improvement Loans
E) Loans on Dwellings For 5+ Families
F) Non-occupant Loans on < 5 Family Dwellings (A B C & D)
G) Loans On Manufactured Home Dwelling (A B C & D)
Number
Average Value
Number
Average Value
Number
Average Value
Number
Average Value
Number
Average Value
Number
Average Value
Number
Average Value
LOANS ORIGINATED
46
$130,437
160
$75,319
117
$69,716
37
$23,656
3
$3,732,193
68
$68,064
1
$33,990
APPLICATIONS APPROVED, NOT ACCEPTED
3
$138,540
8
$74,414
31
$59,272
1
$35,000
0
$0
9
$63,151
0
$0
APPLICATIONS DENIED
1
$65,000
25
$81,560
132
$64,675
40
$21,137
1
$131,220
19
$71,024
0
$0
APPLICATIONS WITHDRAWN
3
$125,947
14
$82,154
48
$80,069
6
$36,570
1
$219,000
7
$56,079
0
$0
FILES CLOSED FOR INCOMPLETENESS
0
$0
5
$53,568
38
$65,388
0
$0
0
$0
0
$0
0
$0
Aggregated Statistics For Year 2003 (Based on 4 full and 2 partial tracts)
A) FHA, FSA/RHS & VA Home Purchase Loans
B) Conventional Home Purchase Loans
C) Refinancings
D) Home Improvement Loans
E) Loans on Dwellings For 5+ Families
F) Non-occupant Loans on < 5 Family Dwellings (A B C & D)
Number
Average Value
Number
Average Value
Number
Average Value
Number
Average Value
Number
Average Value
Number
Average Value
LOANS ORIGINATED
24
$94,121
89
$75,389
175
$67,248
24
$22,347
8
$216,791
63
$64,399
APPLICATIONS APPROVED, NOT ACCEPTED
2
$101,550
12
$64,100
35
$73,554
4
$24,600
0
$0
7
$63,920
APPLICATIONS DENIED
4
$90,520
18
$48,938
158
$64,566
33
$16,957
0
$0
32
$46,577
APPLICATIONS WITHDRAWN
1
$82,000
9
$91,171
85
$73,555
3
$39,423
1
$145,000
11
$83,670
FILES CLOSED FOR INCOMPLETENESS
1
$83,960
1
$109,860
13
$54,208
2
$28,765
0
$0
0
$0
Aggregated Statistics For Year 2002 (Based on 4 full and 2 partial tracts)
A) FHA, FSA/RHS & VA Home Purchase Loans
B) Conventional Home Purchase Loans
C) Refinancings
D) Home Improvement Loans
E) Loans on Dwellings For 5+ Families
F) Non-occupant Loans on < 5 Family Dwellings (A B C & D)
Number
Average Value
Number
Average Value
Number
Average Value
Number
Average Value
Number
Average Value
Number
Average Value
LOANS ORIGINATED
33
$95,021
98
$63,483
98
$63,213
12
$25,451
3
$609,733
47
$55,707
APPLICATIONS APPROVED, NOT ACCEPTED
1
$107,820
15
$52,439
36
$56,295
3
$32,000
0
$0
3
$76,523
APPLICATIONS DENIED
0
$0
20
$79,028
118
$53,919
13
$15,836
1
$30,000
17
$75,711
APPLICATIONS WITHDRAWN
1
$143,600
9
$43,351
59
$59,460
1
$31,000
0
$0
4
$107,542
FILES CLOSED FOR INCOMPLETENESS
2
$136,925
4
$89,788
22
$64,117
0
$0
0
$0
0
$0
Aggregated Statistics For Year 2001 (Based on 4 full and 2 partial tracts)
A) FHA, FSA/RHS & VA Home Purchase Loans
B) Conventional Home Purchase Loans
C) Refinancings
D) Home Improvement Loans
E) Loans on Dwellings For 5+ Families
F) Non-occupant Loans on < 5 Family Dwellings (A B C & D)
Number
Average Value
Number
Average Value
Number
Average Value
Number
Average Value
Number
Average Value
Number
Average Value
LOANS ORIGINATED
35
$75,896
77
$58,893
68
$55,452
21
$13,790
1
$216,000
28
$59,280
APPLICATIONS APPROVED, NOT ACCEPTED
5
$78,800
10
$51,852
30
$61,052
4
$19,952
0
$0
1
$320,810
APPLICATIONS DENIED
1
$33,000
26
$60,633
125
$54,056
35
$14,801
1
$190,000
7
$58,720
APPLICATIONS WITHDRAWN
3
$103,077
6
$66,858
34
$54,151
3
$24,563
0
$0
1
$38,540
FILES CLOSED FOR INCOMPLETENESS
1
$69,280
2
$47,780
12
$67,888
0
$0
0
$0
0
$0
Aggregated Statistics For Year 2000 (Based on 4 full and 2 partial tracts)
A) FHA, FSA/RHS & VA Home Purchase Loans
B) Conventional Home Purchase Loans
C) Refinancings
D) Home Improvement Loans
E) Loans on Dwellings For 5+ Families
F) Non-occupant Loans on < 5 Family Dwellings (A B C & D)
Number
Average Value
Number
Average Value
Number
Average Value
Number
Average Value
Number
Average Value
Number
Average Value
LOANS ORIGINATED
20
$65,764
60
$53,069
53
$43,426
24
$14,211
1
$285,000
24
$52,645
APPLICATIONS APPROVED, NOT ACCEPTED
1
$60,560
10
$55,019
21
$52,190
5
$17,894
0
$0
4
$81,942
APPLICATIONS DENIED
0
$0
26
$57,932
90
$41,243
41
$9,986
0
$0
7
$46,579
APPLICATIONS WITHDRAWN
1
$78,000
15
$61,569
32
$43,395
7
$27,563
0
$0
4
$57,905
FILES CLOSED FOR INCOMPLETENESS
0
$0
2
$64,765
14
$46,702
0
$0
0
$0
0
$0
Aggregated Statistics For Year 1999 (Based on 2 full and 2 partial tracts)
A) FHA, FSA/RHS & VA Home Purchase Loans
B) Conventional Home Purchase Loans
C) Refinancings
D) Home Improvement Loans
F) Non-occupant Loans on < 5 Family Dwellings (A B C & D)
2005 - 2018 National Fire Incident Reporting System (NFIRS) incidents
Based on the data from the years 2005 - 2018 the average number of fire incidents per year is 35. The highest number of fires - 80 took place in 2005, and the least - 0 in 2010. The data has a dropping trend.
When looking into fire subcategories, the most reports belonged to: Structure Fires (73.1%), and Outside Fires (18.0%).
Fire incident types reported to NFIRS in Zip Code 17102


 Nearest zip codes: 17101, 17120, 17043, 17103, 17011, 17093.


 Based on the data from the years 2005 - 2018 the average number of fire incidents per year is 35. The highest number of fires - 80 took place in 2005, and the least - 0 in 2010. The data has a dropping trend.
 When looking into fire subcategories, the most reports belonged to: Structure Fires (73.1%), and Outside Fires (18.0%).