Estimated zip code population in 2022: 4,422 Zip code population in 2010: 4,298 Zip code population in 2000: 3,911
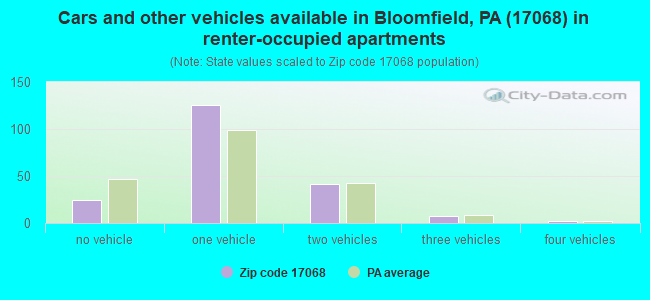
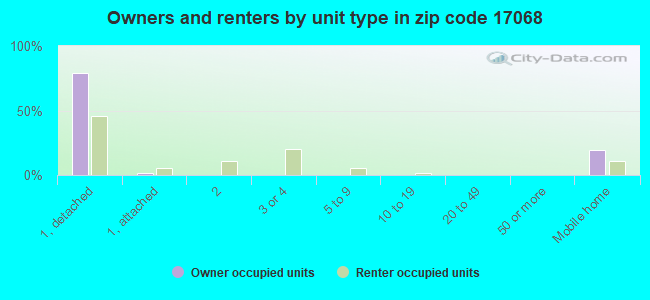
Houses and condos: 1,770 Renter-occupied apartments: 200
% of renters here:
12%
State:
31%
March 2022 cost of living index in zip code 17068: 91.9 (less than average, U.S. average is 100)
Land area: 33.6 sq. mi. Water area: 0.1 sq. mi.
Population density: 132 people per square mile
(very low).
OSM Map
General Map
Google Map
MSN Map
OSM Map
General Map
Google Map
MSN Map
OSM Map
General Map
Google Map
MSN Map
OSM Map
General Map
Google Map
MSN Map
Please wait while loading the map...
Real estate property taxes paid for housing units in 2022:
This zip code:
1.2% ($2,413)
Pennsylvania:
1.3% ($3,094)
Median real estate property taxes paid for housing units with mortgages in 2022: $2,463 (1.1%) Median real estate property taxes paid for housing units with no mortgage in 2022: $2,305 (1.2%)
Business Search- 14 Million verified businesses
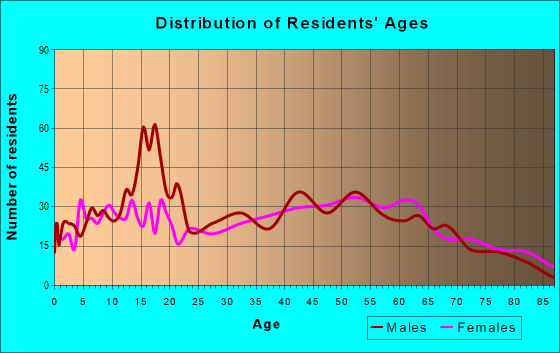
Males: 2,314
(52.3%)
Females: 2,107
(47.7%)
For population 25 years and over in 17068:
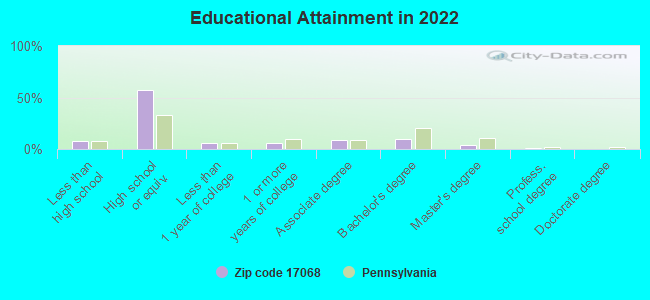
High school or higher: 90.0%
Bachelor's degree or higher: 13.8%
Graduate or professional degree: 4.5%
Unemployed: 3.0%
Mean travel time to work (commute): 31.9 minutes
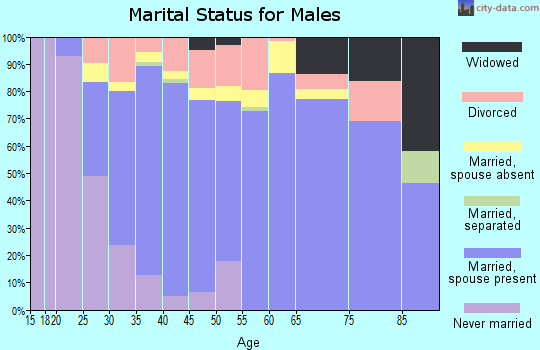
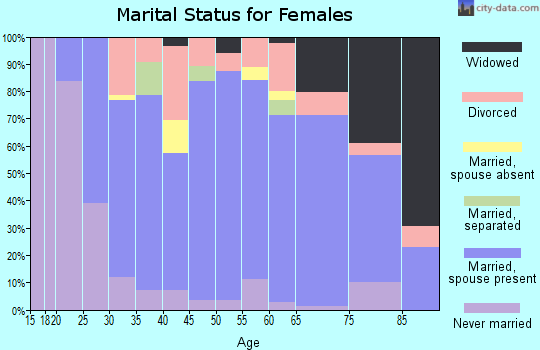
For population 15 years and over in 17068:
Never married: 23.2%
Now married: 53.9%
Separated: 1.5%
Widowed: 8.0%
Divorced: 13.5%
Zip code 17068 compared to state average:
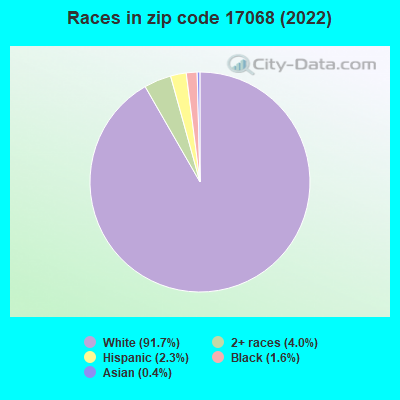
Black race population percentage significantly below state average.
Hispanic race population percentage significantly below state average.
Median age significantly above state average.
Foreign-born population percentage significantly below state average.
Renting percentage significantly below state average.
Length of stay since moving in significantly above state average.
Number of college students below state average.
Percentage of population with a bachelor's degree or higher significantly below state average.
Averages for the 2020 tax year for zip code 17068, filed in 2021:
Average Adjusted Gross Income (AGI) in 2020: $58,659 (Individual Income Tax Returns)
Here:
$58,659
State:
$75,707
Salary/wage: $51,105 (reported on 79.8% of returns)
Here:
$51,105
State:
$62,806
(% of AGI for various income ranges: 1097.8% for AGIs below $25k, 3494.2% for AGIs $25k-50k, 6464.2% for AGIs $50k-75k, 9224.4% for AGIs $75k-100k, 16683.5% for AGIs $100k-200k)
Taxable interest for individuals: $1,175 (reported on 32.7% of returns)
This zip code:
$1,175
Pennsylvania:
$1,633
(% of AGI for various income ranges: 18.9% for AGIs below $25k, 26.7% for AGIs $25k-50k, 57.1% for AGIs $50k-75k, 71.9% for AGIs $75k-100k, 198.8% for AGIs $100k-200k)
Ordinary dividends: $3,297 (reported on 16.8% of returns)
Here:
$3,297
State:
$7,382
(% of AGI for various income ranges: 16.8% for AGIs below $25k, 37.7% for AGIs $25k-50k, 85.4% for AGIs $50k-75k, 101.2% for AGIs $75k-100k, 331.2% for AGIs $100k-200k)
Net capital gain/loss in AGI: +$8,850 (reported on 12.5% of returns)
Here:
+$8,850
State:
+$23,522
(% of AGI for various income ranges: 3.8% for AGIs below $25k, 21.9% for AGIs $25k-50k, 37.5% for AGIs $50k-75k, 66.9% for AGIs $75k-100k, 1174.1% for AGIs $100k-200k)
Profit/loss from business: +$11,908 (reported on 11.5% of returns)
Here:
+$11,908
State:
+$16,274
(% of AGI for various income ranges: 80.5% for AGIs below $25k, 136.3% for AGIs $25k-50k, 159.2% for AGIs $50k-75k, 215.6% for AGIs $75k-100k, 733.5% for AGIs $100k-200k)
Taxable individual retirement arrangement distribution: $12,057 (reported on 11.1% of returns)
17068:
$12,057
Pennsylvania:
$18,583
(% of AGI for various income ranges: 103.2% for AGIs below $25k, 92.1% for AGIs $25k-50k, 223.7% for AGIs $50k-75k, 381.9% for AGIs $75k-100k, 498.2% for AGIs $100k-200k)
Total itemized deductions: $27,400 (reported on 3.8% of returns)
Here:
$27,400
State:
$34,850
(% of AGI for various income ranges: 455.4% for AGIs $50k-75k, 646.5% for AGIs $100k-200k)
Charity contributions: $5,983 (reported on 2.9% of returns)
Here:
$5,983
State:
$12,392
(% of AGI for various income ranges: 57.9% for AGIs $50k-75k, 129.4% for AGIs $100k-200k)
Taxes paid: $6,712 (reported on 3.8% of returns)
17068:
$6,712
State:
$8,200
(% of AGI for various income ranges: 93.3% for AGIs $50k-75k, 184.1% for AGIs $100k-200k)
Earned income credit: $2,016 (reported on 12.0% of returns)
Here:
$2,016
State:
$2,100
(% of AGI for various income ranges: 75.9% for AGIs below $25k, 51.9% for AGIs $25k-50k)
Percentage of individuals using paid preparers for their 2020 taxes: 94.2%
Here:
94%
State:
92%
(% for various income ranges: 93.1% for AGIs below $25k, 94.7% for AGIs $25k-50k, 94.3% for AGIs $50k-75k, 91.7% for AGIs $75k-100k, 96.7% for AGIs $100k-200k, 100.0% for AGIs over 200k)
Averages for the 2012 tax year for zip code 17068, filed in 2013:
Average Adjusted Gross Income (AGI) in 2012: $46,107 (Individual Income Tax Returns)
Here:
$46,107
State:
$61,346
Salary/wage: $41,773 (reported on 83.9% of returns)
Here:
$41,773
State:
$51,902
(% of AGI for various income ranges: 73.5% for AGIs below $25k, 77.4% for AGIs $25k-50k, 77.8% for AGIs $50k-75k, 80.3% for AGIs $75k-100k, 71.7% for AGIs $100k-200k)
Taxable interest for individuals: $1,018 (reported on 38.0% of returns)
This zip code:
$1,018
Pennsylvania:
$1,588
(% of AGI for various income ranges: 1.6% for AGIs below $25k, 0.9% for AGIs $25k-50k, 0.6% for AGIs $50k-75k, 1.1% for AGIs $75k-100k, 0.7% for AGIs $100k-200k)
Ordinary dividends: $2,497 (reported on 17.6% of returns)
Here:
$2,497
State:
$5,827
(% of AGI for various income ranges: 1.0% for AGIs below $25k, 0.8% for AGIs $25k-50k, 1.2% for AGIs $50k-75k, 0.9% for AGIs $75k-100k, 0.9% for AGIs $100k-200k)
Net capital gain/loss in AGI: +$1,767 (reported on 10.2% of returns)
Here:
+$1,767
State:
+$14,495
(% of AGI for various income ranges: 1.6% for AGIs $100k-200k)
Profit/loss from business: +$8,308 (reported on 11.7% of returns)
Here:
+$8,308
State:
+$16,268
(% of AGI for various income ranges: 3.5% for AGIs below $25k, 1.7% for AGIs $25k-50k, 2.1% for AGIs $50k-75k, 3.0% for AGIs $75k-100k, 1.5% for AGIs $100k-200k)
Taxable individual retirement arrangement distribution: $11,668 (reported on 10.7% of returns)
17068:
$11,668
Pennsylvania:
$14,550
(% of AGI for various income ranges: 3.7% for AGIs below $25k, 2.5% for AGIs $25k-50k, 2.2% for AGIs $50k-75k, 2.1% for AGIs $75k-100k, 3.4% for AGIs $100k-200k)
Total itemized deductions: $17,041 (22% of AGI, reported on 26.3% of returns)
Here:
$17,041
State:
$23,538
Here:
21.9% of AGI
State:
18.4% of AGI
(% of AGI for various income ranges: 5.1% for AGIs below $25k, 8.3% for AGIs $25k-50k, 9.6% for AGIs $50k-75k, 11.2% for AGIs $75k-100k, 11.6% for AGIs $100k-200k)
Charity contributions: $2,505 (reported on 18.5% of returns)
Here:
$2,505
State:
$4,025
(% of AGI for various income ranges: 0.6% for AGIs below $25k, 0.7% for AGIs $25k-50k, 0.9% for AGIs $50k-75k, 1.4% for AGIs $75k-100k, 1.2% for AGIs $100k-200k)
Taxes paid: $6,291 (reported on 26.3% of returns)
17068:
$6,291
State:
$9,982
(% of AGI for various income ranges: 1.1% for AGIs below $25k, 2.3% for AGIs $25k-50k, 3.3% for AGIs $50k-75k, 4.3% for AGIs $75k-100k, 5.2% for AGIs $100k-200k)
Earned income credit: $1,943 (reported on 13.7% of returns)
Here:
$1,943
State:
$2,106
(% of AGI for various income ranges: 4.6% for AGIs below $25k, 0.6% for AGIs $25k-50k)
Percentage of individuals using paid preparers for their 2012 taxes: 53.7%
Here:
54%
State:
53%
(% for various income ranges: 48.7% for AGIs below $25k, 53.8% for AGIs $25k-50k, 57.9% for AGIs $50k-75k, 57.9% for AGIs $75k-100k, 60.0% for AGIs $100k-200k)
Averages for the 2004 tax year for zip code 17068, filed in 2005:
Average Adjusted Gross Income (AGI) in 2004: $38,905 (Individual Income Tax Returns)
Here:
$38,905
State:
$48,049
Salary/wage: $35,650 (reported on 87.2% of returns)
Here:
$35,650
State:
$42,646
(% of AGI for various income ranges: 94.6% for AGIs below $10k, 76.7% for AGIs $10k-25k, 83.3% for AGIs $25k-50k, 81.6% for AGIs $50k-75k, 86.7% for AGIs $75k-100k, 63.6% for AGIs over 100k)
Taxable interest for individuals: $1,239 (reported on 48.5% of returns)
This zip code:
$1,239
Pennsylvania:
$1,657
(% of AGI for various income ranges: 4.9% for AGIs below $10k, 2.0% for AGIs $10k-25k, 1.1% for AGIs $25k-50k, 2.1% for AGIs $50k-75k, 1.0% for AGIs $75k-100k, 1.5% for AGIs over 100k)
Taxable dividends: $1,841 (reported on 21.1% of returns)
Here:
$1,841
State:
$3,566
(% of AGI for various income ranges: 3.3% for AGIs below $10k, 0.5% for AGIs $10k-25k, 0.5% for AGIs $25k-50k, 0.9% for AGIs $50k-75k, 1.3% for AGIs $75k-100k, 1.7% for AGIs over 100k)
Net capital gain/loss: +$5,925 (reported on 13.8% of returns)
Here:
+$5,925
State:
+$9,716
(% of AGI for various income ranges: -0.7% for AGIs below $10k, 0.8% for AGIs $10k-25k, -0.0% for AGIs $25k-50k, 0.7% for AGIs $50k-75k, 1.2% for AGIs $75k-100k, 10.4% for AGIs over 100k)
Profit/loss from business: +$7,166 (reported on 13.0% of returns)
Here:
+$7,166
State:
+$14,267
(% of AGI for various income ranges: 8.5% for AGIs below $10k, 3.9% for AGIs $10k-25k, 1.4% for AGIs $25k-50k, 2.5% for AGIs $50k-75k, 1.2% for AGIs $75k-100k, 3.7% for AGIs over 100k)
IRA payment deduction: $2,085 (reported on 2.3% of returns)
17068:
$2,085
Pennsylvania:
$2,903
Total itemized deductions: $14,366 (22% of AGI, reported on 26.9% of returns)
Here:
$14,366
State:
$18,804
Here:
22.0% of AGI
State:
19.5% of AGI
(% of AGI for various income ranges: 7.9% for AGIs $10k-25k, 8.1% for AGIs $25k-50k, 9.9% for AGIs $50k-75k, 11.5% for AGIs $75k-100k, 13.7% for AGIs over 100k)
Charity contributions deductions: $2,411 (3% of AGI, reported on 20.6% of returns)
Here:
$2,411
State:
$3,337
Here:
3.4% of AGI
State:
3.3% of AGI
(% of AGI for various income ranges: 1.1% for AGIs $10k-25k, 0.6% for AGIs $25k-50k, 0.8% for AGIs $50k-75k, 1.4% for AGIs $75k-100k, 3.4% for AGIs over 100k)
Total tax: $4,550 (reported on 76.2% of returns)
17068:
$4,550
State:
$8,008
(% of AGI for various income ranges: 2.3% for AGIs below $10k, 4.5% for AGIs $10k-25k, 7.0% for AGIs $25k-50k, 8.9% for AGIs $50k-75k, 10.3% for AGIs $75k-100k, 14.3% for AGIs over 100k)
Earned income credit: $1,570 (reported on 12.3% of returns)
Here:
$1,570
State:
$1,643
Percentage of individuals using paid preparers for their 2004 taxes: 56.4%
Here:
56%
State:
56%
(% for various income ranges: 42.3% for AGIs below $10k, 60.9% for AGIs $10k-25k, 57.7% for AGIs $25k-50k, 60.1% for AGIs $50k-75k, 51.8% for AGIs $75k-100k, 74.7% for AGIs over 100k)
Likely homosexual households (counted as self-reported same-sex unmarried-partner households)
Lesbian couples: 0.5% of all households
Gay men: 0.0% of all households
Household received Food Stamps/SNAP in the past 12 months: 193 Household did not receive Food Stamps/SNAP in the past 12 months: 1,493
Women who had a birth in the past 12 months: 4 (4 now married, 0 unmarried) Women who did not have a birth in the past 12 months: 854 (409 now married, 442 unmarried)
Housing units in zip code 17068 with a mortgage: 759 (78 second mortgage, 70 both second mortgage and home equity loan) Houses without a mortgage: 24
Median monthly owner costs for units with a mortgage: $1,368 Median monthly owner costs for units without a mortgage: $607
Residents with income below the poverty level in 2022:
This zip code:
10.8%
Whole state:
11.8%
Residents with income below 50% of the poverty level in 2022:
This zip code:
3.4%
Whole state:
6.1%
Median number of rooms in houses and condos:
Here:
6.3
State:
6.8
Median number of rooms in apartments:
Here:
4.9
State:
4.3
Notable locations in this zip code not listed on our city pages
Parks in zip code 17068 include: Little Juniata Park (1), State Game Lands Number 256 (2), Little Buffalo State Park (3). Display/hide their locations on the map
In group quarters: 315 (-1 institutionalized population)
Size of family households: 584 2-persons, 349 3-persons, 159 4-persons, 74 5-persons, 22 6-persons, 7 7-or-more-persons
Size of nonfamily households: 372 1-person, 116 2-persons
384 married couples with children.
164 single-parent households (38 men, 126 women).
96.6% of residents of 17068 zip code speak English at home.
1.8% of residents speak Spanish at home (38% very well, 8% well, 15% not well, 39% not at all).
1.0% of residents speak other Indo-European language at home (88% very well, 12% well).
0.3% of residents speak Asian or Pacific Island language at home (100% not well).
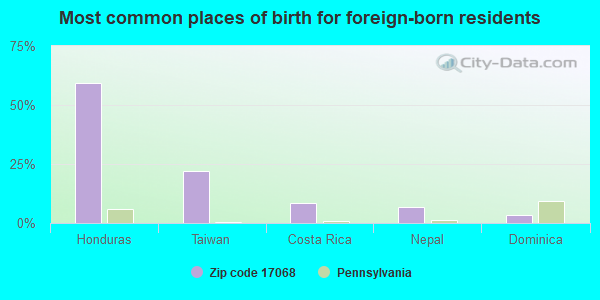
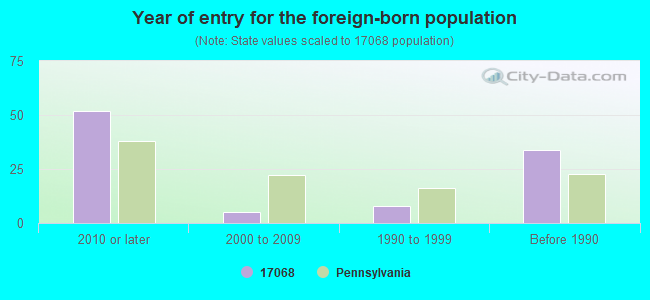
Foreign born population: 58 (1.3%) (16.3% of them are naturalized citizens)
This zip code:
1.3%
Whole state:
7.5%
59%Honduras
22%Taiwan
8%Costa Rica
7%Nepal
3%Dominica
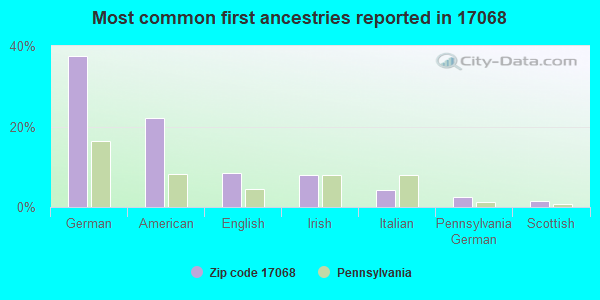
37%German
22%American
9%English
8%Irish
4%Italian
3%Pennsylvania German
2%Scottish
Year of entry for the foreign-born population
522010 or later
52000 to 2009
81990 to 1999
34Before 1990
Facilities with environmental interests located in this zip code:
BLOOMFIELD MUNICIPAL AUTH (PO BOX 155 in NEW BLOOMFIELD, PA)
(Integrated Compliance Information System) - ICIS-03-1995-0019, FORMAL ENFORCEMENT ACTION
BELMONT PONTIAC (RT. 34 in NEW BLOOMFIELD, PA)
AIR MINOR (AIRS/AFS) Business SIC classification: MOTOR VEHICLE DEALERS (NEW AND USED)
BLOOMFIELD BOROUGH (BARNETT RD in NEW BLOOMFIELD, PA)
National Pollutant Discharge Elimination System NON-MAJOR (Tracking pollutant discharge elimination systems) - permit Business SIC classification: SEWERAGE SYSTEMS
Housing units lacking complete plumbing facilities: 0.6% Housing units lacking complete kitchen facilities: 0.7%
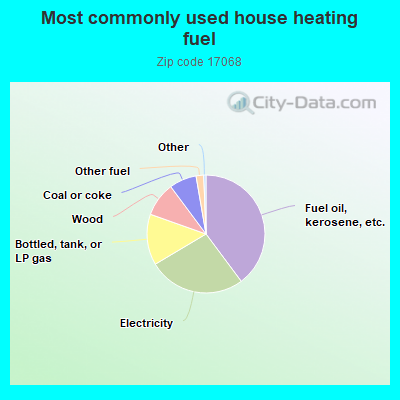
39.9%Fuel oil, kerosene, etc.
26.7%Electricity
14.0%Bottled, tank, or LP gas
9.4%Wood
7.5%Coal or coke
2.1%Other fuel
Population in 1990: 3,066. Population change in the 1990s: +845 (+27.6%).
Place of birth for U.S.-born residents:
This state: 3,839
Northeast: 107
Midwest: 103
South: 179
West: 64
62% of the 17068 zip code residents lived in the same house 5 years ago. Out of people who lived in different houses, 67% lived in this county. Out of people who lived in different counties, 50% lived in Pennsylvania.
94% of the 17068 zip code residents lived in the same house 1 year ago. Out of people who lived in different houses, 66% moved from this county. Out of people who lived in different houses, 29% moved from different county within same state. Out of people who lived in different houses, 4% moved from different state. Out of people who lived in different houses, 1% moved from abroad.
Private vs. public school enrollment:
Students in private schools in grades 1 to 8 (elementary and middle school):
Here:
0.0%
Pennsylvania:
15.7%
Students in private schools in grades 9 to 12 (high school): 19
Here:
9.5%
Pennsylvania:
13.4%
Students in private undergraduate colleges: 33
Here:
32.8%
Pennsylvania:
39.8%
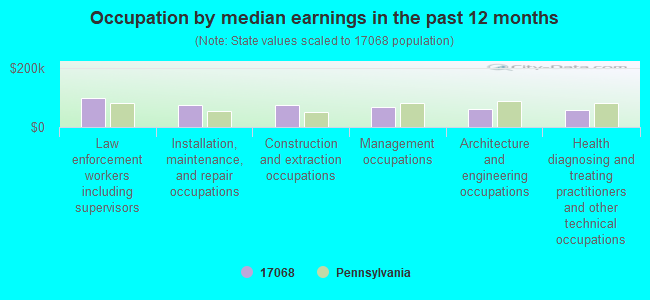
Occupation by median earnings in the past 12 months ($)
99,338Law enforcement workers including supervisors
74,204Installation, maintenance, and repair occupations
73,852Construction and extraction occupations
66,537Management occupations
62,536Architecture and engineering occupations
59,200Health diagnosing and treating practitioners and other technical occupations
Companies with federal contracts located in this zip code:
JOHN B WHEATLEY (RR 2 BOX 813 in NEW BLOOMFIELD, PA; small business) : $28,474 in 3 contractsin 2002
$12,810 with Army for Other Professional Services. Signed on 2002-07-19. Completion date: 2003-01-31.
$9,003, same as above.Signed on 2002-07-19. Completion date: 2003-01-31.
$6,661, same as above.Signed on 2002-07-19. Completion date: 2003-01-31.
CONSERVATION CONCEPTS INC (375 SANDY HOLLOW CHURCH RO in NEW BLOOMFIELD, PA; small business) : $9,685 in 2 contractsfrom 2004 to 2005
$4,910 with Navy for Construction of Structures and Facilities -- Miscellaneous Buildings. Signed on 2004-09-14. Completion date: 2004-10-13.
$4,775 with Army for Crystal and Glass Industries Machinery. Signed on 2005-01-04. Completion date: 2005-02-25.
Top industries in this zip code by the number of employees in 2005:
Health Care and Social Assistance: Nursing Care Facilities (100-249 employees: 1 establishment)
Accommodation and Food Services: Food Service Contractors (50-99: 1, 5-9: 1)
Accommodation and Food Services: Full-Service Restaurants (10-19: 2, 1-4: 2)
Wholesale Trade: Recyclable Material Merchant Wholesalers (20-49: 1)
Educational Services: Elementary and Secondary Schools (20-49: 1)
Information: Newspaper Publishers (20-49: 1)
Administrative and Support and Waste Management and Remediation Services: Remediation Services (20-49: 1)
Professional, Scientific, and Technical Services: Surveying and Mapping (except Geophysical) Services (10-19: 1, 5-9: 2)
People in group quarters in 2010:
141 people in workers' group living quarters and job corps centers
115 people in nursing facilities/skilled-nursing facilities
113 people in local jails and other municipal confinement facilities
People in group quarters in 2000:
110 people in nursing homes
76 people in local jails and other confinement facilities (including police lockups)
Fatal accident statistics in 2014:
Fatal accident count: 1
Vehicles involved in fatal accidents: 1
Fatal accidents caused by drunken drivers: 0
Fatalities: 1
Persons involved in fatal accidents: 1
Pedestrians involved in fatal accidents: 0
Fatal accident statistics in 2013:
Fatal accident count: 1
Vehicles involved in fatal accidents: 1
Fatal accidents caused by drunken drivers: 1
Fatalities: 1
Persons involved in fatal accidents: 1
Pedestrians involved in fatal accidents: 0
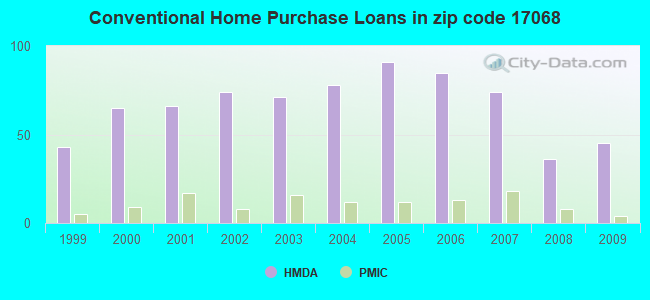
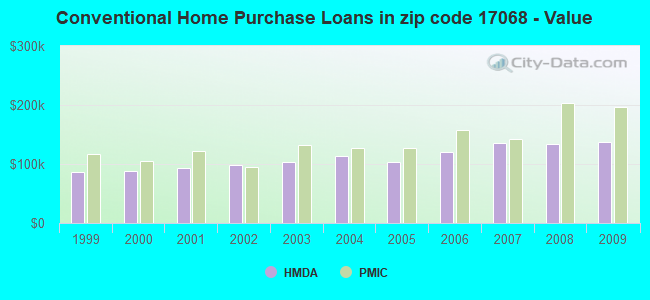
Home Mortgage Disclosure Act Aggregated Statistics For Year 2009 (Based on 4 partial tracts)
A) FHA, FSA/RHS & VA Home Purchase Loans
B) Conventional Home Purchase Loans
C) Refinancings
D) Home Improvement Loans
F) Non-occupant Loans on < 5 Family Dwellings (A B C & D)
G) Loans On Manufactured Home Dwelling (A B C & D)
Number
Average Value
Number
Average Value
Number
Average Value
Number
Average Value
Number
Average Value
Number
Average Value
LOANS ORIGINATED
17
$166,754
45
$136,786
182
$129,132
35
$52,113
9
$87,616
13
$58,328
APPLICATIONS APPROVED, NOT ACCEPTED
2
$79,740
2
$107,705
10
$133,369
2
$54,210
0
$0
2
$19,520
APPLICATIONS DENIED
2
$129,980
16
$81,414
50
$143,758
13
$20,027
2
$44,020
13
$55,185
APPLICATIONS WITHDRAWN
3
$182,273
7
$127,037
28
$156,901
2
$207,650
1
$29,070
2
$68,975
FILES CLOSED FOR INCOMPLETENESS
2
$95,105
1
$27,410
8
$168,984
2
$111,300
0
$0
2
$53,575
Aggregated Statistics For Year 2008 (Based on 4 partial tracts)
A) FHA, FSA/RHS & VA Home Purchase Loans
B) Conventional Home Purchase Loans
C) Refinancings
D) Home Improvement Loans
F) Non-occupant Loans on < 5 Family Dwellings (A B C & D)
G) Loans On Manufactured Home Dwelling (A B C & D)
Number
Average Value
Number
Average Value
Number
Average Value
Number
Average Value
Number
Average Value
Number
Average Value
LOANS ORIGINATED
14
$160,145
36
$133,133
144
$110,728
47
$60,582
17
$136,169
14
$48,854
APPLICATIONS APPROVED, NOT ACCEPTED
1
$113,790
4
$63,178
14
$115,821
1
$41,530
1
$85,770
4
$47,625
APPLICATIONS DENIED
5
$144,506
15
$104,400
79
$145,162
18
$51,378
2
$65,390
11
$69,658
APPLICATIONS WITHDRAWN
1
$175,320
9
$117,254
26
$128,583
3
$69,667
2
$68,940
4
$47,458
FILES CLOSED FOR INCOMPLETENESS
0
$0
2
$224,185
5
$196,644
0
$0
0
$0
0
$0
Aggregated Statistics For Year 2007 (Based on 4 partial tracts)
A) FHA, FSA/RHS & VA Home Purchase Loans
B) Conventional Home Purchase Loans
C) Refinancings
D) Home Improvement Loans
F) Non-occupant Loans on < 5 Family Dwellings (A B C & D)
G) Loans On Manufactured Home Dwelling (A B C & D)
Number
Average Value
Number
Average Value
Number
Average Value
Number
Average Value
Number
Average Value
Number
Average Value
LOANS ORIGINATED
6
$114,633
74
$135,449
140
$104,571
49
$46,204
18
$183,629
18
$67,018
APPLICATIONS APPROVED, NOT ACCEPTED
0
$0
5
$116,264
16
$130,700
7
$58,474
1
$56,480
2
$72,710
APPLICATIONS DENIED
1
$67,040
26
$124,915
94
$124,251
25
$30,725
4
$32,902
18
$54,209
APPLICATIONS WITHDRAWN
1
$115,450
8
$110,261
43
$153,483
2
$87,400
0
$0
3
$67,557
FILES CLOSED FOR INCOMPLETENESS
0
$0
2
$133,460
11
$166,340
1
$9,970
0
$0
0
$0
Aggregated Statistics For Year 2006 (Based on 4 partial tracts)
A) FHA, FSA/RHS & VA Home Purchase Loans
B) Conventional Home Purchase Loans
C) Refinancings
D) Home Improvement Loans
F) Non-occupant Loans on < 5 Family Dwellings (A B C & D)
G) Loans On Manufactured Home Dwelling (A B C & D)
Number
Average Value
Number
Average Value
Number
Average Value
Number
Average Value
Number
Average Value
Number
Average Value
LOANS ORIGINATED
3
$146,357
85
$119,977
159
$91,567
69
$44,790
9
$98,462
17
$53,148
APPLICATIONS APPROVED, NOT ACCEPTED
1
$163,020
9
$103,933
23
$98,964
6
$35,527
0
$0
3
$56,753
APPLICATIONS DENIED
0
$0
14
$72,366
93
$103,658
21
$53,578
2
$66,450
13
$40,599
APPLICATIONS WITHDRAWN
1
$62,300
3
$156,780
67
$127,757
7
$95,454
0
$0
0
$0
FILES CLOSED FOR INCOMPLETENESS
0
$0
2
$112,960
14
$130,054
2
$127,460
0
$0
0
$0
Aggregated Statistics For Year 2005 (Based on 4 partial tracts)
A) FHA, FSA/RHS & VA Home Purchase Loans
B) Conventional Home Purchase Loans
C) Refinancings
D) Home Improvement Loans
F) Non-occupant Loans on < 5 Family Dwellings (A B C & D)
G) Loans On Manufactured Home Dwelling (A B C & D)
Number
Average Value
Number
Average Value
Number
Average Value
Number
Average Value
Number
Average Value
Number
Average Value
LOANS ORIGINATED
4
$146,332
91
$103,315
162
$90,773
71
$41,575
11
$65,595
16
$45,408
APPLICATIONS APPROVED, NOT ACCEPTED
0
$0
6
$94,800
16
$110,390
6
$24,098
1
$82,230
2
$26,165
APPLICATIONS DENIED
0
$0
31
$67,243
93
$109,620
29
$69,499
6
$77,535
19
$43,922
APPLICATIONS WITHDRAWN
0
$0
12
$112,767
69
$123,293
8
$129,468
1
$99,360
4
$61,595
FILES CLOSED FOR INCOMPLETENESS
0
$0
1
$55,870
16
$132,102
1
$108,660
0
$0
0
$0
Aggregated Statistics For Year 2004 (Based on 4 partial tracts)
A) FHA, FSA/RHS & VA Home Purchase Loans
B) Conventional Home Purchase Loans
C) Refinancings
D) Home Improvement Loans
E) Loans on Dwellings For 5+ Families
F) Non-occupant Loans on < 5 Family Dwellings (A B C & D)
G) Loans On Manufactured Home Dwelling (A B C & D)
Number
Average Value
Number
Average Value
Number
Average Value
Number
Average Value
Number
Average Value
Number
Average Value
Number
Average Value
LOANS ORIGINATED
7
$124,319
78
$113,166
196
$89,778
69
$37,051
1
$88,040
20
$81,952
24
$53,888
APPLICATIONS APPROVED, NOT ACCEPTED
1
$74,290
9
$107,128
21
$99,643
2
$37,865
0
$0
0
$0
2
$51,950
APPLICATIONS DENIED
1
$65,530
17
$80,188
93
$116,363
20
$29,515
0
$0
2
$15,365
10
$60,058
APPLICATIONS WITHDRAWN
0
$0
15
$129,013
62
$109,071
3
$27,460
0
$0
2
$149,430
3
$51,497
FILES CLOSED FOR INCOMPLETENESS
1
$135,390
0
$0
18
$116,445
1
$101,560
0
$0
0
$0
0
$0
Aggregated Statistics For Year 2003 (Based on 4 partial tracts)
A) FHA, FSA/RHS & VA Home Purchase Loans
B) Conventional Home Purchase Loans
C) Refinancings
D) Home Improvement Loans
F) Non-occupant Loans on < 5 Family Dwellings (A B C & D)
Number
Average Value
Number
Average Value
Number
Average Value
Number
Average Value
Number
Average Value
LOANS ORIGINATED
5
$108,156
71
$103,502
302
$98,223
38
$27,141
12
$69,523
APPLICATIONS APPROVED, NOT ACCEPTED
0
$0
8
$111,731
28
$87,955
1
$29,750
0
$0
APPLICATIONS DENIED
0
$0
19
$58,474
99
$97,979
14
$39,004
2
$56,140
APPLICATIONS WITHDRAWN
1
$118,390
7
$102,494
65
$106,313
6
$35,477
2
$58,065
FILES CLOSED FOR INCOMPLETENESS
0
$0
4
$147,788
6
$109,285
2
$137,800
1
$149,510
Aggregated Statistics For Year 2002 (Based on 4 partial tracts)
A) FHA, FSA/RHS & VA Home Purchase Loans
B) Conventional Home Purchase Loans
C) Refinancings
D) Home Improvement Loans
F) Non-occupant Loans on < 5 Family Dwellings (A B C & D)
Number
Average Value
Number
Average Value
Number
Average Value
Number
Average Value
Number
Average Value
LOANS ORIGINATED
8
$117,326
74
$98,476
176
$90,252
28
$27,468
16
$49,981
APPLICATIONS APPROVED, NOT ACCEPTED
0
$0
11
$65,384
25
$103,022
5
$17,018
0
$0
APPLICATIONS DENIED
0
$0
32
$46,140
68
$89,366
11
$18,390
4
$67,695
APPLICATIONS WITHDRAWN
1
$78,820
8
$89,240
41
$102,630
3
$91,843
1
$159,480
FILES CLOSED FOR INCOMPLETENESS
0
$0
0
$0
14
$102,608
0
$0
0
$0
Aggregated Statistics For Year 2001 (Based on 4 partial tracts)
A) FHA, FSA/RHS & VA Home Purchase Loans
B) Conventional Home Purchase Loans
C) Refinancings
D) Home Improvement Loans
F) Non-occupant Loans on < 5 Family Dwellings (A B C & D)
Number
Average Value
Number
Average Value
Number
Average Value
Number
Average Value
Number
Average Value
LOANS ORIGINATED
10
$116,278
66
$92,953
169
$85,042
47
$26,227
6
$48,753
APPLICATIONS APPROVED, NOT ACCEPTED
0
$0
11
$52,943
31
$83,239
5
$30,006
0
$0
APPLICATIONS DENIED
0
$0
40
$66,989
81
$73,750
12
$18,216
3
$84,343
APPLICATIONS WITHDRAWN
0
$0
3
$136,487
34
$85,239
5
$13,894
0
$0
FILES CLOSED FOR INCOMPLETENESS
1
$75,580
0
$0
11
$115,054
1
$26,050
0
$0
Aggregated Statistics For Year 2000 (Based on 4 partial tracts)
A) FHA, FSA/RHS & VA Home Purchase Loans
B) Conventional Home Purchase Loans
C) Refinancings
D) Home Improvement Loans
F) Non-occupant Loans on < 5 Family Dwellings (A B C & D)
Number
Average Value
Number
Average Value
Number
Average Value
Number
Average Value
Number
Average Value
LOANS ORIGINATED
10
$108,141
65
$88,362
78
$67,866
39
$21,399
4
$46,495
APPLICATIONS APPROVED, NOT ACCEPTED
1
$48,020
13
$54,465
20
$65,124
9
$19,472
0
$0
APPLICATIONS DENIED
1
$73,920
45
$46,988
59
$77,325
19
$31,924
2
$88,080
APPLICATIONS WITHDRAWN
1
$145,420
6
$85,902
15
$74,863
3
$32,793
0
$0
FILES CLOSED FOR INCOMPLETENESS
0
$0
1
$123,760
19
$91,436
0
$0
1
$9,970
Aggregated Statistics For Year 1999 (Based on 2 partial tracts)
A) FHA, FSA/RHS & VA Home Purchase Loans
B) Conventional Home Purchase Loans
C) Refinancings
D) Home Improvement Loans
F) Non-occupant Loans on < 5 Family Dwellings (A B C & D)
Detailed PMIC statistics for the following Tracts:0303.02
, 0305.02
2005 - 2018 National Fire Incident Reporting System (NFIRS) incidents
Based on the data from the years 2005 - 2018 the average number of fire incidents per year is 17. The highest number of fire incidents - 42 took place in 2015, and the least - 0 in 2006. The data has an increasing trend.
When looking into fire subcategories, the most reports belonged to: Structure Fires (68.8%), and Outside Fires (22.4%).
Fire incident types reported to NFIRS in Zip Code 17068


 Nearest zip codes: 17074, 17090, 17024, 17062, 17020, 17040.
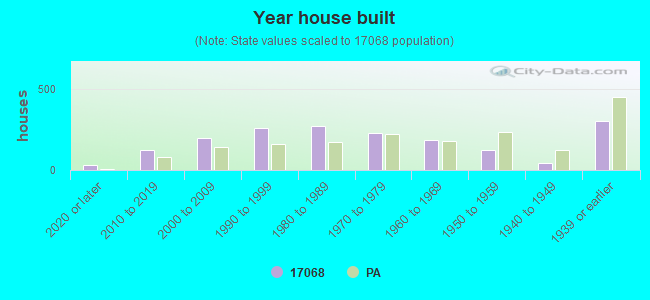


 Based on the data from the years 2005 - 2018 the average number of fire incidents per year is 17. The highest number of fire incidents - 42 took place in 2015, and the least - 0 in 2006. The data has an increasing trend.
 When looking into fire subcategories, the most reports belonged to: Structure Fires (68.8%), and Outside Fires (22.4%).