Estimated zip code population in 2022: 26,495 Zip code population in 2010: 23,131 Zip code population in 2000: 23,356
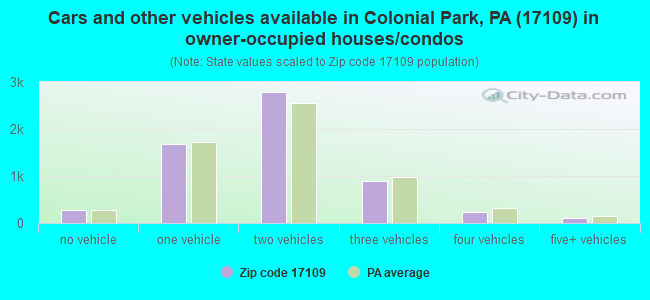
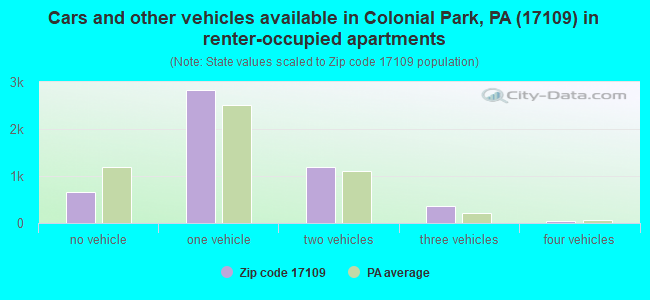
Houses and condos: 11,573 Renter-occupied apartments: 5,104
% of renters here:
46%
State:
31%
March 2022 cost of living index in zip code 17109: 96.2 (near average, U.S. average is 100)
Land area: 7.5 sq. mi. Water area: 0.0 sq. mi.
Population density: 3,525 people per square mile
(average).
OSM Map
General Map
Google Map
MSN Map
OSM Map
General Map
Google Map
MSN Map
OSM Map
General Map
Google Map
MSN Map
OSM Map
General Map
Google Map
MSN Map
Please wait while loading the map...
Real estate property taxes paid for housing units in 2022:
This zip code:
1.3% ($2,648)
Pennsylvania:
1.3% ($3,094)
Median real estate property taxes paid for housing units with mortgages in 2022: $2,795 (1.4%) Median real estate property taxes paid for housing units with no mortgage in 2022: $2,332 (1.2%)
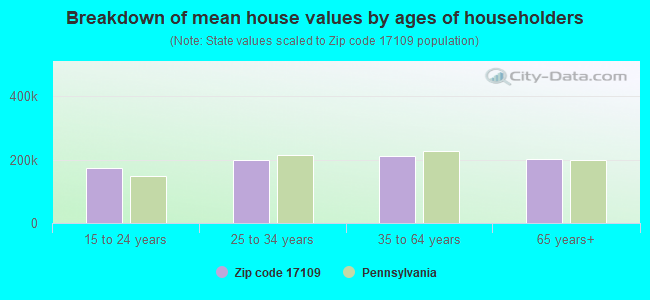
Estimated median house/condo value in 2022: $200,025
17109:
$200,025
Pennsylvania:
$245,500
According to our research of Pennsylvania and other state lists, there were 38 registered sex offenders living in 17109 zip code as of April 27, 2024. The ratio of all residents to sex offenders in zip code 17109 is 626 to 1. The ratio of registered sex offenders to all residents in this zip code is near the state average.
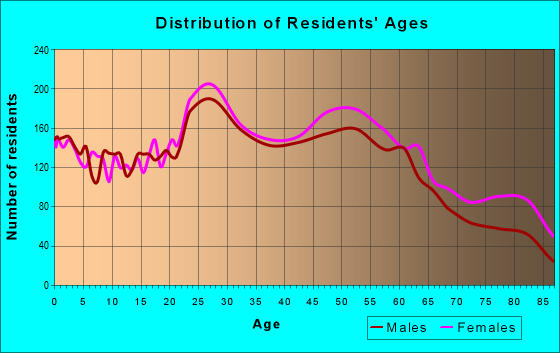
Median resident age:
This zip code:
36.2 years
Pennsylvania median age:
40.9 years
Average household size:
This zip code:
2.4 people
Pennsylvania:
2.4 people
Averages for the 2020 tax year for zip code 17109, filed in 2021:
Average Adjusted Gross Income (AGI) in 2020: $48,461 (Individual Income Tax Returns)
Here:
$48,461
State:
$75,707
Salary/wage: $43,147 (reported on 82.6% of returns)
Here:
$43,147
State:
$62,806
(% of AGI for various income ranges: 1201.6% for AGIs below $25k, 3498.8% for AGIs $25k-50k, 6055.1% for AGIs $50k-75k, 8748.2% for AGIs $75k-100k, 15077.7% for AGIs $100k-200k, 49712.5% for AGIs over 200k)
Taxable interest for individuals: $927 (reported on 20.5% of returns)
This zip code:
$927
Pennsylvania:
$1,633
(% of AGI for various income ranges: 8.9% for AGIs below $25k, 10.8% for AGIs $25k-50k, 30.7% for AGIs $50k-75k, 40.6% for AGIs $75k-100k, 108.0% for AGIs $100k-200k, 467.5% for AGIs over 200k)
Ordinary dividends: $3,085 (reported on 13.0% of returns)
Here:
$3,085
State:
$7,382
(% of AGI for various income ranges: 12.1% for AGIs below $25k, 18.9% for AGIs $25k-50k, 57.0% for AGIs $50k-75k, 78.6% for AGIs $75k-100k, 247.7% for AGIs $100k-200k, 2040.0% for AGIs over 200k)
Net capital gain/loss in AGI: +$6,512 (reported on 10.4% of returns)
Here:
+$6,512
State:
+$23,522
(% of AGI for various income ranges: 4.3% for AGIs below $25k, 15.5% for AGIs $25k-50k, 39.7% for AGIs $50k-75k, 82.0% for AGIs $75k-100k, 295.9% for AGIs $100k-200k, 12010.0% for AGIs over 200k)
Profit/loss from business: +$7,360 (reported on 11.0% of returns)
Here:
+$7,360
State:
+$16,274
(% of AGI for various income ranges: 55.6% for AGIs below $25k, 90.8% for AGIs $25k-50k, 94.8% for AGIs $50k-75k, 165.7% for AGIs $75k-100k, 252.3% for AGIs $100k-200k, 2215.0% for AGIs over 200k)
Taxable individual retirement arrangement distribution: $12,809 (reported on 7.9% of returns)
17109:
$12,809
Pennsylvania:
$18,583
(% of AGI for various income ranges: 45.0% for AGIs below $25k, 58.0% for AGIs $25k-50k, 129.0% for AGIs $50k-75k, 312.3% for AGIs $75k-100k, 673.1% for AGIs $100k-200k)
Total itemized deductions: $30,880 (reported on 3.7% of returns)
Here:
$30,880
State:
$34,850
(% of AGI for various income ranges: 24.5% for AGIs below $25k, 55.5% for AGIs $25k-50k, 210.6% for AGIs $50k-75k, 301.9% for AGIs $75k-100k, 463.2% for AGIs $100k-200k, 7047.5% for AGIs over 200k)
Charity contributions: $8,346 (reported on 2.6% of returns)
Here:
$8,346
State:
$12,392
(% of AGI for various income ranges: 8.3% for AGIs $25k-50k, 27.4% for AGIs $50k-75k, 58.3% for AGIs $75k-100k, 141.8% for AGIs $100k-200k, 1435.0% for AGIs over 200k)
Taxes paid: $8,492 (reported on 3.6% of returns)
17109:
$8,492
State:
$8,200
(% of AGI for various income ranges: 1.5% for AGIs below $25k, 19.8% for AGIs $25k-50k, 70.1% for AGIs $50k-75k, 94.4% for AGIs $75k-100k, 144.2% for AGIs $100k-200k, 650.0% for AGIs over 200k)
Earned income credit: $2,131 (reported on 18.6% of returns)
Here:
$2,131
State:
$2,100
(% of AGI for various income ranges: 89.0% for AGIs below $25k, 67.3% for AGIs $25k-50k, 1.0% for AGIs $50k-75k)
Percentage of individuals using paid preparers for their 2020 taxes: 92.4%
Here:
92%
State:
92%
(% for various income ranges: 91.8% for AGIs below $25k, 93.8% for AGIs $25k-50k, 92.7% for AGIs $50k-75k, 91.9% for AGIs $75k-100k, 89.2% for AGIs $100k-200k, 91.7% for AGIs over 200k)
Averages for the 2012 tax year for zip code 17109, filed in 2013:
Average Adjusted Gross Income (AGI) in 2012: $42,325 (Individual Income Tax Returns)
Here:
$42,325
State:
$61,346
Salary/wage: $37,831 (reported on 82.9% of returns)
Here:
$37,831
State:
$51,902
(% of AGI for various income ranges: 73.0% for AGIs below $25k, 81.1% for AGIs $25k-50k, 75.9% for AGIs $50k-75k, 75.4% for AGIs $75k-100k, 72.2% for AGIs $100k-200k, 37.4% for AGIs over 200k)
Taxable interest for individuals: $970 (reported on 29.9% of returns)
This zip code:
$970
Pennsylvania:
$1,588
(% of AGI for various income ranges: 1.2% for AGIs below $25k, 0.5% for AGIs $25k-50k, 0.5% for AGIs $50k-75k, 0.7% for AGIs $75k-100k, 0.7% for AGIs $100k-200k, 1.3% for AGIs over 200k)
Ordinary dividends: $2,700 (reported on 16.5% of returns)
Here:
$2,700
State:
$5,827
(% of AGI for various income ranges: 1.2% for AGIs below $25k, 0.6% for AGIs $25k-50k, 0.9% for AGIs $50k-75k, 0.9% for AGIs $75k-100k, 1.3% for AGIs $100k-200k, 3.2% for AGIs over 200k)
Net capital gain/loss in AGI: +$3,092 (reported on 10.3% of returns)
Here:
+$3,092
State:
+$14,495
(% of AGI for various income ranges: 0.3% for AGIs $50k-75k, 0.4% for AGIs $75k-100k, 0.8% for AGIs $100k-200k, 9.2% for AGIs over 200k)
Profit/loss from business: +$7,873 (reported on 9.5% of returns)
Here:
+$7,873
State:
+$16,268
(% of AGI for various income ranges: 4.4% for AGIs below $25k, 1.5% for AGIs $25k-50k, 1.1% for AGIs $50k-75k, 1.4% for AGIs $75k-100k, 2.2% for AGIs $100k-200k)
Taxable individual retirement arrangement distribution: $11,844 (reported on 10.5% of returns)
17109:
$11,844
Pennsylvania:
$14,550
(% of AGI for various income ranges: 3.0% for AGIs below $25k, 1.8% for AGIs $25k-50k, 2.5% for AGIs $50k-75k, 2.4% for AGIs $75k-100k, 4.3% for AGIs $100k-200k, 6.9% for AGIs over 200k)
Self-employment retirement plans: $6,200 (reported on 0.2% of returns)
17109:
$6,200
Pennsylvania:
$20,922
Total itemized deductions: $16,090 (21% of AGI, reported on 25.3% of returns)
Here:
$16,090
State:
$23,538
Here:
21.5% of AGI
State:
18.4% of AGI
(% of AGI for various income ranges: 6.5% for AGIs below $25k, 7.3% for AGIs $25k-50k, 10.2% for AGIs $50k-75k, 12.1% for AGIs $75k-100k, 12.1% for AGIs $100k-200k, 9.7% for AGIs over 200k)
Charity contributions: $3,091 (reported on 19.2% of returns)
Here:
$3,091
State:
$4,025
(% of AGI for various income ranges: 0.6% for AGIs below $25k, 0.9% for AGIs $25k-50k, 1.4% for AGIs $50k-75k, 1.9% for AGIs $75k-100k, 2.2% for AGIs $100k-200k, 1.8% for AGIs over 200k)
Taxes paid: $5,719 (reported on 25.0% of returns)
17109:
$5,719
State:
$9,982
(% of AGI for various income ranges: 1.1% for AGIs below $25k, 2.1% for AGIs $25k-50k, 3.7% for AGIs $50k-75k, 4.6% for AGIs $75k-100k, 5.1% for AGIs $100k-200k, 3.8% for AGIs over 200k)
Earned income credit: $2,052 (reported on 18.8% of returns)
Here:
$2,052
State:
$2,106
(% of AGI for various income ranges: 5.5% for AGIs below $25k, 1.0% for AGIs $25k-50k)
Percentage of individuals using paid preparers for their 2012 taxes: 41.7%
Here:
42%
State:
53%
(% for various income ranges: 38.7% for AGIs below $25k, 41.2% for AGIs $25k-50k, 44.6% for AGIs $50k-75k, 43.1% for AGIs $75k-100k, 49.4% for AGIs $100k-200k, 87.5% for AGIs over 200k)
Averages for the 2004 tax year for zip code 17109, filed in 2005:
Average Adjusted Gross Income (AGI) in 2004: $37,555 (Individual Income Tax Returns)
Here:
$37,555
State:
$48,049
Salary/wage: $35,251 (reported on 84.0% of returns)
Here:
$35,251
State:
$42,646
(% of AGI for various income ranges: 83.4% for AGIs below $10k, 73.2% for AGIs $10k-25k, 81.5% for AGIs $25k-50k, 81.0% for AGIs $50k-75k, 81.3% for AGIs $75k-100k, 71.8% for AGIs over 100k)
Taxable interest for individuals: $1,251 (reported on 43.7% of returns)
This zip code:
$1,251
Pennsylvania:
$1,657
(% of AGI for various income ranges: 4.5% for AGIs below $10k, 2.2% for AGIs $10k-25k, 1.3% for AGIs $25k-50k, 1.3% for AGIs $50k-75k, 1.2% for AGIs $75k-100k, 1.3% for AGIs over 100k)
Taxable dividends: $2,142 (reported on 22.2% of returns)
Here:
$2,142
State:
$3,566
(% of AGI for various income ranges: 3.2% for AGIs below $10k, 1.4% for AGIs $10k-25k, 0.8% for AGIs $25k-50k, 1.0% for AGIs $50k-75k, 1.1% for AGIs $75k-100k, 2.5% for AGIs over 100k)
Net capital gain/loss: +$3,421 (reported on 14.4% of returns)
Here:
+$3,421
State:
+$9,716
(% of AGI for various income ranges: -0.7% for AGIs below $10k, 0.2% for AGIs $10k-25k, 0.2% for AGIs $25k-50k, 0.4% for AGIs $50k-75k, 0.9% for AGIs $75k-100k, 6.2% for AGIs over 100k)
Profit/loss from business: +$6,811 (reported on 9.2% of returns)
Here:
+$6,811
State:
+$14,267
(% of AGI for various income ranges: 2.8% for AGIs below $10k, 2.4% for AGIs $10k-25k, 1.7% for AGIs $25k-50k, 1.4% for AGIs $50k-75k, 1.3% for AGIs $75k-100k, 1.7% for AGIs over 100k)
IRA payment deduction: $2,451 (reported on 1.7% of returns)
17109:
$2,451
Pennsylvania:
$2,903
(% of AGI for various income ranges: 0.1% for AGIs $10k-25k, 0.2% for AGIs $25k-50k, 0.1% for AGIs $50k-75k, 0.1% for AGIs $75k-100k, 0.0% for AGIs over 100k)
Self-employed pension: $4,976 (reported on 0.3% of returns)
Here:
$4,976
Pennsylvania:
$14,674
Total itemized deductions: $14,216 (22% of AGI, reported on 27.8% of returns)
Here:
$14,216
State:
$18,804
Here:
22.0% of AGI
State:
19.5% of AGI
(% of AGI for various income ranges: 8.0% for AGIs below $10k, 6.6% for AGIs $10k-25k, 8.7% for AGIs $25k-50k, 12.3% for AGIs $50k-75k, 12.7% for AGIs $75k-100k, 12.4% for AGIs over 100k)
Charity contributions deductions: $2,798 (4% of AGI, reported on 23.7% of returns)
Here:
$2,798
State:
$3,337
Here:
4.2% of AGI
State:
3.3% of AGI
(% of AGI for various income ranges: 0.7% for AGIs below $10k, 0.9% for AGIs $10k-25k, 1.2% for AGIs $25k-50k, 1.9% for AGIs $50k-75k, 2.3% for AGIs $75k-100k, 2.8% for AGIs over 100k)
Total tax: $4,582 (reported on 78.0% of returns)
17109:
$4,582
State:
$8,008
(% of AGI for various income ranges: 1.8% for AGIs below $10k, 4.3% for AGIs $10k-25k, 7.7% for AGIs $25k-50k, 9.7% for AGIs $50k-75k, 11.1% for AGIs $75k-100k, 15.9% for AGIs over 100k)
Earned income credit: $1,504 (reported on 12.7% of returns)
Here:
$1,504
State:
$1,643
Percentage of individuals using paid preparers for their 2004 taxes: 48.6%
Here:
49%
State:
56%
(% for various income ranges: 41.0% for AGIs below $10k, 52.1% for AGIs $10k-25k, 49.4% for AGIs $25k-50k, 49.0% for AGIs $50k-75k, 48.8% for AGIs $75k-100k, 51.5% for AGIs over 100k)
Likely homosexual households (counted as self-reported same-sex unmarried-partner households)
Lesbian couples: 0.0% of all households
Gay men: 0.3% of all households
Household received Food Stamps/SNAP in the past 12 months: 772 Household did not receive Food Stamps/SNAP in the past 12 months: 10,263
Women who had a birth in the past 12 months: 271 (182 now married, 86 unmarried) Women who did not have a birth in the past 12 months: 6,314 (2,890 now married, 3,410 unmarried)
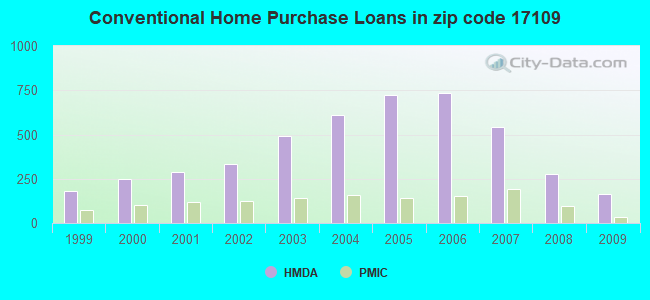
Housing units in zip code 17109 with a mortgage: 3,783 (426 second mortgage, 414 both second mortgage and home equity loan) Houses without a mortgage: 200
Median monthly owner costs for units with a mortgage: $1,407 Median monthly owner costs for units without a mortgage: $577
Residents with income below the poverty level in 2022:
This zip code:
11.3%
Whole state:
11.8%
Residents with income below 50% of the poverty level in 2022:
This zip code:
7.8%
Whole state:
6.1%
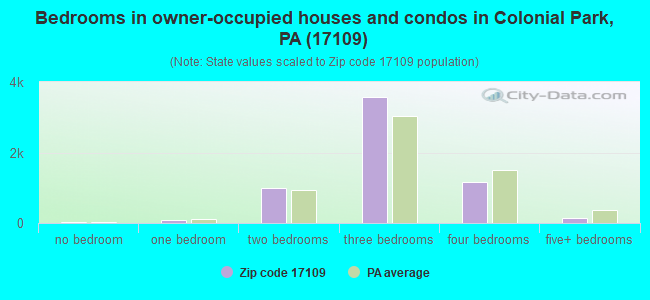
Median number of rooms in houses and condos:
Here:
6.3
State:
6.8
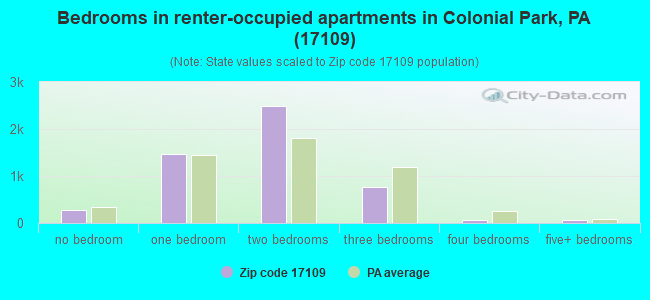
Median number of rooms in apartments:
Here:
4.2
State:
4.3
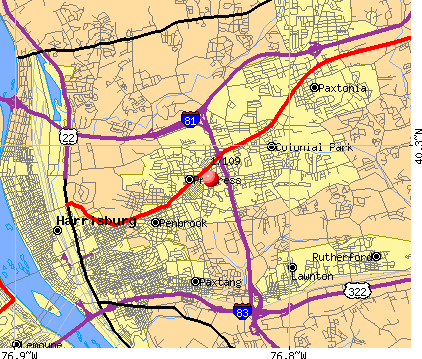
Notable locations in this zip code not listed on our city pages
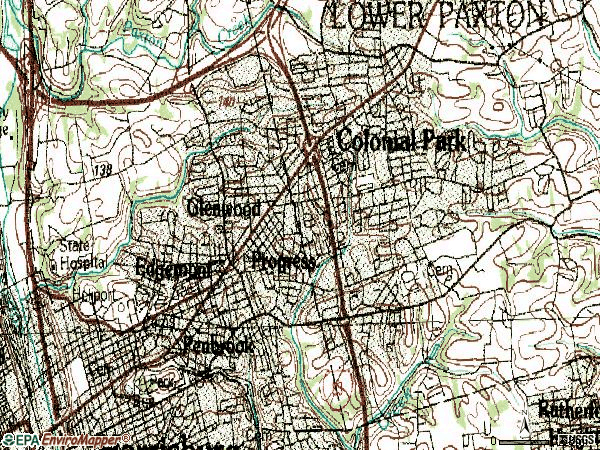
Notable locations in zip code 17109: Union Square (A), Dauphin Plaza (B), Edgemont Volunteer Fire Company Station 31 (C), Colonial Park Fire Company 1 Station 33 (D), Progress Fire Company (E). Display/hide their locations on the map
Churches in zip code 17109 include: Colonial Park Church (A), Christ the Saviour Church (B), Saint Marks Church (C). Display/hide their locations on the map
Cemeteries: Woodlawn Memorial Gardens (1), Shoops Cemetery (2), Mount Moriah Cemetery (3), East Harrisburg Cemetery (4). Display/hide their locations on the map
In group quarters: 320 (-1 institutionalized population)
Size of family households: 2,841 2-persons, 1,421 3-persons, 915 4-persons, 942 5-persons, 127 6-persons, 135 7-or-more-persons
Size of nonfamily households: 3,674 1-person, 1,009 2-persons, 59 3-persons
3,639 married couples with children.
1,791 single-parent households (652 men, 1,139 women).
83.1% of residents of 17109 zip code speak English at home.
3.8% of residents speak Spanish at home (58% very well, 17% well, 19% not well, 7% not at all).
6.8% of residents speak other Indo-European language at home (51% very well, 29% well, 15% not well, 6% not at all).
4.0% of residents speak Asian or Pacific Island language at home (26% very well, 26% well, 34% not well, 13% not at all).
2.5% of residents speak other language at home (24% very well, 69% well, 7% not well).
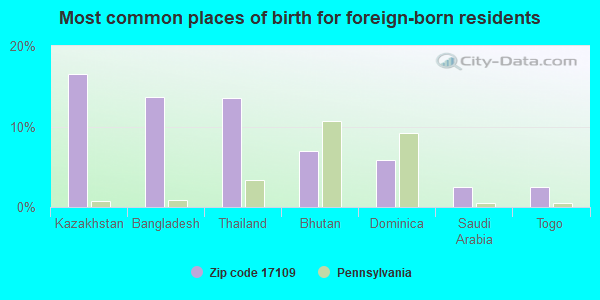
Foreign born population: 4,569 (17.2%) (53.8% of them are naturalized citizens)
AIR MINOR (AIRS/AFS) STATE MASTER (Pennsylvania database) - RCRIS-PAD987355864, HAZARDOUS WASTE PROGRAM Small Quantity Generators, between 100 kg and 1000 kg of hazardous waste/month (Resource Conservation and Recovery Act (tracking hazardous waste)) Business SIC classification: TIRE RETREADING AND REPAIR SHOPS Organizations: OPERNAME (CONTACT/OPERATOR)
Alternative names: AVELLINOS TIRE SERVICE CO, TIRES PLUS
7 ELEVEN 11420 (2624 BROOKWOOD STREET in HARRISBURG, PA)
STATE MASTER (Pennsylvania database) - RCRIS-PAD987327467, HAZARDOUS WASTE PROGRAM Small Quantity Generators, between 100 kg and 1000 kg of hazardous waste/month (Resource Conservation and Recovery Act (tracking hazardous waste)) - notification Organizations: OPERNAME (CONTACT/OPERATOR)
, SOUTHLAND CORPORATION THE (CONTACT/OWNER)
Alternative names: 7 ELEVEN #11420
7 ELEVEN 11422 (514 NORTH PROGRESS STREET in HARRISBURG, PA)
STATE MASTER (Pennsylvania database) - RCRIS-PAD987327475, HAZARDOUS WASTE PROGRAM Small Quantity Generators, between 100 kg and 1000 kg of hazardous waste/month (Resource Conservation and Recovery Act (tracking hazardous waste)) - notification Organizations: OPERNAME (CONTACT/OPERATOR)
, SOUTHLAND CORPORATION THE (CONTACT/OWNER)
Alternative names: 7 ELEVEN #11422
7 ELEVEN 21439 (2802 WALNUT STREET in HARRISBURG, PA)
STATE MASTER (Pennsylvania database) - RCRIS-PAD987327533, HAZARDOUS WASTE PROGRAM Small Quantity Generators, between 100 kg and 1000 kg of hazardous waste/month (Resource Conservation and Recovery Act (tracking hazardous waste)) - notification Organizations: OPERNAME (CONTACT/OPERATOR)
, SOUTHLAND CORPORATION THE (CONTACT/OWNER)
Alternative names: 7 ELEVEN #21439
7 ELEVEN 22007 (39TH ST & WALNUT in HARRISBURG, PA)
STATE MASTER (Pennsylvania database) - RCRIS-PAD987327400, HAZARDOUS WASTE PROGRAM Small Quantity Generators, between 100 kg and 1000 kg of hazardous waste/month (Resource Conservation and Recovery Act (tracking hazardous waste)) - notification Organizations: OPERNAME (CONTACT/OPERATOR)
, SOUTHLAND CORPORATION THE (CONTACT/OWNER)
Alternative names: 7-ELEVEN #22007
AMP PRINCE ST TERM MFG PLT (425 PRINCE ST in HARRISBURG, PA)
STATE MASTER (Pennsylvania database) - RCRIS-PAD981039290, HAZARDOUS WASTE PROGRAM Small Quantity Generators, between 100 kg and 1000 kg of hazardous waste/month (Resource Conservation and Recovery Act (tracking hazardous waste)) - notification Organizations: OPERNAME (CONTACT/OPERATOR)
, A M P INC (CONTACT/OWNER)
Alternative names: A M P INC
ANNA L CARTER KDG CTR ( in HARRISBURG, PA)
(National Center for Education Statistics) - STATE ID-1803 Organizations: SUSQUEHANNA TOWNSHIP SD (SCHOOL DISTRICT)
BELL OF PA PAXTONIA (4806 JONESTOWN ROAD in HARRISBURG, PA)
ATLANTIC SERVICE STATION (4240 JONESTOWN RD-TANKS in HARRISBURG, PA)
Conditionally Exempt Small Quantity Generators, less than 100 kg/month of hazardous waste (Resource Conservation and Recovery Act (tracking hazardous waste)) - notification Organizations: OPERNAME (CONTACT/OPERATOR)
, ATLANTIC REFINING & MARKETING (CONTACT/OWNER)
Housing units lacking complete plumbing facilities: 0.2% Housing units lacking complete kitchen facilities: 3.1%
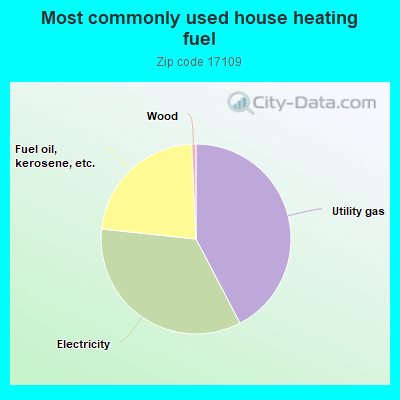
41.8%Utility gas
33.9%Electricity
22.3%Fuel oil, kerosene, etc.
0.7%Wood
Population in 1990: 22,952. Population change in the 1990s: +404 (+1.8%).
Place of birth for U.S.-born residents:
This state: 16,530
Northeast: 1,910
Midwest: 680
South: 1,923
West: 420
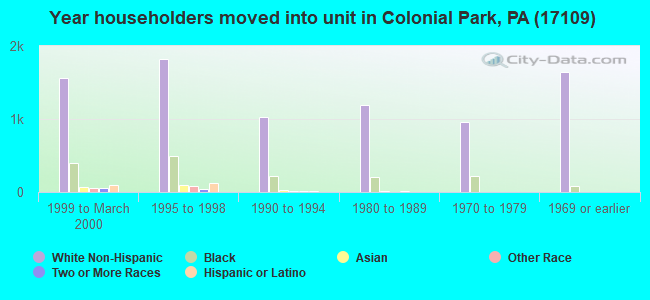
54% of the 17109 zip code residents lived in the same house 5 years ago. Out of people who lived in different houses, 65% lived in this county. Out of people who lived in different counties, 50% lived in Pennsylvania.
85% of the 17109 zip code residents lived in the same house 1 year ago. Out of people who lived in different houses, 52% moved from this county. Out of people who lived in different houses, 26% moved from different county within same state. Out of people who lived in different houses, 15% moved from different state. Out of people who lived in different houses, 5% moved from abroad.
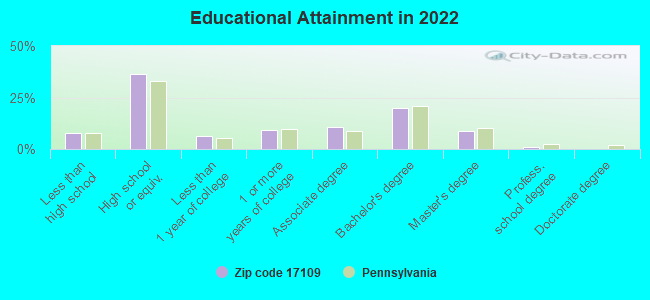
Private vs. public school enrollment:
Students in private schools in grades 1 to 8 (elementary and middle school): 166
Here:
6.7%
Pennsylvania:
15.7%
Students in private schools in grades 9 to 12 (high school): 438
Here:
35.8%
Pennsylvania:
13.4%
Students in private undergraduate colleges: 176
Here:
18.9%
Pennsylvania:
39.8%
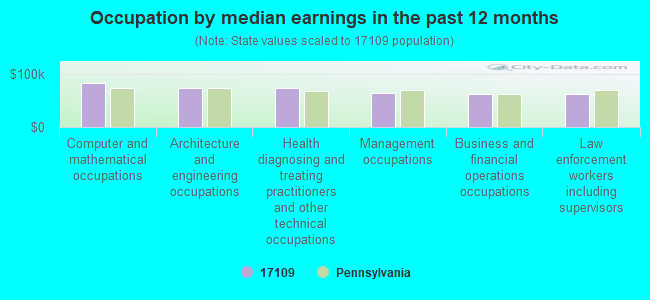
Occupation by median earnings in the past 12 months ($)
82,760Computer and mathematical occupations
74,091Architecture and engineering occupations
72,572Health diagnosing and treating practitioners and other technical occupations
64,608Management occupations
61,906Business and financial operations occupations
61,504Law enforcement workers including supervisors
Companies with federal contracts located in this zip code (HARRISBURG, PA):
B & W,INCORPORATED (5409 LOCUST LN; small business) : $523,362 in 33 contractsfrom 2000 to 2006
Contracts for Fire Protection Services, Installation of Equipment -- Plumbing, Heating, and Waste Disposal Equipment, Maintenance, Repair and Rebuilding of Equipment -- Alarm, Signal, and Security Detection Systems, Construction of Structures and Facilities -- Miscellaneous Buildings, and moreby Army, Navy Signed by year:2000: $35,118; 2001: $63,904; 2002: $128,954; 2003: $128,005; 2004: $61,282; 2005: $111,303; 2006: -$5,204.
Biggest contracts:
$67,937 with Army for Fire Protection Services. Signed on 2005-08-30. Completion date: 2006-06-30.
$63,378 with Army for Installation of Equipment -- Plumbing, Heating, and Waste Disposal Equipment. Signed on 2002-09-29. Completion date: 2002-12-30.
$41,046 with Army for Fire Protection Services. Signed on 2003-05-30. Completion date: 2003-06-01.
$40,000 with Army for Maintenance, Repair and Rebuilding of Equipment -- Alarm, Signal, and Security Detection Systems. Signed on 2003-08-04. Completion date: 2003-06-30.
TOTAL OFFICE SOLUTIONS, INC (4813 JONESTOWN ROAD; small business) : $105,792 in 6 contractsfrom 2004 to 2006
Contracts for Office Furniture, Miscellaneous Defense Hard Goods -- Basic Research (R&D), Installation of Equipment -- Furniture, Miscellaneous Furniture and Fixtures by Defense Information Systems Agency, Army, Department of Defense Signed by year:2000: $0; 2001: $0; 2002: $0; 2003: $0; 2004: $135,591; 2005: -$17,513; 2006: -$12,286.
Biggest contracts:
$105,880 with Defense Information Systems Agency for Office Furniture. Signed on 2004-09-28. Completion date: 2004-10-28.
$15,170 with Army for Miscellaneous Defense Hard Goods -- Basic Research (R&D). Signed on 2004-06-23. Completion date: 2004-07-30.
$12,286 with Army for Installation of Equipment -- Furniture. Signed on 2004-12-16. Completion date: 2005-04-30.
$2,255 with Army for Miscellaneous Furniture and Fixtures. Signed on 2004-11-09. Completion date: 2005-01-05.
HARRISBURG NEWS COMPANY (980 BRIARSDALE RD; small business) : $31,173 in 3 contractsfrom 2003 to 2005
$12,341 with Army for Books and Pamphlets. Signed on 2005-06-08. Completion date: 2006-06-30.
$10,673 with Army for Newspapers and Periodicals. Signed on 2004-06-21. Completion date: 2005-06-30.
$8,159, same as above.Signed on 2003-06-12. Completion date: 2004-06-30.
FLEX FX DIGITAL IMAGING, INC (3989 SUNNYCREST DR; small business)
$12,072 with Army for Signs, Advertising Displays, and Identification Plates. Signed on 2004-08-26. Completion date: 2004-09-17.
IRVIN H GEIGER ASSOCIATES, IN (3801 LOCUST LANE; small business)
$11,534 with Army for Generators and Generators Sets, Electrical. Signed on 2004-09-15. Completion date: 2004-10-27.
SALTZER, ERNEST & SONS (1 DARTMOUTH ST; small business)
$2,500 with Army for Maintenance, Repair and Rebuilding of Equipment -- Special Industry Machinery. Signed on 2005-03-23. Completion date: 2005-04-29.
Top industries in this zip code by the number of employees in 2005:
Administrative and Support and Waste Management and Remediation Services: Temporary Help Services (100-249 employees: 4 establishments, 50-99 employees: 3 establishments, 20-49 employees: 1 establishment, 10-19 employees: 1 establishment, 1-4 employees: 1 establishment)
Health Care and Social Assistance: Offices of Physicians (except Mental Health Specialists) (250-499: 1, 100-249: 1, 20-49: 4, 10-19: 5, 5-9: 9, 1-4: 13)
2005 - 2018 National Fire Incident Reporting System (NFIRS) incidents
Based on the data from the years 2005 - 2018 the average number of fire incidents per year is 180. The highest number of reported fire incidents - 282 took place in 2007, and the least - 77 in 2005. The data has an increasing trend.
When looking into fire subcategories, the most reports belonged to: Structure Fires (76.9%), and Outside Fires (12.2%).
Fire incident types reported to NFIRS in Zip Code 17109
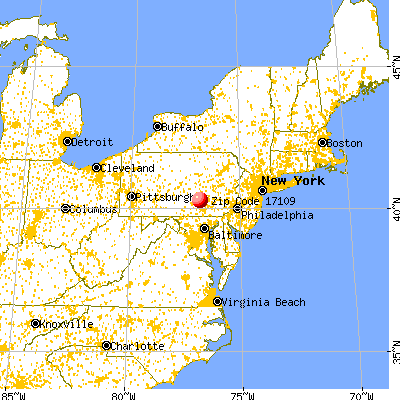


 Nearest zip codes: 17111, 17103, 17104, 17120, 17113, 17110.
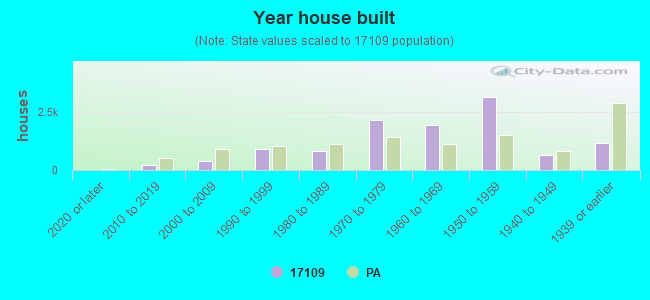


 Based on the data from the years 2005 - 2018 the average number of fire incidents per year is 180. The highest number of reported fire incidents - 282 took place in 2007, and the least - 77 in 2005. The data has an increasing trend.
 When looking into fire subcategories, the most reports belonged to: Structure Fires (76.9%), and Outside Fires (12.2%).