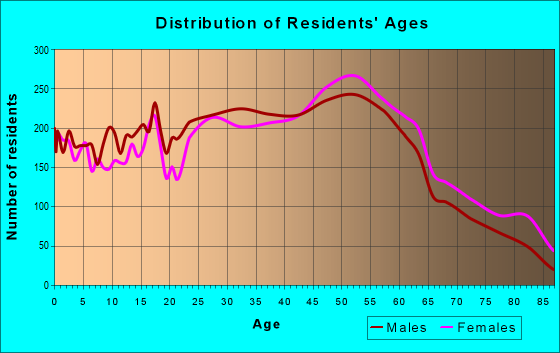
Estimated zip code population in 2022: 36,220 Zip code population in 2010: 30,714 Zip code population in 2000: 27,111
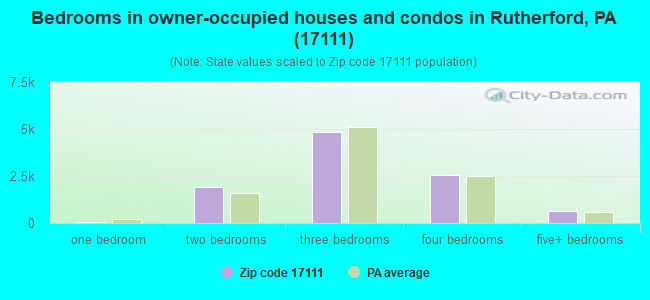
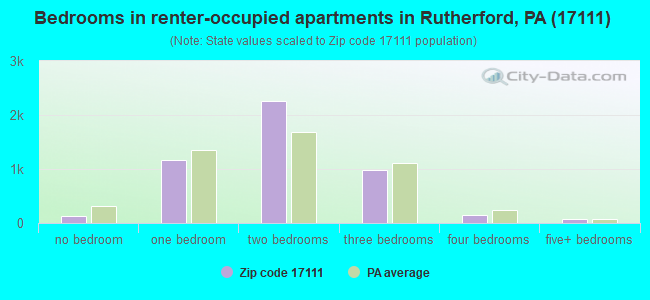
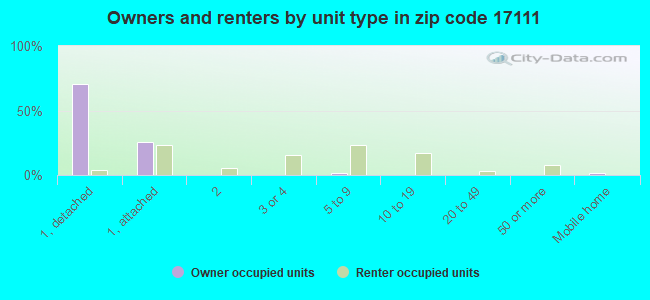
Houses and condos: 15,177 Renter-occupied apartments: 4,760
% of renters here:
32%
State:
31%
March 2022 cost of living index in zip code 17111: 96.1 (near average, U.S. average is 100)
Land area: 18.4 sq. mi. Water area: 0.0 sq. mi.
Population density: 1,966 people per square mile
(low).
OSM Map
General Map
Google Map
MSN Map
OSM Map
General Map
Google Map
MSN Map
OSM Map
General Map
Google Map
MSN Map
OSM Map
General Map
Google Map
MSN Map
Please wait while loading the map...
Real estate property taxes paid for housing units in 2022:
This zip code:
1.4% ($3,133)
Pennsylvania:
1.3% ($3,094)
Median real estate property taxes paid for housing units with mortgages in 2022: $3,108 (1.4%) Median real estate property taxes paid for housing units with no mortgage in 2022: $3,216 (1.4%)
Averages for the 2020 tax year for zip code 17111, filed in 2021:
Average Adjusted Gross Income (AGI) in 2020: $66,725 (Individual Income Tax Returns)
Here:
$66,725
State:
$75,707
Salary/wage: $57,208 (reported on 82.3% of returns)
Here:
$57,208
State:
$62,806
(% of AGI for various income ranges: 1382.9% for AGIs below $25k, 3624.4% for AGIs $25k-50k, 6104.8% for AGIs $50k-75k, 8749.7% for AGIs $75k-100k, 16284.2% for AGIs $100k-200k, 72550.5% for AGIs over 200k)
Taxable interest for individuals: $1,277 (reported on 28.3% of returns)
This zip code:
$1,277
Pennsylvania:
$1,633
(% of AGI for various income ranges: 10.9% for AGIs below $25k, 17.4% for AGIs $25k-50k, 24.9% for AGIs $50k-75k, 52.5% for AGIs $75k-100k, 105.8% for AGIs $100k-200k, 1222.7% for AGIs over 200k)
Ordinary dividends: $4,659 (reported on 18.4% of returns)
Here:
$4,659
State:
$7,382
(% of AGI for various income ranges: 18.3% for AGIs below $25k, 25.5% for AGIs $25k-50k, 61.5% for AGIs $50k-75k, 104.2% for AGIs $75k-100k, 290.3% for AGIs $100k-200k, 3146.4% for AGIs over 200k)
Net capital gain/loss in AGI: +$12,834 (reported on 15.7% of returns)
Here:
+$12,834
State:
+$23,522
(% of AGI for various income ranges: 6.7% for AGIs below $25k, 22.0% for AGIs $25k-50k, 52.6% for AGIs $50k-75k, 115.2% for AGIs $75k-100k, 436.5% for AGIs $100k-200k, 12336.8% for AGIs over 200k)
Profit/loss from business: +$13,595 (reported on 11.6% of returns)
Here:
+$13,595
State:
+$16,274
(% of AGI for various income ranges: 54.3% for AGIs below $25k, 82.6% for AGIs $25k-50k, 125.8% for AGIs $50k-75k, 232.4% for AGIs $75k-100k, 482.3% for AGIs $100k-200k, 4712.3% for AGIs over 200k)
Taxable individual retirement arrangement distribution: $17,264 (reported on 10.1% of returns)
17111:
$17,264
Pennsylvania:
$18,583
(% of AGI for various income ranges: 55.5% for AGIs below $25k, 86.7% for AGIs $25k-50k, 177.1% for AGIs $50k-75k, 418.8% for AGIs $75k-100k, 769.1% for AGIs $100k-200k, 2230.0% for AGIs over 200k)
Self-employed (Keogh) retirement plans: $23,443 (reported on 0.4% of returns)
17111:
$23,443
Pennsylvania:
$25,407
(% of AGI for various income ranges: 24.9% for AGIs $100k-200k, 563.6% for AGIs over 200k)
Total itemized deductions: $29,528 (reported on 6.8% of returns)
Here:
$29,528
State:
$34,850
(% of AGI for various income ranges: 37.2% for AGIs below $25k, 72.1% for AGIs $25k-50k, 235.6% for AGIs $50k-75k, 326.8% for AGIs $75k-100k, 726.0% for AGIs $100k-200k, 5458.2% for AGIs over 200k)
Charity contributions: $9,654 (reported on 5.1% of returns)
Here:
$9,654
State:
$12,392
(% of AGI for various income ranges: 2.0% for AGIs below $25k, 8.3% for AGIs $25k-50k, 36.7% for AGIs $50k-75k, 63.5% for AGIs $75k-100k, 197.6% for AGIs $100k-200k, 1839.1% for AGIs over 200k)
Taxes paid: $7,854 (reported on 6.7% of returns)
17111:
$7,854
State:
$8,200
(% of AGI for various income ranges: 5.1% for AGIs below $25k, 18.4% for AGIs $25k-50k, 68.8% for AGIs $50k-75k, 107.7% for AGIs $75k-100k, 226.7% for AGIs $100k-200k, 1045.5% for AGIs over 200k)
Earned income credit: $2,224 (reported on 14.2% of returns)
Here:
$2,224
State:
$2,100
(% of AGI for various income ranges: 80.9% for AGIs below $25k, 66.3% for AGIs $25k-50k, 0.7% for AGIs $50k-75k)
Percentage of individuals using paid preparers for their 2020 taxes: 92.2%
Here:
92%
State:
92%
(% for various income ranges: 90.9% for AGIs below $25k, 93.1% for AGIs $25k-50k, 92.4% for AGIs $50k-75k, 92.6% for AGIs $75k-100k, 92.6% for AGIs $100k-200k, 92.6% for AGIs over 200k)
Averages for the 2012 tax year for zip code 17111, filed in 2013:
Average Adjusted Gross Income (AGI) in 2012: $57,900 (Individual Income Tax Returns)
Here:
$57,900
State:
$61,346
Salary/wage: $51,567 (reported on 83.8% of returns)
Here:
$51,567
State:
$51,902
(% of AGI for various income ranges: 71.8% for AGIs below $25k, 78.1% for AGIs $25k-50k, 77.0% for AGIs $50k-75k, 75.3% for AGIs $75k-100k, 79.8% for AGIs $100k-200k, 60.6% for AGIs over 200k)
Taxable interest for individuals: $966 (reported on 37.7% of returns)
This zip code:
$966
Pennsylvania:
$1,588
(% of AGI for various income ranges: 1.2% for AGIs below $25k, 0.6% for AGIs $25k-50k, 0.6% for AGIs $50k-75k, 0.5% for AGIs $75k-100k, 0.5% for AGIs $100k-200k, 0.9% for AGIs over 200k)
Ordinary dividends: $3,501 (reported on 21.9% of returns)
Here:
$3,501
State:
$5,827
(% of AGI for various income ranges: 1.4% for AGIs below $25k, 0.8% for AGIs $25k-50k, 0.9% for AGIs $50k-75k, 1.1% for AGIs $75k-100k, 1.1% for AGIs $100k-200k, 2.8% for AGIs over 200k)
Net capital gain/loss in AGI: +$9,767 (reported on 14.8% of returns)
Here:
+$9,767
State:
+$14,495
(% of AGI for various income ranges: 0.3% for AGIs $50k-75k, 0.6% for AGIs $75k-100k, 1.0% for AGIs $100k-200k, 12.4% for AGIs over 200k)
Profit/loss from business: +$13,956 (reported on 10.4% of returns)
Here:
+$13,956
State:
+$16,268
(% of AGI for various income ranges: 4.4% for AGIs below $25k, 2.1% for AGIs $25k-50k, 2.0% for AGIs $50k-75k, 1.7% for AGIs $75k-100k, 2.3% for AGIs $100k-200k, 3.8% for AGIs over 200k)
Taxable individual retirement arrangement distribution: $12,632 (reported on 11.3% of returns)
17111:
$12,632
Pennsylvania:
$14,550
(% of AGI for various income ranges: 3.7% for AGIs below $25k, 2.4% for AGIs $25k-50k, 2.5% for AGIs $50k-75k, 2.5% for AGIs $75k-100k, 2.4% for AGIs $100k-200k, 2.0% for AGIs over 200k)
Self-employment retirement plans: $14,412 (reported on 0.5% of returns)
17111:
$14,412
Pennsylvania:
$20,922
Total itemized deductions: $19,950 (19% of AGI, reported on 35.4% of returns)
Here:
$19,950
State:
$23,538
Here:
19.4% of AGI
State:
18.4% of AGI
(% of AGI for various income ranges: 8.7% for AGIs below $25k, 9.5% for AGIs $25k-50k, 12.1% for AGIs $50k-75k, 12.9% for AGIs $75k-100k, 14.7% for AGIs $100k-200k, 11.4% for AGIs over 200k)
Charity contributions: $3,732 (reported on 28.1% of returns)
Here:
$3,732
State:
$4,025
(% of AGI for various income ranges: 0.8% for AGIs below $25k, 1.0% for AGIs $25k-50k, 1.5% for AGIs $50k-75k, 1.7% for AGIs $75k-100k, 2.2% for AGIs $100k-200k, 2.8% for AGIs over 200k)
Taxes paid: $8,315 (reported on 35.2% of returns)
17111:
$8,315
State:
$9,982
(% of AGI for various income ranges: 1.8% for AGIs below $25k, 2.9% for AGIs $25k-50k, 4.4% for AGIs $50k-75k, 5.2% for AGIs $75k-100k, 6.8% for AGIs $100k-200k, 6.0% for AGIs over 200k)
Earned income credit: $2,129 (reported on 13.1% of returns)
Here:
$2,129
State:
$2,106
(% of AGI for various income ranges: 5.2% for AGIs below $25k, 0.8% for AGIs $25k-50k)
Percentage of individuals using paid preparers for their 2012 taxes: 43.5%
Here:
44%
State:
53%
(% for various income ranges: 38.7% for AGIs below $25k, 40.2% for AGIs $25k-50k, 46.4% for AGIs $50k-75k, 48.3% for AGIs $75k-100k, 51.2% for AGIs $100k-200k, 68.4% for AGIs over 200k)
Averages for the 2004 tax year for zip code 17111, filed in 2005:
Average Adjusted Gross Income (AGI) in 2004: $49,992 (Individual Income Tax Returns)
Here:
$49,992
State:
$48,049
Salary/wage: $44,997 (reported on 84.9% of returns)
Here:
$44,997
State:
$42,646
(% of AGI for various income ranges: 99.2% for AGIs below $10k, 69.8% for AGIs $10k-25k, 81.0% for AGIs $25k-50k, 81.9% for AGIs $50k-75k, 84.7% for AGIs $75k-100k, 67.5% for AGIs over 100k)
Taxable interest for individuals: $1,206 (reported on 52.2% of returns)
This zip code:
$1,206
Pennsylvania:
$1,657
(% of AGI for various income ranges: 4.9% for AGIs below $10k, 2.7% for AGIs $10k-25k, 1.3% for AGIs $25k-50k, 1.0% for AGIs $50k-75k, 0.9% for AGIs $75k-100k, 1.2% for AGIs over 100k)
Taxable dividends: $2,000 (reported on 29.0% of returns)
Here:
$2,000
State:
$3,566
(% of AGI for various income ranges: 4.0% for AGIs below $10k, 1.6% for AGIs $10k-25k, 1.0% for AGIs $25k-50k, 0.9% for AGIs $50k-75k, 0.8% for AGIs $75k-100k, 1.4% for AGIs over 100k)
Net capital gain/loss: +$8,367 (reported on 19.8% of returns)
Here:
+$8,367
State:
+$9,716
(% of AGI for various income ranges: -1.1% for AGIs below $10k, 0.2% for AGIs $10k-25k, 0.3% for AGIs $25k-50k, 0.5% for AGIs $50k-75k, 0.6% for AGIs $75k-100k, 8.5% for AGIs over 100k)
Profit/loss from business: +$12,106 (reported on 10.4% of returns)
Here:
+$12,106
State:
+$14,267
(% of AGI for various income ranges: 2.0% for AGIs below $10k, 3.3% for AGIs $10k-25k, 2.3% for AGIs $25k-50k, 1.8% for AGIs $50k-75k, 2.2% for AGIs $75k-100k, 3.1% for AGIs over 100k)
IRA payment deduction: $2,681 (reported on 2.5% of returns)
17111:
$2,681
Pennsylvania:
$2,903
(% of AGI for various income ranges: 0.2% for AGIs $10k-25k, 0.2% for AGIs $25k-50k, 0.2% for AGIs $50k-75k, 0.1% for AGIs $75k-100k, 0.1% for AGIs over 100k)
Self-employed pension: $12,204 (reported on 0.7% of returns)
Here:
$12,204
Pennsylvania:
$14,674
(% of AGI for various income ranges: 0.1% for AGIs $25k-50k, 0.1% for AGIs $50k-75k, 0.1% for AGIs $75k-100k, 0.3% for AGIs over 100k)
Total itemized deductions: $16,555 (19% of AGI, reported on 38.2% of returns)
Here:
$16,555
State:
$18,804
Here:
18.9% of AGI
State:
19.5% of AGI
(% of AGI for various income ranges: 7.9% for AGIs below $10k, 8.2% for AGIs $10k-25k, 10.0% for AGIs $25k-50k, 14.4% for AGIs $50k-75k, 15.3% for AGIs $75k-100k, 12.9% for AGIs over 100k)
Charity contributions deductions: $3,118 (3% of AGI, reported on 33.8% of returns)
Here:
$3,118
State:
$3,337
Here:
3.4% of AGI
State:
3.3% of AGI
(% of AGI for various income ranges: 0.5% for AGIs below $10k, 1.1% for AGIs $10k-25k, 1.2% for AGIs $25k-50k, 1.9% for AGIs $50k-75k, 2.3% for AGIs $75k-100k, 2.9% for AGIs over 100k)
Total tax: $7,645 (reported on 79.8% of returns)
17111:
$7,645
State:
$8,008
(% of AGI for various income ranges: 2.9% for AGIs below $10k, 4.5% for AGIs $10k-25k, 7.9% for AGIs $25k-50k, 9.6% for AGIs $50k-75k, 10.7% for AGIs $75k-100k, 18.4% for AGIs over 100k)
Earned income credit: $1,564 (reported on 9.2% of returns)
Here:
$1,564
State:
$1,643
Percentage of individuals using paid preparers for their 2004 taxes: 48.9%
Here:
49%
State:
56%
(% for various income ranges: 42.5% for AGIs below $10k, 52.9% for AGIs $10k-25k, 47.0% for AGIs $25k-50k, 50.7% for AGIs $50k-75k, 47.6% for AGIs $75k-100k, 56.0% for AGIs over 100k)
Likely homosexual households (counted as self-reported same-sex unmarried-partner households)
Lesbian couples: 0.2% of all households
Gay men: 0.3% of all households
Household received Food Stamps/SNAP in the past 12 months: 1,122 Household did not receive Food Stamps/SNAP in the past 12 months: 13,562
Women who had a birth in the past 12 months: 381 (306 now married, 81 unmarried) Women who did not have a birth in the past 12 months: 7,715 (3,275 now married, 4,432 unmarried)
Housing units in zip code 17111 with a mortgage: 6,864 (755 second mortgage, 6 home equity loan, 650 both second mortgage and home equity loan) Houses without a mortgage: 379
Median monthly owner costs for units with a mortgage: $1,493 Median monthly owner costs for units without a mortgage: $664
Residents with income below the poverty level in 2022:
This zip code:
7.0%
Whole state:
11.8%
Residents with income below 50% of the poverty level in 2022:
This zip code:
3.4%
Whole state:
6.1%
Median number of rooms in houses and condos:
Here:
6.8
State:
6.8
Median number of rooms in apartments:
Here:
4.5
State:
4.3
Notable locations in this zip code not listed on our city pages
Notable locations in zip code 17111: Rutherford Yards (A), Scottsdale Plaza (B), Rutherford Fire Company 1 (C), Lawnton Fire Company Station 44 (D), Chambers Hill Fire Company and Community Association Station 546 (E), Paxtang Fire Company 1 Station 40 (F). Display/hide their locations on the map
Churches in zip code 17111 include: Grace Church (A), Foursquare Church (B), Faith Church (C), Paxton Church (D), Bible Church (E). Display/hide their locations on the map
Cemeteries: Baldwin Cemetery (1), Bethel Cemetery (2), Blue Ridge Memorial Gardens (3), Holy Cross Cemetery (4), Paxtang Cemetery (5), Day Cemetery (6). Display/hide their locations on the map
In group quarters: 1,589 (-1 institutionalized population)
Size of family households: 4,204 2-persons, 1,812 3-persons, 1,397 4-persons, 669 5-persons, 411 6-persons, 287 7-or-more-persons
Size of nonfamily households: 4,804 1-person, 1,109 2-persons, 93 3-persons
4,323 married couples with children.
1,802 single-parent households (726 men, 1,076 women).
83.6% of residents of 17111 zip code speak English at home.
5.1% of residents speak Spanish at home (63% very well, 18% well, 16% not well, 3% not at all).
7.1% of residents speak other Indo-European language at home (27% very well, 51% well, 12% not well, 10% not at all).
3.9% of residents speak Asian or Pacific Island language at home (49% very well, 26% well, 14% not well, 11% not at all).
0.3% of residents speak other language at home (50% very well, 35% well, 15% not at all).
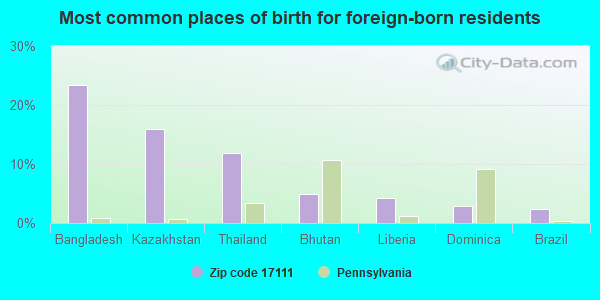
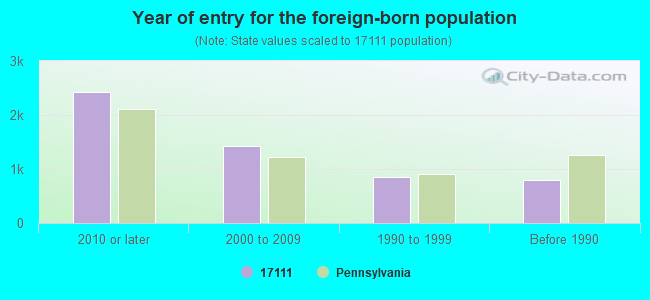
Foreign born population: 4,773 (13.2%) (70.5% of them are naturalized citizens)
This zip code:
13.2%
Whole state:
7.5%
23%Bangladesh
16%Kazakhstan
12%Thailand
5%Bhutan
4%Liberia
3%Dominica
2%Brazil
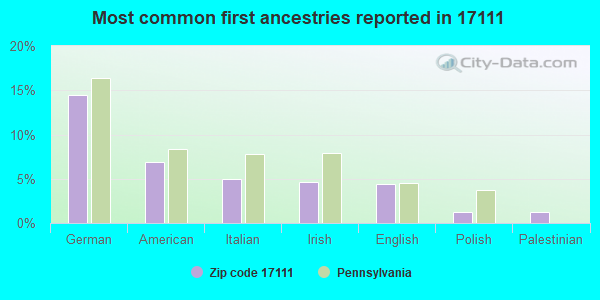
14%German
7%American
5%Italian
5%Irish
4%English
1%Polish
1%Palestinian
Year of entry for the foreign-born population
2,4292010 or later
1,4202000 to 2009
8501990 to 1999
798Before 1990
Major facilities with environmental interests located in this zip code:
AVELLINOS TIRE 29TH ST SHOP (1015 S 29TH ST in HARRISBURG, PA)
AIR MINOR (AIRS/AFS) STATE MASTER (Pennsylvania database) - RCRIS-PAD987355872, HAZARDOUS WASTE PROGRAM Conditionally Exempt Small Quantity Generators, less than 100 kg/month of hazardous waste (Resource Conservation and Recovery Act (tracking hazardous waste)) Business SIC classification: TIRE RETREADING AND REPAIR SHOPS Organizations: OPERNAME (CONTACT/OPERATOR)
Alternative names: AVELLINOS TIRE SERVICE CO, TIRES PLUS
A M P (3705 PAXTON STREET in HARRISBURG, PA)
STATE MASTER (Pennsylvania database) - RCRIS-PAD981935323, HAZARDOUS WASTE PROGRAM Conditionally Exempt Small Quantity Generators, less than 100 kg/month of hazardous waste (Resource Conservation and Recovery Act (tracking hazardous waste)) - notification Organizations: OPERNAME (CONTACT/OPERATOR)
, A M P INC (CONTACT/OWNER)
A M P (3711 PAXTON ST in HARRISBURG, PA)
STATE MASTER (Pennsylvania database) - RCRIS-PAD987270469, HAZARDOUS WASTE PROGRAM Conditionally Exempt Small Quantity Generators, less than 100 kg/month of hazardous waste (Resource Conservation and Recovery Act (tracking hazardous waste)) - notification Organizations: OPERNAME (CONTACT/OPERATOR)
, AMP INCORPORATED (CONTACT/OWNER)
STATE MASTER (Pennsylvania database) - RCRIS-PAD051657567, HAZARDOUS WASTE PROGRAM Small Quantity Generators, between 100 kg and 1000 kg of hazardous waste/month (Resource Conservation and Recovery Act (tracking hazardous waste)) - notification Business SIC classification: SHEET METALWORK Organizations: OPERNAME (CONTACT/OPERATOR)
, NIGHTWINE HAROLD (CONTACT/OWNER)
Alternative names: ACME FABRICATORS & WELDORS INC
AMERIGAS PROPANE SWATARA (RUPP HILL RD in HARRISBURG, PA)
AIR SYNTHETIC MINOR (AIRS/AFS) STATE MASTER (Pennsylvania database) - AFS-23-2787917-1, AIR PROGRAM Business SIC classification: NATURAL GAS DISTRIBUTION; PETROLEUM AND PETROLEUM PRODUCTS WHOLESALERS, EXCEPT BULK STATIONS AND TERMINALS Business NAICS classification: PETROLEUM AND PETROLEUM PRODUCTS WHOLESALERS (EXCEPT BULK STATIONS AND TERMINALS). Organizations: AMERIGAS PROPANE, L.P. (OWNER/OPERATOR)
Alternative names: AMERIGAS PROPANE LP/SWATARA
AMP (2100 PAXTON STREET in HARRISBURG, PA)
STATE MASTER (Pennsylvania database) - RCRIS-PA0000030619, HAZARDOUS WASTE PROGRAM Conditionally Exempt Small Quantity Generators, less than 100 kg/month of hazardous waste (Resource Conservation and Recovery Act (tracking hazardous waste)) - notification Organizations: AMP INCORPORATED (CONTACT/OWNER)
AMP BLDG 176 (470 FRIENDSHIP RD in HARRISBURG, PA)
STATE MASTER (Pennsylvania database) - RCRIS-PAR000030882, HAZARDOUS WASTE PROGRAM Conditionally Exempt Small Quantity Generators, less than 100 kg/month of hazardous waste (Resource Conservation and Recovery Act (tracking hazardous waste)) - notification Organizations: AMP INC (CONTACT/OWNER)
Alternative names: AMP INCORPORATED, AMP INC BLDG 176
AUTOHAUS HBG AUTO SVC (4150 CHAMBERS HILL RD in HARRISBURG, PA)
STATE MASTER (Pennsylvania database) - RCRIS-PAD081617441, HAZARDOUS WASTE PROGRAM Small Quantity Generators, between 100 kg and 1000 kg of hazardous waste/month (Resource Conservation and Recovery Act (tracking hazardous waste)) Business NAICS classification: ALL OTHER MOTOR VEHICLE DEALERS. Organizations: OPERNAME (CONTACT/OPERATOR)
Alternative names: CAPITAL VOLKSWAGEN
A M P INCORPORATED (915 SOUTH 13TH STREET B in HARRISBURG, PA)
Small Quantity Generators, between 100 kg and 1000 kg of hazardous waste/month (Resource Conservation and Recovery Act (tracking hazardous waste)) - notification (Resource Conservation and Recovery Act (tracking hazardous waste)) Organizations: OPERNAME (CONTACT/OPERATOR)
, AMP INC (CONTACT/OWNER)
AMP INCORPORATED (3901 DERRY ST US & FM CTR DEPT in HARRISBURG, PA)
Conditionally Exempt Small Quantity Generators, less than 100 kg/month of hazardous waste (Resource Conservation and Recovery Act (tracking hazardous waste)) - notification Organizations: UNION DEPOSIT CORP (CONTACT/OWNER)
ABB CE SERVICES NORTHEAST CTR (7253 GRAYSON RD in HARRISBURG, PA)
Conditionally Exempt Small Quantity Generators, less than 100 kg/month of hazardous waste (Resource Conservation and Recovery Act (tracking hazardous waste)) - notification Organizations: FIRST INDUSTRIAL REALITY TRUST (CONTACT/OWNER)
AMP INC (101 S 38TH ST in HARRISBURG, PA)
Small Quantity Generators, between 100 kg and 1000 kg of hazardous waste/month (Resource Conservation and Recovery Act (tracking hazardous waste)) - notification Organizations: AMP INCORPORATED (CONTACT/OWNER)
Housing units lacking complete plumbing facilities: 0.4% Housing units lacking complete kitchen facilities: 1.2%
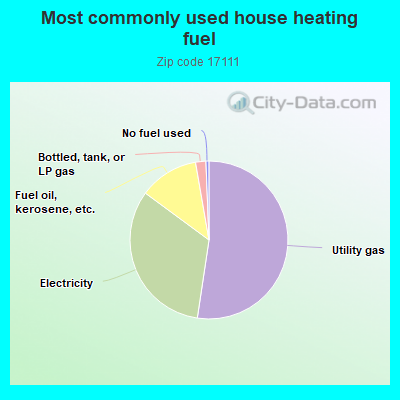
51.7%Utility gas
32.3%Electricity
12.0%Fuel oil, kerosene, etc.
2.1%Bottled, tank, or LP gas
0.6%No fuel used
Population in 1990: 22,558. Population change in the 1990s: +4,553 (+20.2%).
Place of birth for U.S.-born residents:
This state: 23,395
Northeast: 2,576
Midwest: 535
South: 3,443
West: 961
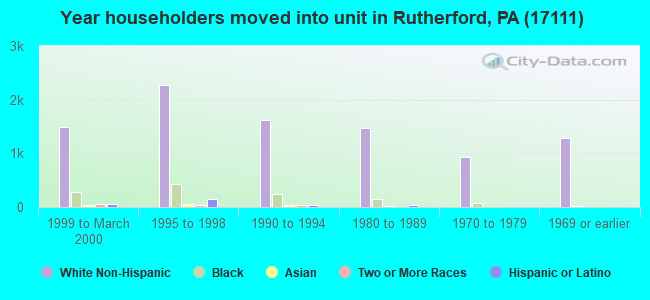
59% of the 17111 zip code residents lived in the same house 5 years ago. Out of people who lived in different houses, 64% lived in this county. Out of people who lived in different counties, 50% lived in Pennsylvania.
89% of the 17111 zip code residents lived in the same house 1 year ago. Out of people who lived in different houses, 47% moved from this county. Out of people who lived in different houses, 32% moved from different county within same state. Out of people who lived in different houses, 18% moved from different state. Out of people who lived in different houses, 3% moved from abroad.
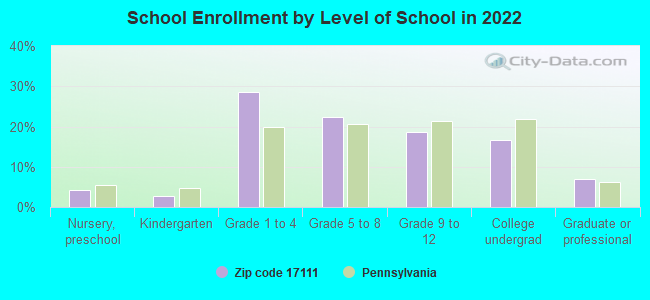
Private vs. public school enrollment:
Students in private schools in grades 1 to 8 (elementary and middle school): 737
Here:
18.9%
Pennsylvania:
15.7%
Students in private schools in grades 9 to 12 (high school): 258
Here:
18.1%
Pennsylvania:
13.4%
Students in private undergraduate colleges: 243
Here:
19.3%
Pennsylvania:
39.8%
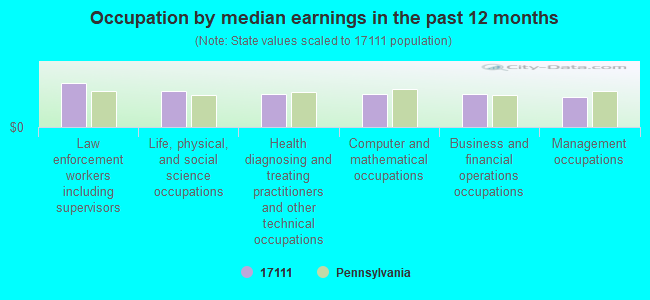
Occupation by median earnings in the past 12 months ($)
102,646Law enforcement workers including supervisors
84,540Life, physical, and social science occupations
77,701Health diagnosing and treating practitioners and other technical occupations
76,470Computer and mathematical occupations
76,186Business and financial operations occupations
70,669Management occupations
Companies with biggest federal contracts located in this zip code (HARRISBURG, PA):
YALE ELECTRIC SUPPLY CO INC (2207 PAXTON STREET; small business) : $8,581,072 in 466 contractsfrom 2002 to 2006
Contracts for Electrical Control Equipment, Converters, Electrical, Nonrotating, Electrical and Electronic assemblies, Boards, Cards, and Associated Hardware, Connectors, Electrical, and moreby Navy, Defense Logistics Agency, Air Force, Army, and others Signed by year:2000: $0; 2001: $0; 2002: $1,658,582; 2003: $1,230,965; 2004: $2,081,348; 2005: $2,759,475; 2006: $850,702.
Biggest contracts:
$410,479 with Navy for Electrical Control Equipment. Taking place in CA. Signed on 2004-11-01. Completion date: 2004-11-01.
$322,854 with Defense Logistics Agency for Converters, Electrical, Nonrotating. Signed on 2005-06-06. Completion date: 2006-02-01.
$322,854, same as above.Signed on 2005-06-06. Completion date: 2006-02-01.
$204,704 with Navy for Electrical and Electronic assemblies, Boards, Cards, and Associated Hardware. Taking place in CA. Signed on 2002-12-18. Completion date: 2003-09-18.
STEPHENSON EQUIPMENT INC (7201 PAXTON ST; small business) : $5,043,680 in 51 contractsfrom 1999 to 2006
Contracts for Cranes and Crane-Shovels, Maintenance, Repair and Rebuilding of Equipment -- Special Industry Machinery, Winches, Hoists, Cranes, and Derricks, Miscellaneous Materials Handling Equipment, and moreby Army, Navy, U.S. Army Corps of Engineers - civil program financing only, Defense Logistics Agency, and others Signed by year:2000: $325,288; 2001: $281,785; 2002: $660,575; 2003: $634,874; 2004: $1,373,259; 2005: $1,600,413; 2006: $27,198.
Biggest contracts:
$839,490 with Army for Cranes and Crane-Shovels. Signed on 2004-02-26. Completion date: 2004-03-31.
$734,979 with Army for Maintenance, Repair and Rebuilding of Equipment -- Special Industry Machinery. Taking place in MD. Signed on 2005-12-22. Completion date: 2002-12-31.
$659,192, same as above.Signed on 2005-02-23. Completion date: 2002-12-31.
$543,144, same as above.Signed on 2003-12-30. Completion date: 2002-12-31.
CLEVELAND BROTHERS EQP CO (5300 PAXTON STREET) : $1,447,307 in 79 contractsfrom 2000 to 2006
Contracts for Maintenance, Repair and Rebuilding of Equipment -- Weapons, Miscellaneous Construction Equipment, Diesel Engines and Components, Lease or Rental of Equipment -- Tractors, and moreby Army, Navy, Defense Logistics Agency, Bureau of Prisoners/Federal Prison System, and others Signed by year:2000: $42,000; 2001: $144,500; 2002: $0; 2003: $575,972; 2004: $198,960; 2005: $456,185; 2006: $29,690.
Biggest contracts:
$205,000 with Army for Maintenance, Repair and Rebuilding of Equipment -- Weapons. Signed on 2005-11-23. Completion date: 2003-12-26.
$200,000, same as above.Signed on 2004-10-21. Completion date: 2003-12-26.
$196,000, same as above.Signed on 2003-12-02. Completion date: 2003-12-26.
$190,000, same as above.Signed on 2003-08-28. Completion date: 2003-12-12.
XEROX CORPORATION (651 E PARK DR STE 200) : $976,298 in 7 contractsfrom 1999 to 2002
Contracts for Office Type Sound Recording and Reproducing Machines, Lease or Rental of Equipment -- Special Industry Machinery, Other Management Support Services by Department of Veterans Affairs, Army Signed by year:2000: $249,401; 2001: $193,000; 2002: $210,312; 2003: $0; 2004: $0; 2005: $0; 2006: $0.
Biggest contracts:
$210,312 with Department of Veterans Affairs for Office Type Sound Recording and Reproducing Machines. Signed on 2002-10-15. Completion date: 2003-09-15.
$193,000, same as above.Signed on 2001-10-15. Completion date: 2002-09-15.
$186,000, same as above.Signed on 2000-10-15. Completion date: 2001-09-15.
$169,000, same as above.Signed on 1999-10-15. Completion date: 2000-09-15.
COMMUNICATION SYSTEMS SPECIALI (1963 OBERLIN RD; small business) : $479,349 in 22 contractsfrom 1999 to 2006
Contracts for Maintenance, Repair and Rebuilding of Equipment -- Communication, Detection, and Coherent Radiation Equipment, Radio and Television Communication Equipment, Except Airborne, Miscellaneous Communication Equipment, Miscellaneous Items, and moreby Army, Defense Logistics Agency Signed by year:2000: $54,523; 2001: $100,382; 2002: $91,966; 2003: $50,088; 2004: $8,959; 2005: $114,083; 2006: $4,825.
Biggest contracts:
$69,110 with Army for Maintenance, Repair and Rebuilding of Equipment -- Communication, Detection, and Coherent Radiation Equipment. Signed on 2005-03-31. Completion date: 2006-03-30.
$59,679, same as above.Signed on 2003-11-07. Completion date: 2004-12-31.
$57,202, same as above.Signed on 2002-12-13. Completion date: 2004-12-31.
$55,432, same as above.Signed on 2001-12-28. Completion date: 2004-12-31.
ABEL PERSONNEL INC (3356 PAXTON ST; small business) : $379,459 in 25 contractsfrom 2002 to 2005
Contracts for Other Professional Services, Stenographic Services by Army Signed by year:2000: $0; 2001: $0; 2002: $73,260; 2003: $60,580; 2004: $64,941; 2005: $180,678; 2006: $0.
Biggest contracts:
$54,000 with Army for Other Professional Services. Signed on 2005-12-21. Completion date: 2006-12-29.
$30,000 with Army for Stenographic Services. Signed on 2005-01-20. Completion date: 2005-01-31.
$25,056, same as above.Signed on 2005-12-01. Completion date: 2005-12-31.
$24,900, same as above.Signed on 2005-12-07. Completion date: 2007-01-31.
HERBERT, ROWLAND & GRUBIC, INC (369 EAST PARK DRIVE) : $145,343 in 3 contractsfrom 2002 to 2004
$98,546 with Army for Other Environmental Services, Studies, and Analytical Support. Signed on 2003-12-11. Completion date: 2004-06-30.
$51,000, same as above.Signed on 2002-12-04. Completion date: 2003-03-12.
-$4,203, same as above.Signed on 2004-04-15. Completion date: 2004-06-30.
SABRINA M LENGNER (300 YORKSHIRE DR; small business) : $136,000 in 3 contractsfrom 2001 to 2004
$48,000 with Army for Other Management Support Services. Signed on 2004-11-05. Completion date: 2002-10-31.
$48,000, same as above.Signed on 2004-11-03. Completion date: 2002-10-31.
$40,000, same as above.Signed on 2001-11-07. Completion date: 2002-10-31.
INDUSTRIAL MOTOR SUPPLY INC (4200 CHAMBERS HILL ROAD; small business) : $130,043 in 6 contractsfrom 2003 to 2006
Contracts for Road Clearing, Cleaning and Marking Equipment, Maintenance, Repair and Rebuilding of Equipment -- Vehicular Equipment Components, Truck and Tractor Attachments, Hardware, Commercial by Army, Navy Signed by year:2000: $0; 2001: $0; 2002: $0; 2003: $86,178; 2004: $40,044; 2005: $0; 2006: $3,821.
Biggest contracts:
$80,934 with Army for Road Clearing, Cleaning and Marking Equipment. Signed on 2003-09-26. Completion date: 2003-12-31.
$19,215 with Navy for Maintenance, Repair and Rebuilding of Equipment -- Vehicular Equipment Components. Signed on 2004-02-05. Completion date: 2004-03-21.
$13,886 with Army for Road Clearing, Cleaning and Marking Equipment. Signed on 2004-10-29. Completion date: 2004-12-31.
$6,943, same as above.Signed on 2004-04-30. Completion date: 2004-05-28.
SCREENPRINTED GRAFIX INC (3120 PIKE ST; small business) : $68,765 in 5 contractsfrom 2004 to 2005
Contracts for Miscellaneous Items, Outerwear, Men's, Office Supplies, Underwear and Nightwear, Men's by Navy Signed by year:2000: $0; 2001: $0; 2002: $0; 2003: $0; 2004: $49,421; 2005: $19,344; 2006: $0.
Biggest contracts:
$22,000 with Navy for Miscellaneous Items. Signed on 2004-08-12. Completion date: 2004-09-10.
$20,840 with Navy for Outerwear, Men's. Signed on 2004-07-02. Completion date: 2004-08-02.
$9,994, same as above.Signed on 2005-04-01. Completion date: 2005-04-29.
$9,350 with Navy for Office Supplies. Signed on 2005-09-07. Completion date: 2005-09-30.
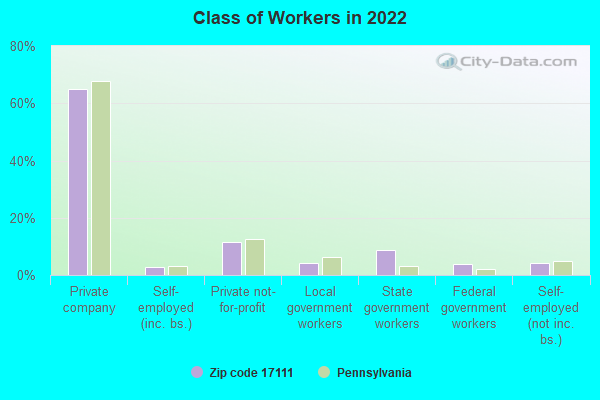
Top industries in this zip code by the number of employees in 2005:
Finance and Insurance: Direct Health and Medical Insurance Carriers (500-999 employees: 1 establishment, 250-499 employees: 2 establishments, 5-9 employees: 1 establishment)
Accommodation and Food Services: Hotels (except Casino Hotels) and Motels (100-249: 4, 50-99: 1, 20-49: 4, 10-19: 5, 1-4: 3)
2005 - 2018 National Fire Incident Reporting System (NFIRS) incidents
Based on the data from the years 2005 - 2018 the average number of fire incidents per year is 214. The highest number of reported fire incidents - 310 took place in 2012, and the least - 112 in 2018. The data has a decreasing trend.
When looking into fire subcategories, the most reports belonged to: Structure Fires (72.8%), and Outside Fires (12.3%).
Fire incident types reported to NFIRS in Zip Code 17111
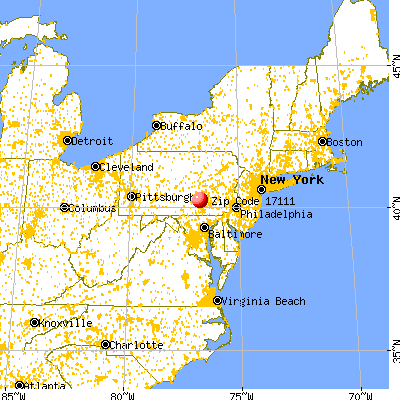


 Nearest zip codes: 17109, 17113, 17034, 17036, 17104, 17103.
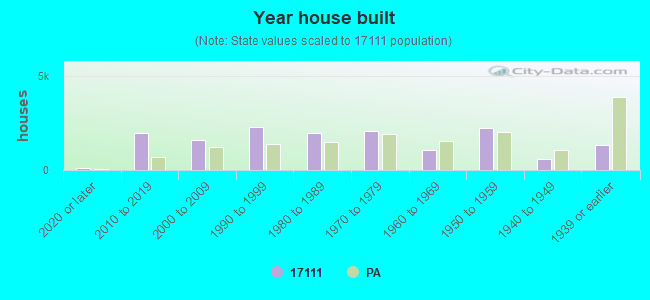


 Based on the data from the years 2005 - 2018 the average number of fire incidents per year is 214. The highest number of reported fire incidents - 310 took place in 2012, and the least - 112 in 2018. The data has a decreasing trend.
 When looking into fire subcategories, the most reports belonged to: Structure Fires (72.8%), and Outside Fires (12.3%).