Estimated zip code population in 2022: 22,287 Zip code population in 2010: 21,913 Zip code population in 2000: 18,826
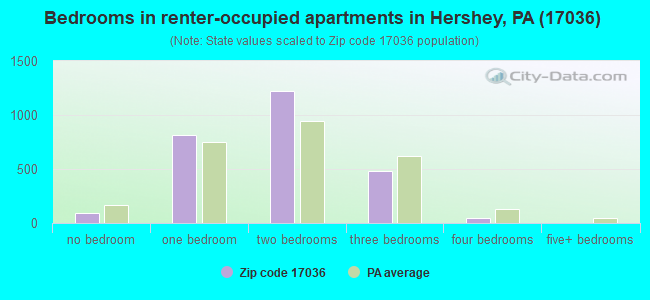
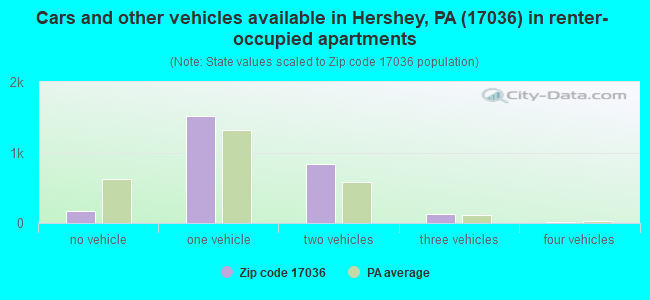
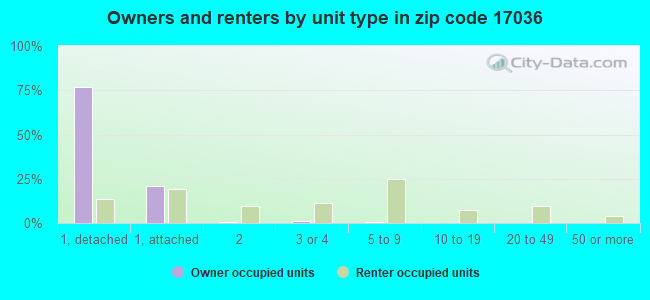
Houses and condos: 9,748 Renter-occupied apartments: 2,653
% of renters here:
28%
State:
31%
March 2022 cost of living index in zip code 17036: 96.8 (near average, U.S. average is 100)
Land area: 27.4 sq. mi. Water area: 0.2 sq. mi.
Population density: 815 people per square mile
(low).
OSM Map
General Map
Google Map
MSN Map
OSM Map
General Map
Google Map
MSN Map
OSM Map
General Map
Google Map
MSN Map
OSM Map
General Map
Google Map
MSN Map
Please wait while loading the map...
Real estate property taxes paid for housing units in 2022:
This zip code:
1.3% ($4,362)
Pennsylvania:
1.3% ($3,094)
Median real estate property taxes paid for housing units with mortgages in 2022: $4,411 (1.3%) Median real estate property taxes paid for housing units with no mortgage in 2022: $4,313 (1.3%)
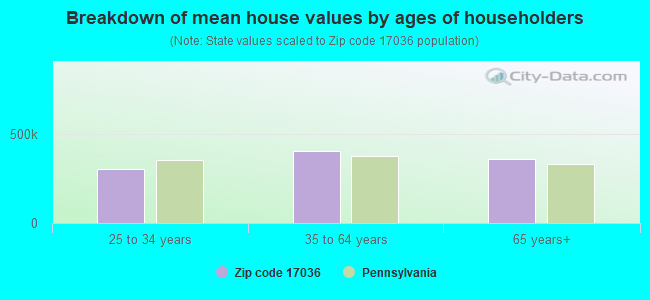
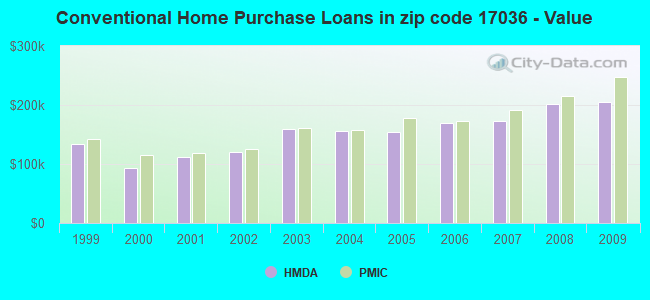
Estimated median house/condo value in 2022: $333,086
17036:
$333,086
Pennsylvania:
$245,500
According to our research of Pennsylvania and other state lists, there were 16 registered sex offenders living in 17036 zip code as of April 27, 2024. The ratio of all residents to sex offenders in zip code 17036 is 1,442 to 1. The ratio of registered sex offenders to all residents in this zip code is much lower than the state average.
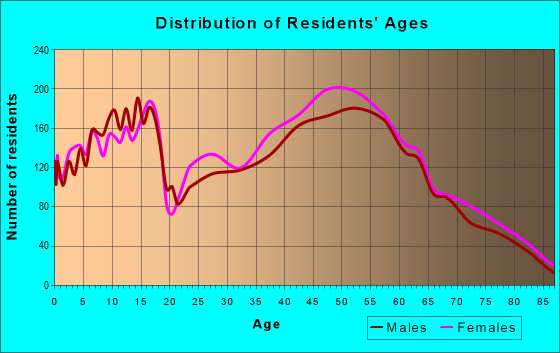
Median resident age:
This zip code:
42.1 years
Pennsylvania median age:
40.9 years
Average household size:
This zip code:
2.3 people
Pennsylvania:
2.4 people
Averages for the 2020 tax year for zip code 17036, filed in 2021:
Average Adjusted Gross Income (AGI) in 2020: $107,555 (Individual Income Tax Returns)
Here:
$107,555
State:
$75,707
Salary/wage: $92,624 (reported on 82.1% of returns)
Here:
$92,624
State:
$62,806
(% of AGI for various income ranges: 1099.5% for AGIs below $25k, 3457.5% for AGIs $25k-50k, 6204.5% for AGIs $50k-75k, 9118.0% for AGIs $75k-100k, 18466.9% for AGIs $100k-200k, 88155.7% for AGIs over 200k)
Taxable interest for individuals: $1,366 (reported on 39.9% of returns)
This zip code:
$1,366
Pennsylvania:
$1,633
(% of AGI for various income ranges: 19.0% for AGIs below $25k, 24.6% for AGIs $25k-50k, 34.7% for AGIs $50k-75k, 51.4% for AGIs $75k-100k, 127.1% for AGIs $100k-200k, 654.3% for AGIs over 200k)
Ordinary dividends: $6,932 (reported on 31.2% of returns)
Here:
$6,932
State:
$7,382
(% of AGI for various income ranges: 40.4% for AGIs below $25k, 61.6% for AGIs $25k-50k, 115.0% for AGIs $50k-75k, 200.6% for AGIs $75k-100k, 438.0% for AGIs $100k-200k, 3112.5% for AGIs over 200k)
Net capital gain/loss in AGI: +$33,847 (reported on 26.2% of returns)
Here:
+$33,847
State:
+$23,522
(% of AGI for various income ranges: 18.3% for AGIs below $25k, 52.3% for AGIs $25k-50k, 80.0% for AGIs $50k-75k, 206.2% for AGIs $75k-100k, 612.6% for AGIs $100k-200k, 19328.2% for AGIs over 200k)
Profit/loss from business: +$18,552 (reported on 13.3% of returns)
Here:
+$18,552
State:
+$16,274
(% of AGI for various income ranges: 70.6% for AGIs below $25k, 60.8% for AGIs $25k-50k, 175.3% for AGIs $50k-75k, 271.4% for AGIs $75k-100k, 470.4% for AGIs $100k-200k, 3359.6% for AGIs over 200k)
Taxable individual retirement arrangement distribution: $22,677 (reported on 12.9% of returns)
17036:
$22,677
Pennsylvania:
$18,583
(% of AGI for various income ranges: 85.5% for AGIs below $25k, 150.3% for AGIs $25k-50k, 295.5% for AGIs $50k-75k, 487.4% for AGIs $75k-100k, 921.3% for AGIs $100k-200k, 2183.3% for AGIs over 200k)
Self-employed (Keogh) retirement plans: $22,609 (reported on 0.9% of returns)
17036:
$22,609
Pennsylvania:
$25,407
(% of AGI for various income ranges: 45.0% for AGIs $100k-200k, 364.1% for AGIs over 200k)
Total itemized deductions: $37,984 (reported on 10.4% of returns)
Here:
$37,984
State:
$34,850
(% of AGI for various income ranges: 71.3% for AGIs below $25k, 93.0% for AGIs $25k-50k, 233.8% for AGIs $50k-75k, 320.9% for AGIs $75k-100k, 809.9% for AGIs $100k-200k, 5751.4% for AGIs over 200k)
Charity contributions: $17,243 (reported on 8.8% of returns)
Here:
$17,243
State:
$12,392
(% of AGI for various income ranges: 3.6% for AGIs below $25k, 17.1% for AGIs $25k-50k, 33.7% for AGIs $50k-75k, 55.8% for AGIs $75k-100k, 214.9% for AGIs $100k-200k, 2902.4% for AGIs over 200k)
Taxes paid: $8,675 (reported on 10.4% of returns)
17036:
$8,675
State:
$8,200
(% of AGI for various income ranges: 8.7% for AGIs below $25k, 18.2% for AGIs $25k-50k, 63.4% for AGIs $50k-75k, 110.3% for AGIs $75k-100k, 239.1% for AGIs $100k-200k, 1113.7% for AGIs over 200k)
Earned income credit: $1,930 (reported on 7.4% of returns)
Here:
$1,930
State:
$2,100
(% of AGI for various income ranges: 52.0% for AGIs below $25k, 43.4% for AGIs $25k-50k)
Percentage of individuals using paid preparers for their 2020 taxes: 92.1%
Here:
92%
State:
92%
(% for various income ranges: 89.7% for AGIs below $25k, 92.6% for AGIs $25k-50k, 93.5% for AGIs $50k-75k, 92.4% for AGIs $75k-100k, 92.8% for AGIs $100k-200k, 93.6% for AGIs over 200k)
Averages for the 2012 tax year for zip code 17036, filed in 2013:
Average Adjusted Gross Income (AGI) in 2012: $87,178 (Individual Income Tax Returns)
Here:
$87,178
State:
$61,346
Salary/wage: $76,181 (reported on 84.3% of returns)
Here:
$76,181
State:
$51,902
(% of AGI for various income ranges: 69.8% for AGIs below $25k, 76.0% for AGIs $25k-50k, 75.0% for AGIs $50k-75k, 76.1% for AGIs $75k-100k, 78.7% for AGIs $100k-200k, 69.4% for AGIs over 200k)
Taxable interest for individuals: $1,308 (reported on 46.5% of returns)
This zip code:
$1,308
Pennsylvania:
$1,588
(% of AGI for various income ranges: 1.3% for AGIs below $25k, 0.6% for AGIs $25k-50k, 0.8% for AGIs $50k-75k, 0.5% for AGIs $75k-100k, 0.5% for AGIs $100k-200k, 0.8% for AGIs over 200k)
Ordinary dividends: $5,093 (reported on 32.6% of returns)
Here:
$5,093
State:
$5,827
(% of AGI for various income ranges: 2.4% for AGIs below $25k, 1.4% for AGIs $25k-50k, 1.5% for AGIs $50k-75k, 1.3% for AGIs $75k-100k, 1.8% for AGIs $100k-200k, 2.3% for AGIs over 200k)
Net capital gain/loss in AGI: +$23,134 (reported on 23.7% of returns)
Here:
+$23,134
State:
+$14,495
(% of AGI for various income ranges: 0.4% for AGIs $25k-50k, 0.5% for AGIs $50k-75k, 0.5% for AGIs $75k-100k, 1.1% for AGIs $100k-200k, 14.1% for AGIs over 200k)
Profit/loss from business: +$17,676 (reported on 13.3% of returns)
Here:
+$17,676
State:
+$16,268
(% of AGI for various income ranges: 5.3% for AGIs below $25k, 2.4% for AGIs $25k-50k, 1.2% for AGIs $50k-75k, 2.8% for AGIs $75k-100k, 2.6% for AGIs $100k-200k, 2.9% for AGIs over 200k)
Taxable individual retirement arrangement distribution: $17,373 (reported on 13.2% of returns)
17036:
$17,373
Pennsylvania:
$14,550
(% of AGI for various income ranges: 4.5% for AGIs below $25k, 3.8% for AGIs $25k-50k, 3.5% for AGIs $50k-75k, 3.2% for AGIs $75k-100k, 3.1% for AGIs $100k-200k, 1.6% for AGIs over 200k)
Self-employment retirement plans: $19,000 (reported on 1.0% of returns)
17036:
$19,000
Pennsylvania:
$20,922
(% of AGI for various income ranges: 0.3% for AGIs below $25k, 0.2% for AGIs $100k-200k, 0.4% for AGIs over 200k)
Total itemized deductions: $25,456 (16% of AGI, reported on 42.9% of returns)
Here:
$25,456
State:
$23,538
Here:
16.0% of AGI
State:
18.4% of AGI
(% of AGI for various income ranges: 11.2% for AGIs below $25k, 9.9% for AGIs $25k-50k, 13.2% for AGIs $50k-75k, 14.0% for AGIs $75k-100k, 15.1% for AGIs $100k-200k, 10.9% for AGIs over 200k)
Charity contributions: $4,512 (reported on 36.3% of returns)
Here:
$4,512
State:
$4,025
(% of AGI for various income ranges: 0.7% for AGIs below $25k, 1.0% for AGIs $25k-50k, 1.6% for AGIs $50k-75k, 1.8% for AGIs $75k-100k, 2.2% for AGIs $100k-200k, 2.0% for AGIs over 200k)
Taxes paid: $11,797 (reported on 42.8% of returns)
17036:
$11,797
State:
$9,982
(% of AGI for various income ranges: 2.6% for AGIs below $25k, 3.2% for AGIs $25k-50k, 4.8% for AGIs $50k-75k, 5.7% for AGIs $75k-100k, 7.1% for AGIs $100k-200k, 6.0% for AGIs over 200k)
Earned income credit: $1,986 (reported on 8.4% of returns)
Here:
$1,986
State:
$2,106
(% of AGI for various income ranges: 3.7% for AGIs below $25k, 0.7% for AGIs $25k-50k)
Percentage of individuals using paid preparers for their 2012 taxes: 47.8%
Here:
48%
State:
53%
(% for various income ranges: 40.0% for AGIs below $25k, 44.0% for AGIs $25k-50k, 49.7% for AGIs $50k-75k, 50.0% for AGIs $75k-100k, 52.0% for AGIs $100k-200k, 73.1% for AGIs over 200k)
Averages for the 2004 tax year for zip code 17036, filed in 2005:
Average Adjusted Gross Income (AGI) in 2004: $64,270 (Individual Income Tax Returns)
Here:
$64,270
State:
$48,049
Salary/wage: $58,085 (reported on 85.6% of returns)
Here:
$58,085
State:
$42,646
(% of AGI for various income ranges: 148.1% for AGIs below $10k, 72.6% for AGIs $10k-25k, 77.9% for AGIs $25k-50k, 80.7% for AGIs $50k-75k, 84.8% for AGIs $75k-100k, 73.7% for AGIs over 100k)
Taxable interest for individuals: $1,265 (reported on 58.9% of returns)
This zip code:
$1,265
Pennsylvania:
$1,657
(% of AGI for various income ranges: 10.1% for AGIs below $10k, 2.4% for AGIs $10k-25k, 1.6% for AGIs $25k-50k, 1.0% for AGIs $50k-75k, 0.8% for AGIs $75k-100k, 1.0% for AGIs over 100k)
Taxable dividends: $3,062 (reported on 37.0% of returns)
Here:
$3,062
State:
$3,566
(% of AGI for various income ranges: 8.3% for AGIs below $10k, 1.7% for AGIs $10k-25k, 1.6% for AGIs $25k-50k, 1.1% for AGIs $50k-75k, 0.8% for AGIs $75k-100k, 2.1% for AGIs over 100k)
Net capital gain/loss: +$9,238 (reported on 27.4% of returns)
Here:
+$9,238
State:
+$9,716
(% of AGI for various income ranges: -3.0% for AGIs below $10k, 1.2% for AGIs $10k-25k, 0.4% for AGIs $25k-50k, 0.5% for AGIs $50k-75k, 1.2% for AGIs $75k-100k, 6.6% for AGIs over 100k)
Profit/loss from business: +$17,689 (reported on 13.3% of returns)
Here:
+$17,689
State:
+$14,267
(% of AGI for various income ranges: 3.4% for AGIs below $10k, 2.8% for AGIs $10k-25k, 2.7% for AGIs $25k-50k, 2.7% for AGIs $50k-75k, 1.9% for AGIs $75k-100k, 4.7% for AGIs over 100k)
IRA payment deduction: $2,910 (reported on 2.8% of returns)
17036:
$2,910
Pennsylvania:
$2,903
(% of AGI for various income ranges: 0.5% for AGIs below $10k, 0.3% for AGIs $10k-25k, 0.3% for AGIs $25k-50k, 0.2% for AGIs $50k-75k, 0.1% for AGIs $75k-100k, 0.1% for AGIs over 100k)
Self-employed pension: $13,817 (reported on 1.4% of returns)
Here:
$13,817
Pennsylvania:
$14,674
(% of AGI for various income ranges: 0.0% for AGIs $25k-50k, 0.1% for AGIs $50k-75k, 0.1% for AGIs $75k-100k, 0.5% for AGIs over 100k)
Total itemized deductions: $20,696 (18% of AGI, reported on 43.1% of returns)
Here:
$20,696
State:
$18,804
Here:
17.9% of AGI
State:
19.5% of AGI
(% of AGI for various income ranges: 14.7% for AGIs below $10k, 9.7% for AGIs $10k-25k, 12.5% for AGIs $25k-50k, 15.2% for AGIs $50k-75k, 17.0% for AGIs $75k-100k, 13.4% for AGIs over 100k)
Charity contributions deductions: $3,651 (3% of AGI, reported on 38.6% of returns)
Here:
$3,651
State:
$3,337
Here:
3.0% of AGI
State:
3.3% of AGI
(% of AGI for various income ranges: 0.7% for AGIs below $10k, 0.8% for AGIs $10k-25k, 1.4% for AGIs $25k-50k, 2.0% for AGIs $50k-75k, 2.1% for AGIs $75k-100k, 2.6% for AGIs over 100k)
Total tax: $11,829 (reported on 78.6% of returns)
17036:
$11,829
State:
$8,008
(% of AGI for various income ranges: 3.2% for AGIs below $10k, 4.4% for AGIs $10k-25k, 7.5% for AGIs $25k-50k, 9.1% for AGIs $50k-75k, 10.0% for AGIs $75k-100k, 19.4% for AGIs over 100k)
Earned income credit: $1,555 (reported on 6.9% of returns)
Here:
$1,555
State:
$1,643
Percentage of individuals using paid preparers for their 2004 taxes: 50.3%
Here:
50%
State:
56%
(% for various income ranges: 43.9% for AGIs below $10k, 47.9% for AGIs $10k-25k, 49.5% for AGIs $25k-50k, 51.0% for AGIs $50k-75k, 50.4% for AGIs $75k-100k, 60.9% for AGIs over 100k)
Likely homosexual households (counted as self-reported same-sex unmarried-partner households)
Lesbian couples: 0.0% of all households
Gay men: 0.2% of all households
Household received Food Stamps/SNAP in the past 12 months: 250 Household did not receive Food Stamps/SNAP in the past 12 months: 9,187
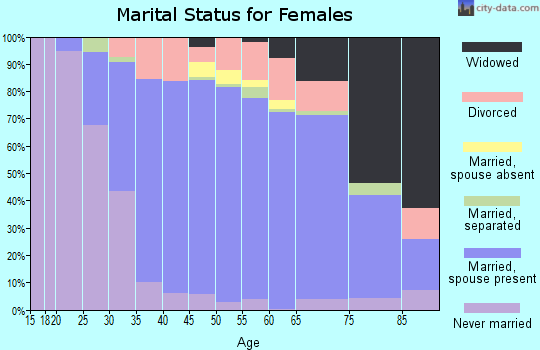
Women who had a birth in the past 12 months: 132 (123 now married, 14 unmarried) Women who did not have a birth in the past 12 months: 4,888 (2,604 now married, 2,261 unmarried)
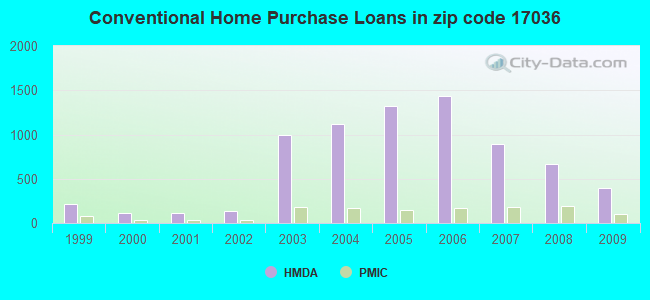
Housing units in zip code 17036 with a mortgage: 4,278 (615 second mortgage, 13 home equity loan, 593 both second mortgage and home equity loan) Houses without a mortgage: 330
Median monthly owner costs for units with a mortgage: $1,848 Median monthly owner costs for units without a mortgage: $712
Residents with income below the poverty level in 2022:
This zip code:
5.7%
Whole state:
11.8%
Residents with income below 50% of the poverty level in 2022:
This zip code:
1.9%
Whole state:
6.1%
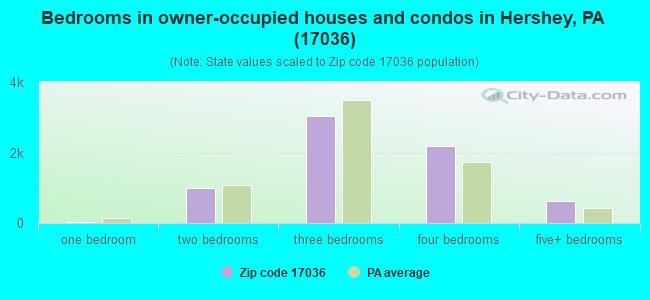
Median number of rooms in houses and condos:
Here:
7.5
State:
6.8
Median number of rooms in apartments:
Here:
4.2
State:
4.3
Notable locations in this zip code not listed on our city pages
Notable locations in zip code 17036: Park Village Plaza (A), Stoverdale Camp (B), Hershey Highmeadow Camp (C), The Hershey Lodge and Convention Center (D), Union Deposit Volunteer Fire Company Station 2 (E), West Hanover Township Fire Company 1 Station 36 - 2 (F), Hummelstown Chemical Fire Company 1 Station 46 (G). Display/hide their locations on the map
Churches in zip code 17036 include: Sand Beach Mission (A), First Baptist Church of Hershey (B), Saint Johns Church (C), Shopes United Methodist Church (D), Stoverdale United Methodist Church (E). Display/hide their locations on the map
3,865 married couples with children.
553 single-parent households (93 men, 460 women).
89.3% of residents of 17036 zip code speak English at home.
2.3% of residents speak Spanish at home (72% very well, 12% well, 16% not well).
4.9% of residents speak other Indo-European language at home (74% very well, 12% well, 4% not well, 11% not at all).
2.0% of residents speak Asian or Pacific Island language at home (68% very well, 20% well, 5% not well, 6% not at all).
1.2% of residents speak other language at home (92% very well, 4% well, 4% not well).
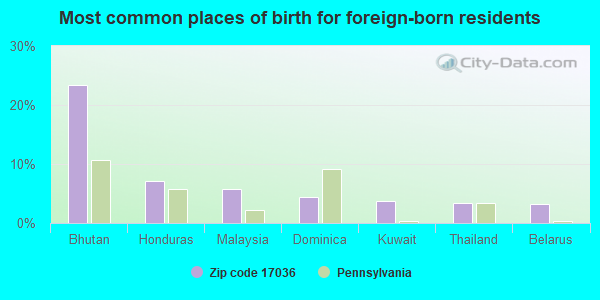
Foreign born population: 1,965 (8.8%) (50.4% of them are naturalized citizens)
This zip code:
8.8%
Whole state:
7.5%
23%Bhutan
7%Honduras
6%Malaysia
4%Dominica
4%Kuwait
3%Thailand
3%Belarus
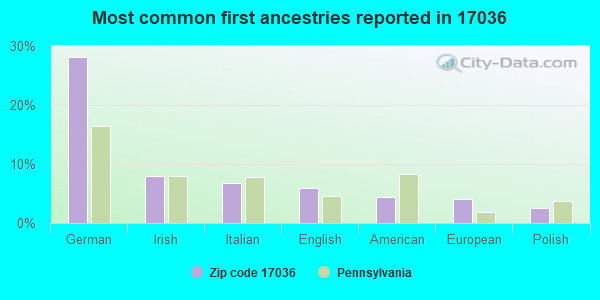
28%German
8%Irish
7%Italian
6%English
4%American
4%European
3%Polish
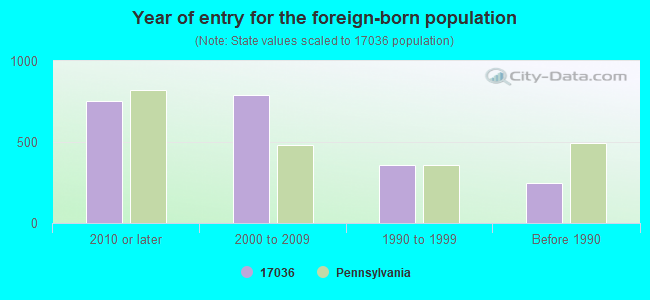
Year of entry for the foreign-born population
7562010 or later
7912000 to 2009
3581990 to 1999
249Before 1990
Facilities with environmental interests located in this zip code:
7 ELEVEN 11406 (888 WEST MAIN STREET in HUMMELSTOWN, PA)
STATE MASTER (Pennsylvania database) - RCRIS-PAD987327517, HAZARDOUS WASTE PROGRAM, PCS-PAG053528, National Pollutant Discharge Elimination System Permit National Pollutant Discharge Elimination System NON-MAJOR (Tracking pollutant discharge elimination systems) - permit Small Quantity Generators, between 100 kg and 1000 kg of hazardous waste/month (Resource Conservation and Recovery Act (tracking hazardous waste)) - notification Business SIC classification: MANUFACTURING INDUSTRIES Organizations: OPERNAME (CONTACT/OPERATOR)
, SOUTHLAND CORPORATION THE (CONTACT/OWNER)
, 7-ELEVEN, INC. (CONTACT/OWNER)
Alternative names: 7 ELEVEN #11406, THE SOUTHLAND CORPORATION
AYCOCK INC (8261 DERRY ST in HUMMELSTOWN, PA)
Small Quantity Generators, between 100 kg and 1000 kg of hazardous waste/month (Resource Conservation and Recovery Act (tracking hazardous waste)) - notification
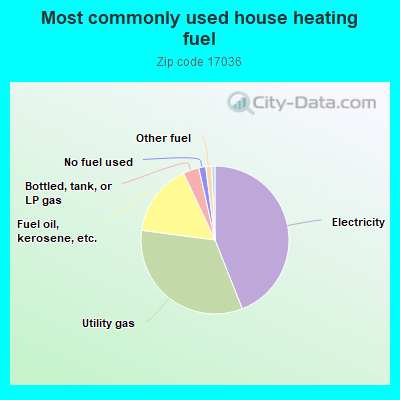
44.0%Electricity
33.1%Utility gas
15.9%Fuel oil, kerosene, etc.
3.5%Bottled, tank, or LP gas
1.5%No fuel used
1.3%Other fuel
Population in 1990: 8,178. Population change in the 1990s: +10,648 (+130.2%).
Place of birth for U.S.-born residents:
This state: 14,980
Northeast: 2,049
Midwest: 826
South: 1,609
West: 705
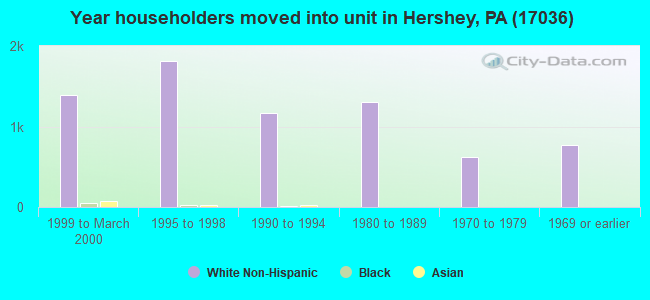
59% of the 17036 zip code residents lived in the same house 5 years ago. Out of people who lived in different houses, 50% lived in this county. Out of people who lived in different counties, 50% lived in Pennsylvania.
92% of the 17036 zip code residents lived in the same house 1 year ago. Out of people who lived in different houses, 48% moved from this county. Out of people who lived in different houses, 24% moved from different county within same state. Out of people who lived in different houses, 23% moved from different state. Out of people who lived in different houses, 7% moved from abroad.
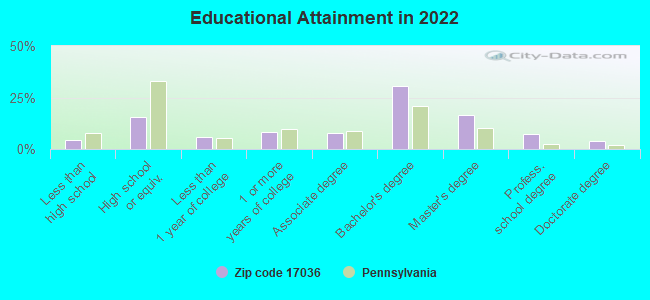
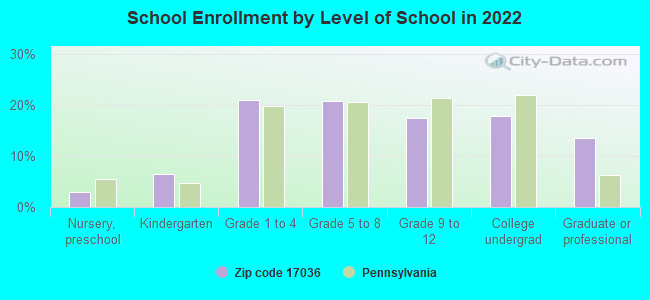
Private vs. public school enrollment:
Students in private schools in grades 1 to 8 (elementary and middle school): 272
Here:
12.1%
Pennsylvania:
15.7%
Students in private schools in grades 9 to 12 (high school): 31
Here:
3.3%
Pennsylvania:
13.4%
Students in private undergraduate colleges: 202
Here:
21.1%
Pennsylvania:
39.8%
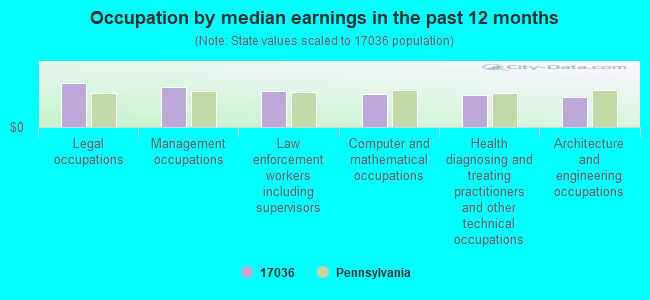
Occupation by median earnings in the past 12 months ($)
120,017Legal occupations
110,421Management occupations
98,850Law enforcement workers including supervisors
88,722Computer and mathematical occupations
86,089Health diagnosing and treating practitioners and other technical occupations
80,848Architecture and engineering occupations
Companies with biggest federal contracts located in this zip code (HUMMELSTOWN, PA):
ARM GROUP INC (1129 WEST GOVERNOR ROAD; small business) : $932,527 in 22 contractsfrom 2002 to 2006
Contracts for Other Architect and Engineering Services, Other Special Studies and Analyses, Engineering and Technical Services, Other Environmental Services, Studies, and Analytical Support by U.S. Army Corps of Engineers - civil program financing only, Army Signed by year:2000: $0; 2001: $0; 2002: $360,097; 2003: $64,948; 2004: $325,449; 2005: $173,766; 2006: $8,267.
Biggest contracts:
$262,997 with U.S. Army Corps of Engineers - civil program financing only for Other Architect and Engineering Services. Signed on 2002-12-18. Completion date: 2003-12-30.
$154,098 with Army for Other Architect and Engineering Services. Signed on 2004-06-18. Completion date: 2003-12-30.
$81,652 with U.S. Army Corps of Engineers - civil program financing only for Other Architect and Engineering Services. Signed on 2003-08-21. Completion date: 2004-09-30.
$78,364 with Army for Other Special Studies and Analyses. Signed on 2005-01-19. Completion date: 2005-12-31.
HYDAS INC (1810 CHURCH RD; small business) : $420,537 in 18 contractsfrom 2002 to 2006
Contracts for Other Professional Services by Army Signed by year:2000: $0; 2001: $0; 2002: $67,650; 2003: $142,203; 2004: $116,496; 2005: $86,298; 2006: $7,890.
Biggest contracts:
$60,832 with Army for Other Professional Services. Taking place in MD. Signed on 2003-07-01. Completion date: 2002-12-31.
$48,000 with Army for Other Professional Services. Signed on 2005-03-09. Completion date: 2005-09-30.
$47,830 with Army for Other Professional Services. Taking place in MD. Signed on 2004-07-23. Completion date: 2002-12-31.
$46,500, same as above.Signed on 2004-01-05. Completion date: 2002-12-31.
ACCURATE PRODUCTS AND SERVICES (331 W MAIN ST; small business) : $158,458 in 8 contractsfrom 2004 to 2006
Contracts for Kitchen Equipment and Appliances, Hardware, Commercial, Industrial Size Reduction Machinery, Specialized Metal Container Manufacturing Machinery and Related Equipment, and moreby Defense Logistics Agency Signed by year:2000: $0; 2001: $0; 2002: $0; 2003: $0; 2004: $98,042; 2005: $47,536; 2006: $12,880.
Biggest contracts:
$72,500 with Defense Logistics Agency for Kitchen Equipment and Appliances. Signed on 2004-04-27. Completion date: 2004-09-07.
$22,990 with Defense Logistics Agency for Hardware, Commercial. Signed on 2005-03-31. Completion date: 2005-06-01.
$18,792 with Defense Logistics Agency for Industrial Size Reduction Machinery. Signed on 2004-11-08. Completion date: 2004-12-29.
$17,500 with Defense Logistics Agency for Hardware, Commercial. Signed on 2005-04-07. Completion date: 2005-06-09.
REINHOLD WM INC (94 ORCHARD RD; small business) : $154,536 in 5 contractsfrom 2005 to 2006
Contracts for Batteries, Nonrechargeable by Army Signed by year:2000: $0; 2001: $0; 2002: $0; 2003: $0; 2004: $0; 2005: $77,026; 2006: $77,510.
Biggest contracts:
$75,888 with Army for Batteries, Nonrechargeable. Signed on 2006-02-03. Completion date: 2006-09-30.
$39,082, same as above.Signed on 2005-03-23. Completion date: 2005-09-30.
$37,944, same as above.Signed on 2005-07-28. Completion date: 2005-11-30.
$9,107, same as above.Signed on 2006-02-03. Completion date: 2006-02-21.
IN-GEAR CYCLING & FITNESS (9030 BRIDGE RD; small business) : $118,491 in 10 contractsfrom 2004 to 2006
Contracts for Athletic and Sporting Equipment by Army Signed by year:2000: $0; 2001: $0; 2002: $0; 2003: $0; 2004: $21,766; 2005: $9,316; 2006: $87,409.
Biggest contracts:
$21,766 with Army for Athletic and Sporting Equipment. Signed on 2004-09-15. Completion date: 2004-11-11.
$21,713, same as above.Signed on 2006-01-24. Completion date: 2006-09-01.
$19,728, same as above.Signed on 2006-02-27. Completion date: 2006-03-31.
$15,130, same as above.Signed on 2006-03-08. Completion date: 2006-04-10.
HAINES AND KIBBLEHOUSE, INC (OLD FARM ROAD) : $52,093 in 7 contractsfrom 2003 to 2005
Contracts for Miscellaneous Construction Materials, Mineral Construction Materials, Bulk, Miscellaneous Items by Army Signed by year:2000: $0; 2001: $0; 2002: $0; 2003: $16,983; 2004: $32,023; 2005: $3,087; 2006: $0.
Biggest contracts:
$26,760 with Army for Miscellaneous Construction Materials. Signed on 2004-06-01. Completion date: 2004-06-02.
$11,903 with Army for Mineral Construction Materials, Bulk. Signed on 2003-09-25. Completion date: 2003-10-16.
$5,275 with Army for Miscellaneous Construction Materials. Signed on 2004-05-12. Completion date: 2004-05-18.
$5,080 with Army for Mineral Construction Materials, Bulk. Signed on 2003-07-10. Completion date: 2003-07-14.
HYDAS WORLD HEALTH (1814 CHURCH RD)
$41,586 with Navy for Laboratory Testing Services. Signed on 2005-09-12. Completion date: 2005-10-13.
DESTINY PROMOTIONS (17 E MAIN ST; small business) : $6,396 in 2 contractsin 2004
$5,596 with Army for Badges and Insignia. Signed on 2004-09-14. Completion date: 2004-10-13.
$800, same as above.Signed on 2004-09-23. Completion date: 2004-10-13.
HILDREW, DOUGLAS (1328 EDGEWOOD DR; small business)
$4,544 with Army for Technical Assistance. Signed on 2003-06-17. Completion date: 2004-06-22.
DAVID S HARTMAN (1214 QUAIL HOLLOW RD; small business) : $81 in 2 contractsin 2004
$81 with Army for Nursing Services. Taking place in HI. Signed on 2004-05-26. Completion date: 2004-05-21.
$0, same as above.Signed on 2004-05-26. Completion date: 2004-05-21.
Top industries in this zip code by the number of employees in 2005:
2005 - 2018 National Fire Incident Reporting System (NFIRS) incidents
According to the data from the years 2005 - 2018 the average number of fires per year is 58. The highest number of reported fire incidents - 75 took place in 2012, and the least - 30 in 2007. The data has a dropping trend.
When looking into fire subcategories, the most incidents belonged to: Structure Fires (73.9%), and Outside Fires (15.3%).
Fire incident types reported to NFIRS in Zip Code 17036
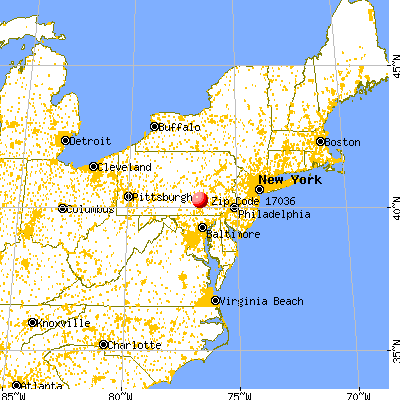


 Nearest zip codes: 17111, 17033, 17057, 17034, 17109, 17112.


 According to the data from the years 2005 - 2018 the average number of fires per year is 58. The highest number of reported fire incidents - 75 took place in 2012, and the least - 30 in 2007. The data has a dropping trend.
 When looking into fire subcategories, the most incidents belonged to: Structure Fires (73.9%), and Outside Fires (15.3%).