Estimated zip code population in 2022: 11,208 Zip code population in 2010: 10,899 Zip code population in 2000: 9,622
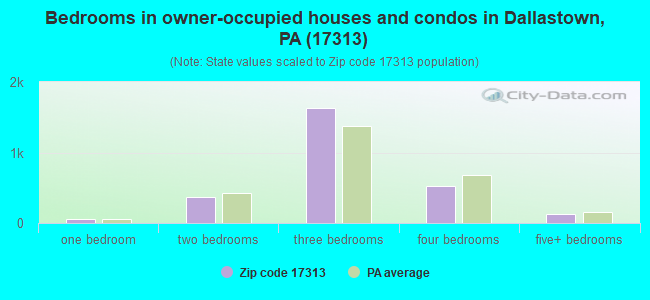
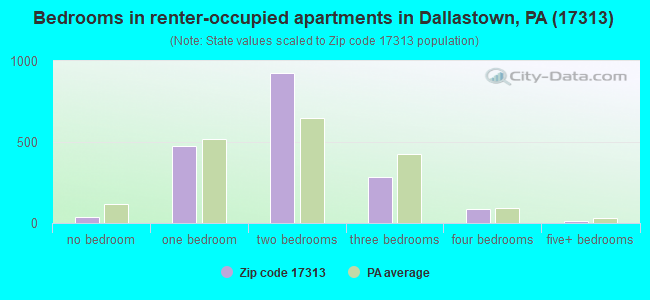
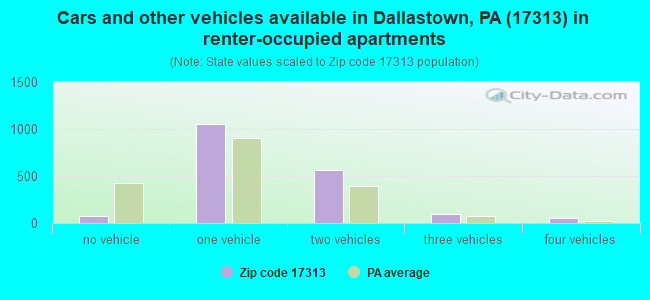
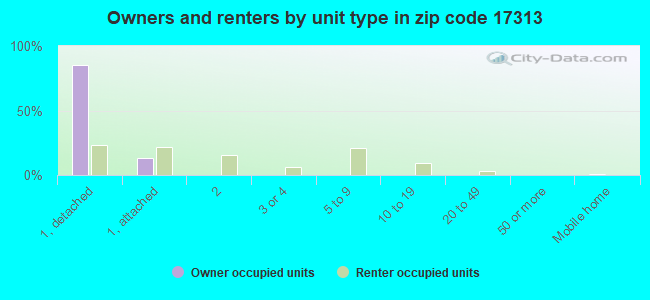
Houses and condos: 4,749 Renter-occupied apartments: 1,827
% of renters here:
40%
State:
31%
March 2022 cost of living index in zip code 17313: 94.7 (less than average, U.S. average is 100)
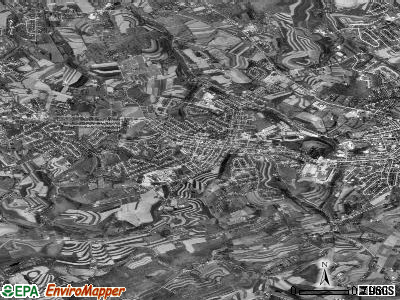
Land area: 10.6 sq. mi. Water area: 0.0 sq. mi.
Population density: 1,058 people per square mile
(low).
OSM Map
General Map
Google Map
MSN Map
OSM Map
General Map
Google Map
MSN Map
OSM Map
General Map
Google Map
MSN Map
OSM Map
General Map
Google Map
MSN Map
Please wait while loading the map...
Real estate property taxes paid for housing units in 2022:
This zip code:
1.5% ($3,564)
Pennsylvania:
1.3% ($3,094)
Median real estate property taxes paid for housing units with mortgages in 2022: $3,671 (1.6%) Median real estate property taxes paid for housing units with no mortgage in 2022: $3,429 (1.5%)
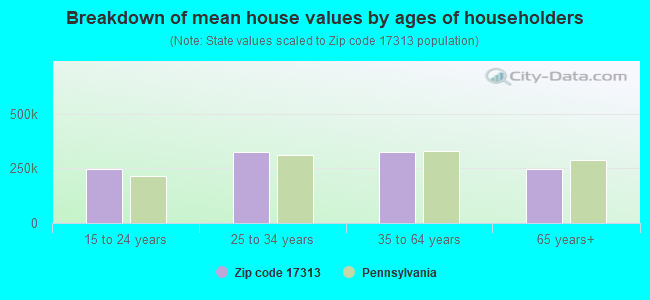
Estimated median house/condo value in 2022: $230,197
17313:
$230,197
Pennsylvania:
$245,500
According to our research of Pennsylvania and other state lists, there were 14 registered sex offenders living in 17313 zip code as of April 27, 2024. The ratio of all residents to sex offenders in zip code 17313 is 774 to 1. The ratio of registered sex offenders to all residents in this zip code is lower than the state average.
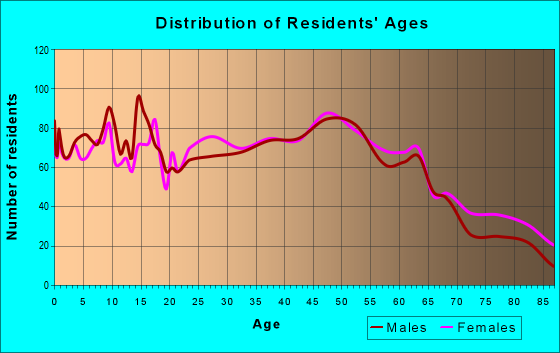
Median resident age:
This zip code:
40.5 years
Pennsylvania median age:
40.9 years
Average household size:
This zip code:
2.4 people
Pennsylvania:
2.4 people
Averages for the 2020 tax year for zip code 17313, filed in 2021:
Average Adjusted Gross Income (AGI) in 2020: $59,682 (Individual Income Tax Returns)
Here:
$59,682
State:
$75,707
Salary/wage: $51,652 (reported on 84.2% of returns)
Here:
$51,652
State:
$62,806
(% of AGI for various income ranges: 1097.0% for AGIs below $25k, 3528.6% for AGIs $25k-50k, 6228.6% for AGIs $50k-75k, 9653.1% for AGIs $75k-100k, 16322.6% for AGIs $100k-200k, 61260.0% for AGIs over 200k)
Taxable interest for individuals: $1,353 (reported on 25.5% of returns)
This zip code:
$1,353
Pennsylvania:
$1,633
(% of AGI for various income ranges: 15.3% for AGIs below $25k, 15.8% for AGIs $25k-50k, 45.1% for AGIs $50k-75k, 49.2% for AGIs $75k-100k, 86.0% for AGIs $100k-200k, 1527.5% for AGIs over 200k)
Ordinary dividends: $3,663 (reported on 17.4% of returns)
Here:
$3,663
State:
$7,382
(% of AGI for various income ranges: 26.2% for AGIs below $25k, 22.2% for AGIs $25k-50k, 56.5% for AGIs $50k-75k, 80.8% for AGIs $75k-100k, 163.0% for AGIs $100k-200k, 3605.0% for AGIs over 200k)
Net capital gain/loss in AGI: +$10,999 (reported on 13.7% of returns)
Here:
+$10,999
State:
+$23,522
(% of AGI for various income ranges: 3.2% for AGIs below $25k, 18.8% for AGIs $25k-50k, 52.3% for AGIs $50k-75k, 106.2% for AGIs $75k-100k, 357.2% for AGIs $100k-200k, 13842.5% for AGIs over 200k)
Profit/loss from business: +$12,595 (reported on 10.8% of returns)
Here:
+$12,595
State:
+$16,274
(% of AGI for various income ranges: 64.9% for AGIs below $25k, 80.6% for AGIs $25k-50k, 138.8% for AGIs $50k-75k, 166.7% for AGIs $75k-100k, 446.8% for AGIs $100k-200k, 4965.0% for AGIs over 200k)
Taxable individual retirement arrangement distribution: $13,553 (reported on 11.4% of returns)
17313:
$13,553
Pennsylvania:
$18,583
(% of AGI for various income ranges: 97.8% for AGIs below $25k, 105.1% for AGIs $25k-50k, 193.5% for AGIs $50k-75k, 235.4% for AGIs $75k-100k, 516.6% for AGIs $100k-200k, 3272.5% for AGIs over 200k)
Total itemized deductions: $32,246 (reported on 4.8% of returns)
Here:
$32,246
State:
$34,850
(% of AGI for various income ranges: 89.2% for AGIs $25k-50k, 182.2% for AGIs $50k-75k, 323.1% for AGIs $75k-100k, 508.7% for AGIs $100k-200k, 5995.0% for AGIs over 200k)
Charity contributions: $9,268 (reported on 3.5% of returns)
Here:
$9,268
State:
$12,392
(% of AGI for various income ranges: 7.3% for AGIs below $25k, 26.0% for AGIs $50k-75k, 26.2% for AGIs $75k-100k, 144.0% for AGIs $100k-200k, 1820.0% for AGIs over 200k)
Taxes paid: $7,969 (reported on 4.8% of returns)
17313:
$7,969
State:
$8,200
(% of AGI for various income ranges: 16.2% for AGIs $25k-50k, 50.5% for AGIs $50k-75k, 78.7% for AGIs $75k-100k, 167.0% for AGIs $100k-200k, 1107.5% for AGIs over 200k)
Earned income credit: $2,027 (reported on 14.7% of returns)
Here:
$2,027
State:
$2,100
(% of AGI for various income ranges: 76.6% for AGIs below $25k, 56.8% for AGIs $25k-50k)
Percentage of individuals using paid preparers for their 2020 taxes: 93.0%
Here:
93%
State:
92%
(% for various income ranges: 90.8% for AGIs below $25k, 94.9% for AGIs $25k-50k, 94.1% for AGIs $50k-75k, 92.7% for AGIs $75k-100k, 93.2% for AGIs $100k-200k, 92.3% for AGIs over 200k)
Averages for the 2012 tax year for zip code 17313, filed in 2013:
Average Adjusted Gross Income (AGI) in 2012: $50,121 (Individual Income Tax Returns)
Here:
$50,121
State:
$61,346
Salary/wage: $43,697 (reported on 86.6% of returns)
Here:
$43,697
State:
$51,902
(% of AGI for various income ranges: 74.4% for AGIs below $25k, 83.3% for AGIs $25k-50k, 81.2% for AGIs $50k-75k, 78.1% for AGIs $75k-100k, 81.1% for AGIs $100k-200k, 35.8% for AGIs over 200k)
Taxable interest for individuals: $944 (reported on 32.8% of returns)
This zip code:
$944
Pennsylvania:
$1,588
(% of AGI for various income ranges: 1.2% for AGIs below $25k, 0.4% for AGIs $25k-50k, 0.6% for AGIs $50k-75k, 0.6% for AGIs $75k-100k, 0.4% for AGIs $100k-200k, 0.9% for AGIs over 200k)
Ordinary dividends: $2,908 (reported on 19.9% of returns)
Here:
$2,908
State:
$5,827
(% of AGI for various income ranges: 1.3% for AGIs below $25k, 0.6% for AGIs $25k-50k, 0.9% for AGIs $50k-75k, 0.8% for AGIs $75k-100k, 0.8% for AGIs $100k-200k, 3.9% for AGIs over 200k)
Net capital gain/loss in AGI: +$3,890 (reported on 13.0% of returns)
Here:
+$3,890
State:
+$14,495
(% of AGI for various income ranges: 0.1% for AGIs $25k-50k, 0.3% for AGIs $50k-75k, 0.2% for AGIs $75k-100k, 0.7% for AGIs $100k-200k, 6.8% for AGIs over 200k)
Profit/loss from business: +$15,028 (reported on 11.1% of returns)
Here:
+$15,028
State:
+$16,268
(% of AGI for various income ranges: 3.4% for AGIs below $25k, 1.6% for AGIs $25k-50k, 2.5% for AGIs $50k-75k, 2.8% for AGIs $75k-100k, 7.0% for AGIs $100k-200k)
Taxable individual retirement arrangement distribution: $12,005 (reported on 11.5% of returns)
17313:
$12,005
Pennsylvania:
$14,550
(% of AGI for various income ranges: 4.5% for AGIs below $25k, 2.5% for AGIs $25k-50k, 2.0% for AGIs $50k-75k, 3.1% for AGIs $75k-100k, 3.8% for AGIs $100k-200k)
Self-employment retirement plans: $12,650 (reported on 0.4% of returns)
17313:
$12,650
Pennsylvania:
$20,922
Total itemized deductions: $19,380 (21% of AGI, reported on 31.4% of returns)
Here:
$19,380
State:
$23,538
Here:
21.2% of AGI
State:
18.4% of AGI
(% of AGI for various income ranges: 8.9% for AGIs below $25k, 9.4% for AGIs $25k-50k, 11.5% for AGIs $50k-75k, 13.3% for AGIs $75k-100k, 14.8% for AGIs $100k-200k, 12.7% for AGIs over 200k)
Charity contributions: $3,703 (reported on 23.2% of returns)
Here:
$3,703
State:
$4,025
(% of AGI for various income ranges: 0.6% for AGIs below $25k, 0.9% for AGIs $25k-50k, 1.1% for AGIs $50k-75k, 1.5% for AGIs $75k-100k, 2.1% for AGIs $100k-200k, 4.4% for AGIs over 200k)
Taxes paid: $7,536 (reported on 31.2% of returns)
17313:
$7,536
State:
$9,982
(% of AGI for various income ranges: 1.6% for AGIs below $25k, 3.1% for AGIs $25k-50k, 4.3% for AGIs $50k-75k, 5.4% for AGIs $75k-100k, 6.6% for AGIs $100k-200k, 5.2% for AGIs over 200k)
Earned income credit: $2,045 (reported on 14.9% of returns)
Here:
$2,045
State:
$2,106
(% of AGI for various income ranges: 5.1% for AGIs below $25k, 0.8% for AGIs $25k-50k)
Percentage of individuals using paid preparers for their 2012 taxes: 48.7%
Here:
49%
State:
53%
(% for various income ranges: 43.2% for AGIs below $25k, 47.3% for AGIs $25k-50k, 54.8% for AGIs $50k-75k, 51.9% for AGIs $75k-100k, 54.9% for AGIs $100k-200k, 85.7% for AGIs over 200k)
Averages for the 2004 tax year for zip code 17313, filed in 2005:
Average Adjusted Gross Income (AGI) in 2004: $43,474 (Individual Income Tax Returns)
Here:
$43,474
State:
$48,049
Salary/wage: $38,589 (reported on 88.4% of returns)
Here:
$38,589
State:
$42,646
(% of AGI for various income ranges: 109.7% for AGIs below $10k, 78.5% for AGIs $10k-25k, 84.6% for AGIs $25k-50k, 85.3% for AGIs $50k-75k, 85.9% for AGIs $75k-100k, 59.8% for AGIs over 100k)
Taxable interest for individuals: $1,387 (reported on 46.0% of returns)
This zip code:
$1,387
Pennsylvania:
$1,657
(% of AGI for various income ranges: 6.6% for AGIs below $10k, 2.1% for AGIs $10k-25k, 1.1% for AGIs $25k-50k, 1.1% for AGIs $50k-75k, 0.8% for AGIs $75k-100k, 2.0% for AGIs over 100k)
Taxable dividends: $2,106 (reported on 25.2% of returns)
Here:
$2,106
State:
$3,566
(% of AGI for various income ranges: 3.9% for AGIs below $10k, 1.0% for AGIs $10k-25k, 0.8% for AGIs $25k-50k, 0.8% for AGIs $50k-75k, 0.6% for AGIs $75k-100k, 2.4% for AGIs over 100k)
Net capital gain/loss: +$7,941 (reported on 17.3% of returns)
Here:
+$7,941
State:
+$9,716
(% of AGI for various income ranges: -2.2% for AGIs below $10k, 0.5% for AGIs $10k-25k, 0.4% for AGIs $25k-50k, 0.7% for AGIs $50k-75k, 1.3% for AGIs $75k-100k, 10.4% for AGIs over 100k)
Profit/loss from business: +$14,012 (reported on 11.1% of returns)
Here:
+$14,012
State:
+$14,267
(% of AGI for various income ranges: 5.4% for AGIs below $10k, 3.0% for AGIs $10k-25k, 2.8% for AGIs $25k-50k, 2.4% for AGIs $50k-75k, 2.6% for AGIs $75k-100k, 6.0% for AGIs over 100k)
IRA payment deduction: $2,563 (reported on 2.5% of returns)
17313:
$2,563
Pennsylvania:
$2,903
(% of AGI for various income ranges: 0.2% for AGIs $10k-25k, 0.2% for AGIs $25k-50k, 0.2% for AGIs $50k-75k, 0.1% for AGIs $75k-100k, 0.1% for AGIs over 100k)
Self-employed pension: $9,576 (reported on 0.7% of returns)
Here:
$9,576
Pennsylvania:
$14,674
Total itemized deductions: $16,219 (21% of AGI, reported on 32.5% of returns)
Here:
$16,219
State:
$18,804
Here:
21.2% of AGI
State:
19.5% of AGI
(% of AGI for various income ranges: 14.3% for AGIs below $10k, 6.9% for AGIs $10k-25k, 9.4% for AGIs $25k-50k, 13.4% for AGIs $50k-75k, 15.5% for AGIs $75k-100k, 12.7% for AGIs over 100k)
Charity contributions deductions: $2,645 (3% of AGI, reported on 26.8% of returns)
Here:
$2,645
State:
$3,337
Here:
3.3% of AGI
State:
3.3% of AGI
(% of AGI for various income ranges: 0.3% for AGIs below $10k, 0.6% for AGIs $10k-25k, 0.9% for AGIs $25k-50k, 1.6% for AGIs $50k-75k, 2.1% for AGIs $75k-100k, 2.4% for AGIs over 100k)
Total tax: $5,873 (reported on 77.4% of returns)
17313:
$5,873
State:
$8,008
(% of AGI for various income ranges: 2.7% for AGIs below $10k, 4.4% for AGIs $10k-25k, 7.3% for AGIs $25k-50k, 8.5% for AGIs $50k-75k, 9.9% for AGIs $75k-100k, 18.0% for AGIs over 100k)
Earned income credit: $1,567 (reported on 11.0% of returns)
Here:
$1,567
State:
$1,643
Percentage of individuals using paid preparers for their 2004 taxes: 53.1%
Here:
53%
State:
56%
(% for various income ranges: 46.4% for AGIs below $10k, 54.1% for AGIs $10k-25k, 53.0% for AGIs $25k-50k, 57.1% for AGIs $50k-75k, 53.1% for AGIs $75k-100k, 59.1% for AGIs over 100k)
Household received Food Stamps/SNAP in the past 12 months: 581 Household did not receive Food Stamps/SNAP in the past 12 months: 3,954
Women who had a birth in the past 12 months: 180 (130 now married, 49 unmarried) Women who did not have a birth in the past 12 months: 2,011 (1,008 now married, 995 unmarried)
Housing units in zip code 17313 with a mortgage: 1,735 (204 second mortgage, 134 both second mortgage and home equity loan) Houses without a mortgage: 112
Median monthly owner costs for units with a mortgage: $1,534 Median monthly owner costs for units without a mortgage: $687
Residents with income below the poverty level in 2022:
This zip code:
7.9%
Whole state:
11.8%
Residents with income below 50% of the poverty level in 2022:
This zip code:
3.8%
Whole state:
6.1%
Median number of rooms in houses and condos:
Here:
7.1
State:
6.8
Median number of rooms in apartments:
Here:
4.4
State:
4.3
Notable locations in this zip code not listed on our city pages
Notable locations in zip code 17313: Yoe Fire and Rescue Company Station 36 (A), Rescue Fire Company Dallastown Station 35 (B). Display/hide their locations on the map
In group quarters: 247 (-1 institutionalized population)
Size of family households: 1,392 2-persons, 916 3-persons, 405 4-persons, 219 5-persons, 172 6-persons, 5 7-or-more-persons
Size of nonfamily households: 1,151 1-person, 252 2-persons, 10 3-persons
1,441 married couples with children.
870 single-parent households (142 men, 728 women).
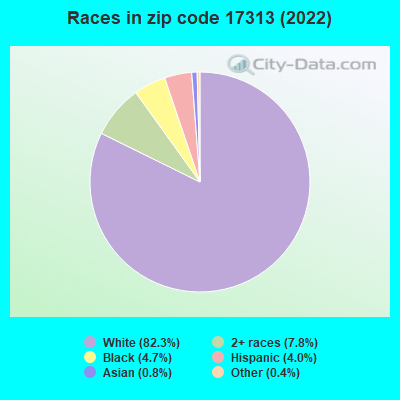
96.6% of residents of 17313 zip code speak English at home.
1.5% of residents speak Spanish at home (53% very well, 20% well, 27% not well).
0.8% of residents speak other Indo-European language at home (44% very well, 26% well, 30% not well).
0.5% of residents speak Asian or Pacific Island language at home (60% very well, 40% well).
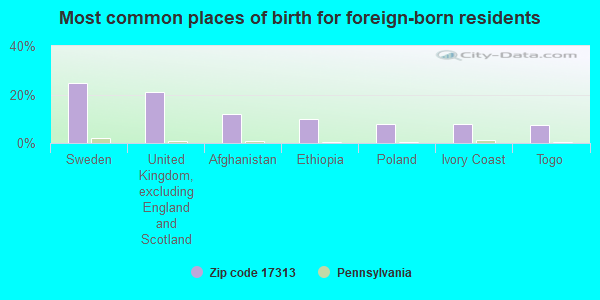
Foreign born population: 240 (2.1%) (68.7% of them are naturalized citizens)
This zip code:
2.1%
Whole state:
7.5%
25%Sweden
21%United Kingdom, excluding England and Scotland
12%Afghanistan
10%Ethiopia
8%Poland
8%Ivory Coast
8%Togo
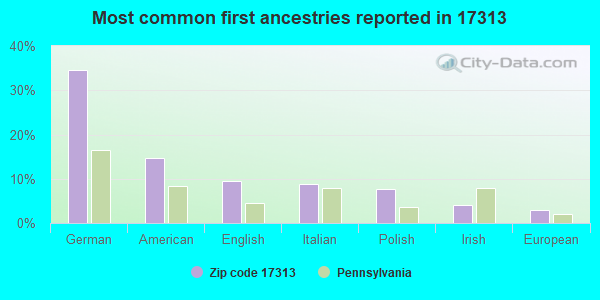
35%German
15%American
10%English
9%Italian
8%Polish
4%Irish
3%European
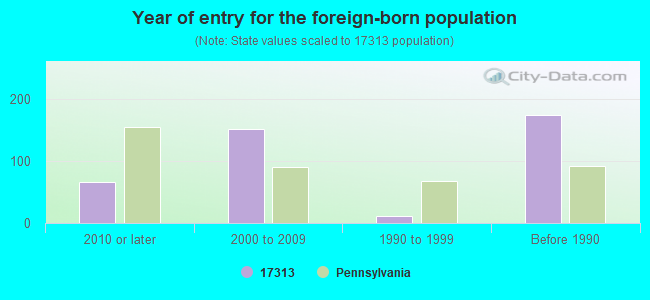
Year of entry for the foreign-born population
662010 or later
1522000 to 2009
121990 to 1999
174Before 1990
Facilities with environmental interests located in this zip code:
ANODIZING OF YORK INCORPORATED (165 EAST BROAD STREET in DALLASTOWN, PA)
(Integrated Compliance Information System) - ICIS-03-1994-0124, FORMAL ENFORCEMENT ACTION Small Quantity Generators, between 100 kg and 1000 kg of hazardous waste/month (Resource Conservation and Recovery Act (tracking hazardous waste)) - notification Organizations: GLATFELTER JAMES D (CONTACT/OWNER)
745 WINDRUSH DRIVE, BRET E. SHUE (745 WINDRUSH DRIVE in DALLASTOWN, PA)
ENFORCEMENT/COMPLIANCE ACTIVITY (Integrated Compliance Information System) Business SIC classification: OPERATORS OF DWELLINGS OTHER THAN APARTMENT BUILDINGS
Housing units lacking complete plumbing facilities: 1.4% Housing units lacking complete kitchen facilities: 1.3%
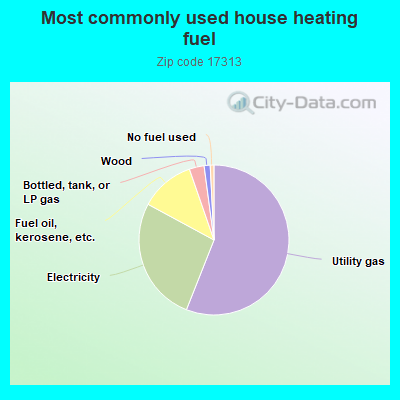
56.0%Utility gas
26.9%Electricity
11.8%Fuel oil, kerosene, etc.
3.2%Bottled, tank, or LP gas
1.3%Wood
0.8%No fuel used
Population in 1990: 8,691. Population change in the 1990s: +931 (+10.7%).
Place of birth for U.S.-born residents:
This state: 8,078
Northeast: 451
Midwest: 217
South: 1,929
West: 90
56% of the 17313 zip code residents lived in the same house 5 years ago. Out of people who lived in different houses, 80% lived in this county. Out of people who lived in different counties, 50% lived in Pennsylvania.
90% of the 17313 zip code residents lived in the same house 1 year ago. Out of people who lived in different houses, 87% moved from this county. Out of people who lived in different houses, 8% moved from different county within same state. Out of people who lived in different houses, 2% moved from different state.
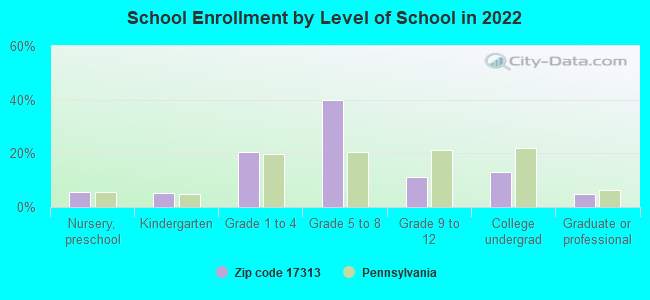
Private vs. public school enrollment:
Students in private schools in grades 1 to 8 (elementary and middle school): 188
Here:
12.7%
Pennsylvania:
15.7%
Students in private schools in grades 9 to 12 (high school): 50
Here:
18.2%
Pennsylvania:
13.4%
Students in private undergraduate colleges: 116
Here:
36.0%
Pennsylvania:
39.8%
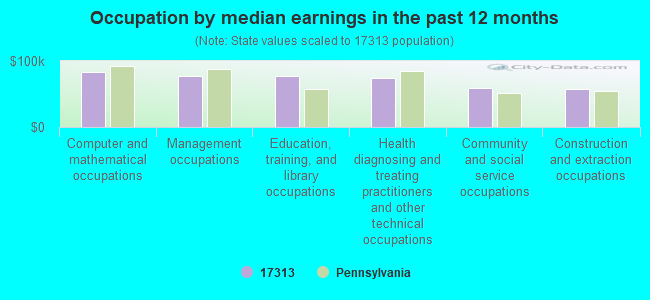
Occupation by median earnings in the past 12 months ($)
82,931Computer and mathematical occupations
77,104Management occupations
77,034Education, training, and library occupations
74,974Health diagnosing and treating practitioners and other technical occupations
59,731Community and social service occupations
57,508Construction and extraction occupations
Companies with federal contracts located in this zip code (DALLASTOWN, PA):
GICHNER SYSTEMS GROUP, INC (490 EAST LOCUST STREET) : $40,450,675 in 314 contractsfrom 1999 to 2006
Contracts for Rigid Wall Shelters, Marine Lifesaving and Diving Equipment, Miscellaneous Communication Equipment, Aircraft Maintenance and Repair Shop Specialized Equipment, and moreby Army, Navy, Air Force, Defense Logistics Agency, and others Signed by year:2000: $6,016,376; 2001: $5,907,548; 2002: $2,829,758; 2003: $4,891,404; 2004: $6,765,658; 2005: $3,309,014; 2006: $8,895,257.
Biggest contracts:
$6,054,316 with Army for Rigid Wall Shelters. Signed on 2006-06-07. Completion date: 2009-09-22.
$2,207,276 with Navy for Rigid Wall Shelters. Signed on 2000-06-30. Completion date: 2000-12-30.
$2,172,272, same as above.Signed on 2003-03-27. Completion date: 2004-03-27.
$1,699,660, same as above.Signed on 2004-05-06. Completion date: 2005-05-18.
UNION CORPORATION (LOCUST STREET EXTENDED) : $29,514,201 in 14 contractsfrom 2000 to 2002
Contracts for Miscellaneous Communication Equipment, Rigid Wall Shelters by Army Signed by year:2000: $25,881,280; 2001: $3,329,828; 2002: $303,093; 2003: $0; 2004: $0; 2005: $0; 2006: $0.
Biggest contracts:
$22,884,260 with Army for Miscellaneous Communication Equipment. Signed on 2000-11-28. Completion date: 2002-09-30.
$2,382,828, same as above.Signed on 2001-09-04. Completion date: 2002-12-31.
$1,436,680 with Army for Rigid Wall Shelters. Signed on 2000-12-08. Completion date: 2002-11-30.
$820,960, same as above.Signed on 2000-12-04. Completion date: 2002-10-31.
WILLIAM A ROWAN (231 KIRSTA LANE; small business) : $100,125 in 5 contractsfrom 2002 to 2005
Contracts for Engineering and Technical Services by Army Signed by year:2000: $0; 2001: $0; 2002: $45,000; 2003: $38,000; 2004: -$7,875; 2005: $25,000; 2006: $0.
Biggest contracts:
$45,000 with Army for Engineering and Technical Services. Taking place in MD. Signed on 2002-09-25. Completion date: 2003-09-30.
$38,000, same as above.Signed on 2003-12-15. Completion date: 2005-03-31.
$25,000, same as above.Signed on 2005-03-25. Completion date: 2005-03-31.
$0, same as above.Signed on 2002-09-25. Completion date: 2003-09-30.
PEAK MOBILITY INC (2797 S QUEEN ST; small business)
$6,875 with Army for Material Handling Equipment, Nonself-Propelled. Signed on 2002-12-30. Completion date: 2002-12-23.
BELL INDUSTRIAL SUPPLIES COMPA (465 N WALNUT ST; small business)
$20 with Navy for Fastening Device. Signed on 2005-04-26. Completion date: 2005-04-08.
Top industries in this zip code by the number of employees in 2005:
Health Care and Social Assistance: Nursing Care Facilities (100-249 employees: 1 establishment, 50-99 employees: 1 establishment, 1-4 employees: 1 establishment)
Health Care and Social Assistance: Offices of Physicians (except Mental Health Specialists) (50-99: 1, 20-49: 2, 1-4: 1)
2002 - 2018 National Fire Incident Reporting System (NFIRS) incidents
Based on the data from the years 2002 - 2018 the average number of fire incidents per year is 24. The highest number of reported fires - 79 took place in 2016, and the least - 2 in 2002. The data has a rising trend.
When looking into fire subcategories, the most incidents belonged to: Structure Fires (51.4%), and Other (27.5%).
Fire incident types reported to NFIRS in Zip Code 17313


 Nearest zip codes: 17407, 17403, 17402, 17356, 17360, 17401.
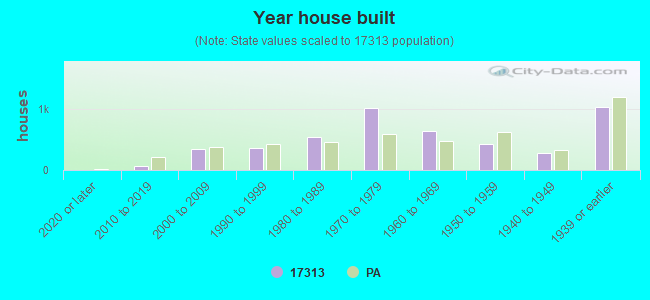


 Based on the data from the years 2002 - 2018 the average number of fire incidents per year is 24. The highest number of reported fires - 79 took place in 2016, and the least - 2 in 2002. The data has a rising trend.
 When looking into fire subcategories, the most incidents belonged to: Structure Fires (51.4%), and Other (27.5%).