Estimated zip code population in 2022: 10,913 Zip code population in 2010: 10,417 Zip code population in 2000: 9,877
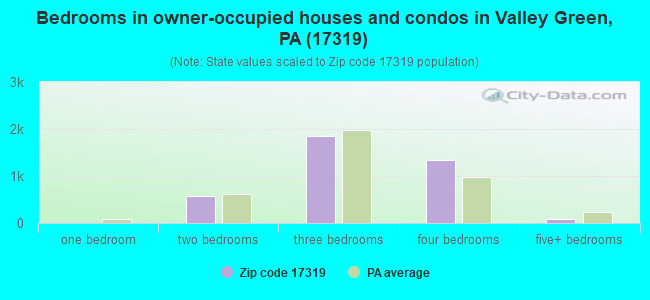
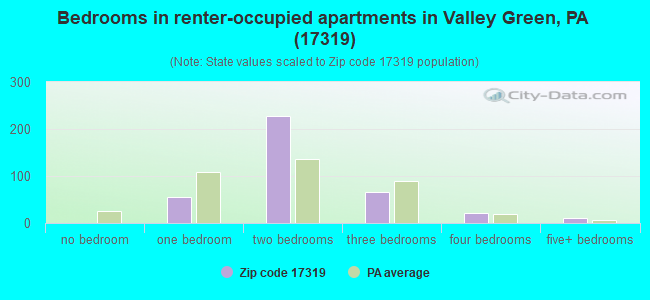
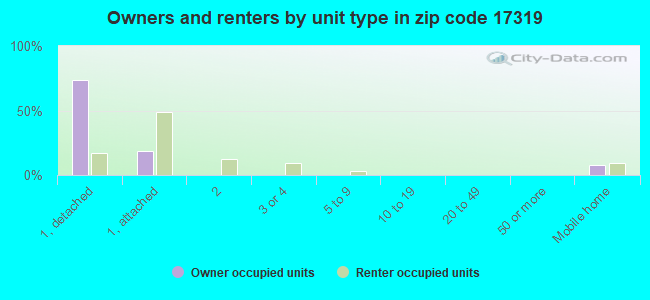
Houses and condos: 4,371 Renter-occupied apartments: 386
% of renters here:
9%
State:
31%
March 2022 cost of living index in zip code 17319: 93.0 (less than average, U.S. average is 100)
Land area: 17.3 sq. mi. Water area: 0.0 sq. mi.
Population density: 629 people per square mile
(low).
OSM Map
General Map
Google Map
MSN Map
OSM Map
General Map
Google Map
MSN Map
OSM Map
General Map
Google Map
MSN Map
OSM Map
General Map
Google Map
MSN Map
Please wait while loading the map...
Real estate property taxes paid for housing units in 2022:
This zip code:
1.2% ($2,661)
Pennsylvania:
1.3% ($3,094)
Median real estate property taxes paid for housing units with mortgages in 2022: $2,804 (1.2%) Median real estate property taxes paid for housing units with no mortgage in 2022: $2,334 (1.0%)
Business Search- 14 Million verified businesses
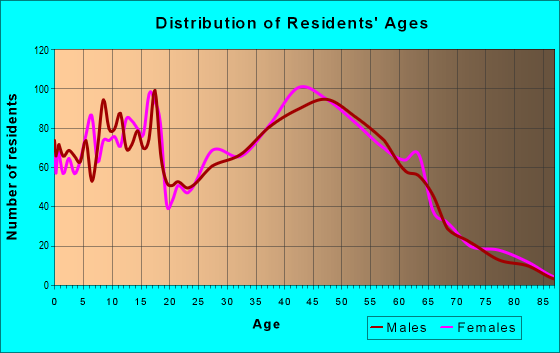
Males: 5,487
(50.3%)
Females: 5,425
(49.7%)
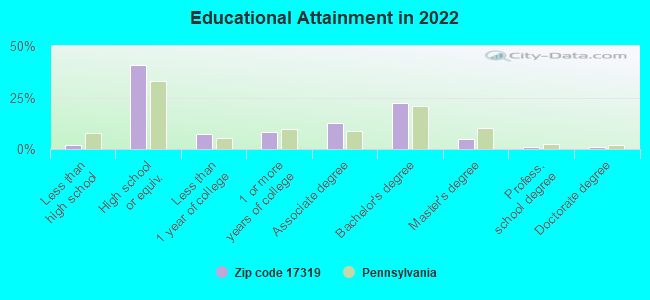
For population 25 years and over in 17319:
High school or higher: 98.2%
Bachelor's degree or higher: 29.0%
Graduate or professional degree: 6.8%
Unemployed: 1.7%
Mean travel time to work (commute): 24.1 minutes
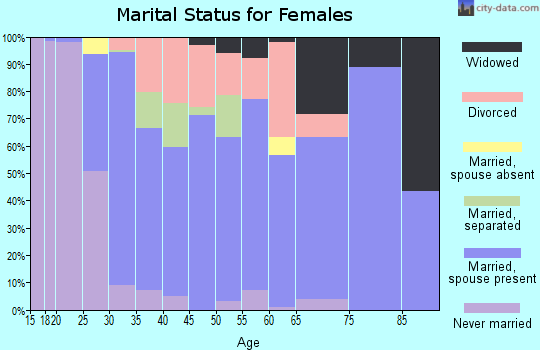
For population 15 years and over in 17319:
Never married: 26.9%
Now married: 60.0%
Separated: 2.3%
Widowed: 4.5%
Divorced: 6.3%
Zip code 17319 compared to state average:
Unemployed percentage below state average.
Black race population percentage significantly below state average.
Hispanic race population percentage below state average.
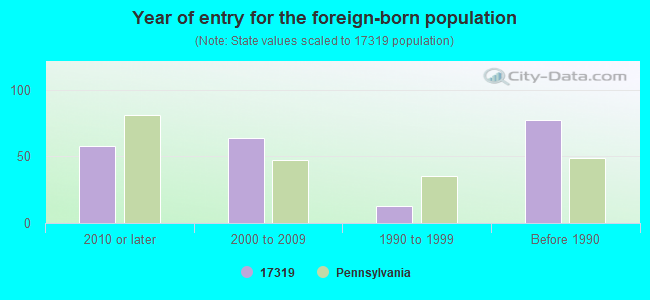
Foreign-born population percentage significantly below state average.
Renting percentage significantly below state average.
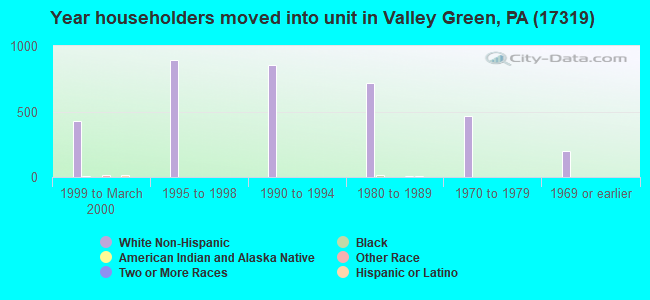
Length of stay since moving in above state average.
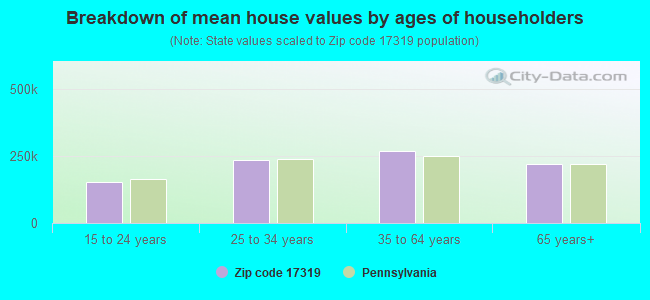
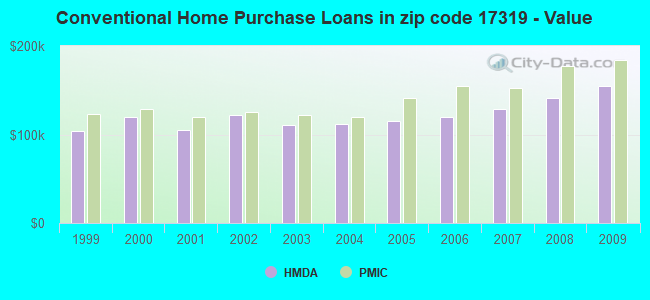
Estimated median house/condo value in 2022: $231,282
17319:
$231,282
Pennsylvania:
$245,500
According to our research of Pennsylvania and other state lists, there were 12 registered sex offenders living in 17319 zip code as of April 26, 2024. The ratio of all residents to sex offenders in zip code 17319 is 965 to 1. The ratio of registered sex offenders to all residents in this zip code is lower than the state average.
Median resident age:
This zip code:
39.0 years
Pennsylvania median age:
40.9 years
Average household size:
This zip code:
2.6 people
Pennsylvania:
2.4 people
Averages for the 2020 tax year for zip code 17319, filed in 2021:
Average Adjusted Gross Income (AGI) in 2020: $72,365 (Individual Income Tax Returns)
Here:
$72,365
State:
$75,707
Salary/wage: $62,881 (reported on 86.0% of returns)
Here:
$62,881
State:
$62,806
(% of AGI for various income ranges: 1128.4% for AGIs below $25k, 3434.1% for AGIs $25k-50k, 6418.7% for AGIs $50k-75k, 8235.3% for AGIs $75k-100k, 17182.5% for AGIs $100k-200k, 49384.4% for AGIs over 200k)
Taxable interest for individuals: $1,036 (reported on 30.9% of returns)
This zip code:
$1,036
Pennsylvania:
$1,633
(% of AGI for various income ranges: 12.5% for AGIs below $25k, 17.3% for AGIs $25k-50k, 28.2% for AGIs $50k-75k, 48.7% for AGIs $75k-100k, 55.1% for AGIs $100k-200k, 717.8% for AGIs over 200k)
Ordinary dividends: $3,698 (reported on 18.4% of returns)
Here:
$3,698
State:
$7,382
(% of AGI for various income ranges: 22.0% for AGIs below $25k, 21.4% for AGIs $25k-50k, 54.0% for AGIs $50k-75k, 65.1% for AGIs $75k-100k, 129.6% for AGIs $100k-200k, 1925.6% for AGIs over 200k)
Net capital gain/loss in AGI: +$8,874 (reported on 14.8% of returns)
Here:
+$8,874
State:
+$23,522
(% of AGI for various income ranges: 4.6% for AGIs below $25k, 10.7% for AGIs $25k-50k, 41.3% for AGIs $50k-75k, 100.0% for AGIs $75k-100k, 257.3% for AGIs $100k-200k, 5112.2% for AGIs over 200k)
Profit/loss from business: +$13,808 (reported on 11.3% of returns)
Here:
+$13,808
State:
+$16,274
(% of AGI for various income ranges: 60.3% for AGIs below $25k, 93.6% for AGIs $25k-50k, 126.2% for AGIs $50k-75k, 118.5% for AGIs $75k-100k, 459.7% for AGIs $100k-200k, 2624.4% for AGIs over 200k)
Taxable individual retirement arrangement distribution: $17,796 (reported on 10.1% of returns)
17319:
$17,796
Pennsylvania:
$18,583
(% of AGI for various income ranges: 68.0% for AGIs below $25k, 107.5% for AGIs $25k-50k, 173.8% for AGIs $50k-75k, 364.3% for AGIs $75k-100k, 505.5% for AGIs $100k-200k, 1642.2% for AGIs over 200k)
Total itemized deductions: $28,712 (reported on 5.8% of returns)
Here:
$28,712
State:
$34,850
(% of AGI for various income ranges: 87.4% for AGIs $25k-50k, 158.4% for AGIs $50k-75k, 247.4% for AGIs $75k-100k, 389.6% for AGIs $100k-200k, 3646.7% for AGIs over 200k)
Charity contributions: $7,571 (reported on 3.7% of returns)
Here:
$7,571
State:
$12,392
(% of AGI for various income ranges: 22.5% for AGIs $50k-75k, 26.6% for AGIs $75k-100k, 90.5% for AGIs $100k-200k, 705.6% for AGIs over 200k)
Taxes paid: $7,706 (reported on 5.8% of returns)
17319:
$7,706
State:
$8,200
(% of AGI for various income ranges: 12.4% for AGIs $25k-50k, 59.7% for AGIs $50k-75k, 77.5% for AGIs $75k-100k, 127.5% for AGIs $100k-200k, 732.2% for AGIs over 200k)
Earned income credit: $2,045 (reported on 9.9% of returns)
Here:
$2,045
State:
$2,100
(% of AGI for various income ranges: 61.4% for AGIs below $25k, 48.3% for AGIs $25k-50k)
Percentage of individuals using paid preparers for their 2020 taxes: 93.3%
Here:
93%
State:
92%
(% for various income ranges: 91.4% for AGIs below $25k, 95.5% for AGIs $25k-50k, 93.2% for AGIs $50k-75k, 94.1% for AGIs $75k-100k, 93.1% for AGIs $100k-200k, 91.3% for AGIs over 200k)
Averages for the 2012 tax year for zip code 17319, filed in 2013:
Average Adjusted Gross Income (AGI) in 2012: $57,368 (Individual Income Tax Returns)
Here:
$57,368
State:
$61,346
Salary/wage: $52,444 (reported on 88.7% of returns)
Here:
$52,444
State:
$51,902
(% of AGI for various income ranges: 76.1% for AGIs below $25k, 81.9% for AGIs $25k-50k, 84.2% for AGIs $50k-75k, 82.7% for AGIs $75k-100k, 83.5% for AGIs $100k-200k, 63.5% for AGIs over 200k)
Taxable interest for individuals: $770 (reported on 37.4% of returns)
This zip code:
$770
Pennsylvania:
$1,588
(% of AGI for various income ranges: 1.0% for AGIs below $25k, 0.4% for AGIs $25k-50k, 0.6% for AGIs $50k-75k, 0.4% for AGIs $75k-100k, 0.4% for AGIs $100k-200k, 1.0% for AGIs over 200k)
Ordinary dividends: $2,600 (reported on 19.9% of returns)
Here:
$2,600
State:
$5,827
(% of AGI for various income ranges: 1.4% for AGIs below $25k, 0.6% for AGIs $25k-50k, 0.3% for AGIs $50k-75k, 0.7% for AGIs $75k-100k, 0.8% for AGIs $100k-200k, 3.2% for AGIs over 200k)
Net capital gain/loss in AGI: +$7,720 (reported on 11.2% of returns)
Here:
+$7,720
State:
+$14,495
(% of AGI for various income ranges: 0.5% for AGIs $25k-50k, 0.6% for AGIs $75k-100k, 0.8% for AGIs $100k-200k, 13.1% for AGIs over 200k)
Profit/loss from business: +$9,683 (reported on 11.9% of returns)
Here:
+$9,683
State:
+$16,268
(% of AGI for various income ranges: 3.7% for AGIs below $25k, 1.6% for AGIs $25k-50k, 2.4% for AGIs $50k-75k, 1.9% for AGIs $75k-100k, 2.3% for AGIs $100k-200k)
Taxable individual retirement arrangement distribution: $12,119 (reported on 8.9% of returns)
17319:
$12,119
Pennsylvania:
$14,550
(% of AGI for various income ranges: 3.5% for AGIs below $25k, 1.8% for AGIs $25k-50k, 1.8% for AGIs $50k-75k, 2.1% for AGIs $75k-100k, 2.0% for AGIs $100k-200k)
Self-employment retirement plans: $10,650 (reported on 0.4% of returns)
17319:
$10,650
Pennsylvania:
$20,922
Total itemized deductions: $17,891 (19% of AGI, reported on 38.5% of returns)
Here:
$17,891
State:
$23,538
Here:
19.4% of AGI
State:
18.4% of AGI
(% of AGI for various income ranges: 7.8% for AGIs below $25k, 9.7% for AGIs $25k-50k, 12.5% for AGIs $50k-75k, 12.7% for AGIs $75k-100k, 13.4% for AGIs $100k-200k, 10.8% for AGIs over 200k)
Charity contributions: $2,597 (reported on 29.2% of returns)
Here:
$2,597
State:
$4,025
(% of AGI for various income ranges: 0.6% for AGIs below $25k, 0.7% for AGIs $25k-50k, 1.2% for AGIs $50k-75k, 1.4% for AGIs $75k-100k, 1.7% for AGIs $100k-200k, 1.5% for AGIs over 200k)
Taxes paid: $7,060 (reported on 38.3% of returns)
17319:
$7,060
State:
$9,982
(% of AGI for various income ranges: 1.7% for AGIs below $25k, 3.0% for AGIs $25k-50k, 4.3% for AGIs $50k-75k, 4.9% for AGIs $75k-100k, 6.0% for AGIs $100k-200k, 5.4% for AGIs over 200k)
Earned income credit: $1,983 (reported on 11.0% of returns)
Here:
$1,983
State:
$2,106
(% of AGI for various income ranges: 4.4% for AGIs below $25k, 0.7% for AGIs $25k-50k)
Percentage of individuals using paid preparers for their 2012 taxes: 40.9%
Here:
41%
State:
53%
(% for various income ranges: 37.3% for AGIs below $25k, 38.7% for AGIs $25k-50k, 43.8% for AGIs $50k-75k, 42.6% for AGIs $75k-100k, 45.6% for AGIs $100k-200k, 55.6% for AGIs over 200k)
Averages for the 2004 tax year for zip code 17319, filed in 2005:
Average Adjusted Gross Income (AGI) in 2004: $48,980 (Individual Income Tax Returns)
Here:
$48,980
State:
$48,049
Salary/wage: $46,442 (reported on 90.7% of returns)
Here:
$46,442
State:
$42,646
(% of AGI for various income ranges: 101.3% for AGIs below $10k, 78.5% for AGIs $10k-25k, 86.9% for AGIs $25k-50k, 88.2% for AGIs $50k-75k, 91.4% for AGIs $75k-100k, 80.4% for AGIs over 100k)
Taxable interest for individuals: $707 (reported on 51.2% of returns)
This zip code:
$707
Pennsylvania:
$1,657
(% of AGI for various income ranges: 3.0% for AGIs below $10k, 1.2% for AGIs $10k-25k, 0.8% for AGIs $25k-50k, 0.5% for AGIs $50k-75k, 0.5% for AGIs $75k-100k, 0.9% for AGIs over 100k)
Taxable dividends: $1,257 (reported on 24.7% of returns)
Here:
$1,257
State:
$3,566
(% of AGI for various income ranges: 2.8% for AGIs below $10k, 1.1% for AGIs $10k-25k, 0.6% for AGIs $25k-50k, 0.5% for AGIs $50k-75k, 0.5% for AGIs $75k-100k, 0.7% for AGIs over 100k)
Net capital gain/loss: +$3,824 (reported on 16.3% of returns)
Here:
+$3,824
State:
+$9,716
(% of AGI for various income ranges: -0.4% for AGIs below $10k, 0.1% for AGIs $10k-25k, 0.4% for AGIs $25k-50k, 0.3% for AGIs $50k-75k, 0.2% for AGIs $75k-100k, 3.8% for AGIs over 100k)
Profit/loss from business: +$8,938 (reported on 13.0% of returns)
Here:
+$8,938
State:
+$14,267
(% of AGI for various income ranges: 5.9% for AGIs below $10k, 3.3% for AGIs $10k-25k, 2.5% for AGIs $25k-50k, 2.1% for AGIs $50k-75k, 1.4% for AGIs $75k-100k, 2.9% for AGIs over 100k)
IRA payment deduction: $2,423 (reported on 2.4% of returns)
17319:
$2,423
Pennsylvania:
$2,903
(% of AGI for various income ranges: 0.1% for AGIs $10k-25k, 0.2% for AGIs $25k-50k, 0.1% for AGIs $50k-75k, 0.1% for AGIs $75k-100k, 0.1% for AGIs over 100k)
Self-employed pension: $9,130 (reported on 0.5% of returns)
Here:
$9,130
Pennsylvania:
$14,674
Total itemized deductions: $14,979 (20% of AGI, reported on 42.9% of returns)
Here:
$14,979
State:
$18,804
Here:
19.7% of AGI
State:
19.5% of AGI
(% of AGI for various income ranges: 8.0% for AGIs below $10k, 7.9% for AGIs $10k-25k, 11.5% for AGIs $25k-50k, 14.5% for AGIs $50k-75k, 14.2% for AGIs $75k-100k, 13.6% for AGIs over 100k)
Charity contributions deductions: $2,020 (3% of AGI, reported on 36.5% of returns)
Here:
$2,020
State:
$3,337
Here:
2.5% of AGI
State:
3.3% of AGI
(% of AGI for various income ranges: 0.6% for AGIs below $10k, 0.7% for AGIs $10k-25k, 1.1% for AGIs $25k-50k, 1.6% for AGIs $50k-75k, 1.5% for AGIs $75k-100k, 1.9% for AGIs over 100k)
Total tax: $6,241 (reported on 82.2% of returns)
17319:
$6,241
State:
$8,008
(% of AGI for various income ranges: 3.0% for AGIs below $10k, 4.6% for AGIs $10k-25k, 7.4% for AGIs $25k-50k, 8.6% for AGIs $50k-75k, 10.3% for AGIs $75k-100k, 15.8% for AGIs over 100k)
Earned income credit: $1,471 (reported on 8.1% of returns)
Here:
$1,471
State:
$1,643
Percentage of individuals using paid preparers for their 2004 taxes: 44.8%
Here:
45%
State:
56%
(% for various income ranges: 37.9% for AGIs below $10k, 45.5% for AGIs $10k-25k, 46.8% for AGIs $25k-50k, 47.5% for AGIs $50k-75k, 41.0% for AGIs $75k-100k, 50.0% for AGIs over 100k)
Likely homosexual households (counted as self-reported same-sex unmarried-partner households)
Lesbian couples: 0.0% of all households
Gay men: 0.2% of all households
Household received Food Stamps/SNAP in the past 12 months: 399 Household did not receive Food Stamps/SNAP in the past 12 months: 3,847
Women who had a birth in the past 12 months: 191 (118 now married, 68 unmarried) Women who did not have a birth in the past 12 months: 2,345 (1,128 now married, 1,210 unmarried)
Housing units in zip code 17319 with a mortgage: 2,829 (191 second mortgage, 182 both second mortgage and home equity loan) Houses without a mortgage: 255
Median monthly owner costs for units with a mortgage: $1,492 Median monthly owner costs for units without a mortgage: $594
Residents with income below the poverty level in 2022:
This zip code:
5.8%
Whole state:
11.8%
Residents with income below 50% of the poverty level in 2022:
This zip code:
2.9%
Whole state:
6.1%
Median number of rooms in houses and condos:
Here:
7.3
State:
6.8
Median number of rooms in apartments:
Here:
4.3
State:
4.3
Notable locations in this zip code not listed on our city pages
Notable locations in zip code 17319: Green Valley Golf Course (A), The Red Land Community Library (B), Newberry Township Fire Department Station 31 (C), Newberry Township Police Department (D), Goldsboro Fire Company Station 28 (E). Display/hide their locations on the map
Churches in zip code 17319 include: Fishing Creek Salem United Methodist Church (A), Saint Pauls Church (B), Zion Church (C). Display/hide their locations on the map
Cemeteries: Goldsboro Cemeteries (1), Fetrow Cemetery (2), Fisher Cemetery (3), Paddletown Cemetery (4), Miller Cemetery (5). Display/hide their locations on the map
In group quarters: 4 (-1 institutionalized population)
Size of family households: 1,367 2-persons, 638 3-persons, 754 4-persons, 393 5-persons, 29 6-persons
Size of nonfamily households: 726 1-person, 324 2-persons, 6 3-persons
1,513 married couples with children.
503 single-parent households (329 men, 174 women).
96.8% of residents of 17319 zip code speak English at home.
1.8% of residents speak Spanish at home (78% very well, 22% well).
0.2% of residents speak other Indo-European language at home (58% very well, 42% well).
0.1% of residents speak Asian or Pacific Island language at home (100% very well).
0.2% of residents speak other language at home (100% very well).
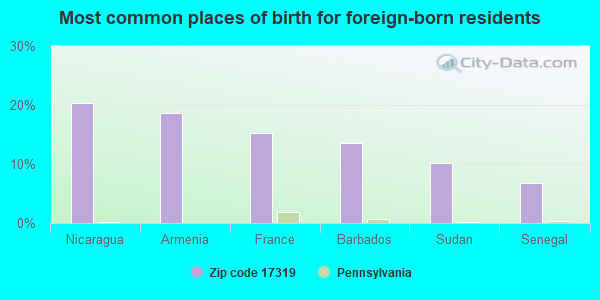
Foreign born population: 59 (0.5%) (65.8% of them are naturalized citizens)
This zip code:
0.5%
Whole state:
7.5%
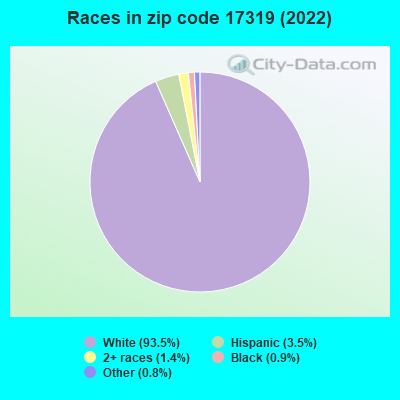
20%Nicaragua
19%Armenia
15%France
14%Barbados
10%Sudan
7%Senegal
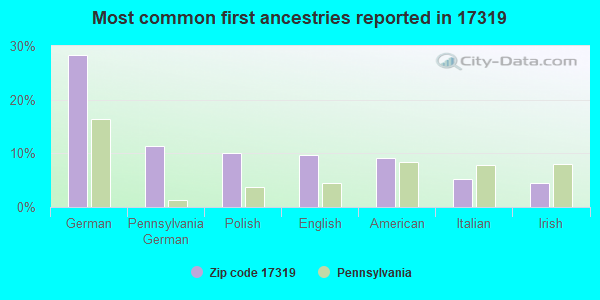
28%German
11%Pennsylvania German
10%Polish
10%English
9%American
5%Italian
5%Irish
Year of entry for the foreign-born population
582010 or later
642000 to 2009
131990 to 1999
77Before 1990
Public elementary/middle schools in in zip code 17319 not listed on the city page:
RED MILL EL SCH(Students: 622, Location: 700 RED MILL RD, Grades: KG-5)
NEWBERRY EL SCH(Students: 432, Location: 2055 OLD TRAIL RD, Grades: KG-5)
Facilities with environmental interests located in this zip code:
BEAN'S AUTOMOTIVE CENTER (784 YOCUMTOWN ROAD in ETTERS, PA)
(Resource Conservation and Recovery Act (tracking hazardous waste)) Organizations: ROBERT BEAN (CONTACT/OWNER)
ACME TRAILER WORKS INC (1015 OLD TRAIL RD in ETTERS, PA)
Conditionally Exempt Small Quantity Generators, less than 100 kg/month of hazardous waste (Resource Conservation and Recovery Act (tracking hazardous waste)) - notification Organizations: MICKLE JOHN (CONTACT/OWNER)
Housing units lacking complete plumbing facilities: 0.0% Housing units lacking complete kitchen facilities: 0.0%
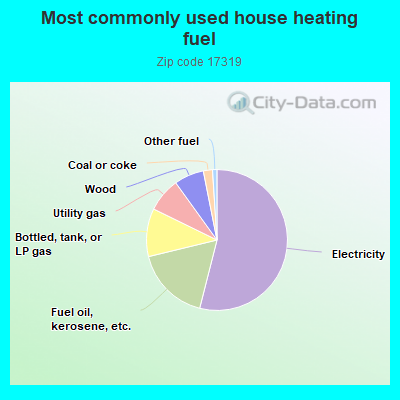
53.8%Electricity
17.2%Fuel oil, kerosene, etc.
11.0%Bottled, tank, or LP gas
7.8%Utility gas
6.8%Wood
2.1%Coal or coke
1.0%Other fuel
Population in 1990: 6,135. Population change in the 1990s: +3,742 (+61.0%).
Place of birth for U.S.-born residents:
This state: 8,806
Northeast: 496
Midwest: 461
South: 776
West: 108
65% of the 17319 zip code residents lived in the same house 5 years ago. Out of people who lived in different houses, 42% lived in this county. Out of people who lived in different counties, 50% lived in Pennsylvania.
96% of the 17319 zip code residents lived in the same house 1 year ago. Out of people who lived in different houses, 43% moved from this county. Out of people who lived in different houses, 33% moved from different county within same state. Out of people who lived in different houses, 31% moved from different state. Out of people who lived in different houses, 1% moved from abroad.
Private vs. public school enrollment:
Students in private schools in grades 1 to 8 (elementary and middle school): 92
Here:
9.3%
Pennsylvania:
15.7%
Students in private schools in grades 9 to 12 (high school): 20
Here:
4.1%
Pennsylvania:
13.4%
Students in private undergraduate colleges: 25
Here:
12.5%
Pennsylvania:
39.8%
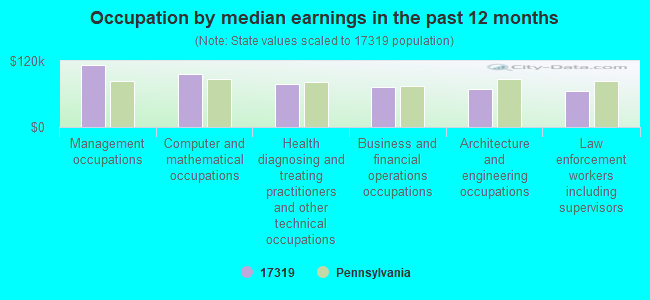
Occupation by median earnings in the past 12 months ($)
113,157Management occupations
96,389Computer and mathematical occupations
79,057Health diagnosing and treating practitioners and other technical occupations
73,522Business and financial operations occupations
68,908Architecture and engineering occupations
65,802Law enforcement workers including supervisors
Companies with federal contracts located in this zip code:
CART MASTERS, INC (604 SALEM RAOD in ETTERS, PA; small business) : $315,312 in 6 contractsfrom 1999 to 2001
Contracts for Maintenance, Repair and Rebuilding of Equipment -- Service and Trade Equipment by Department of Defense Signed by year:2000: $58,248; 2001: $26,550; 2002: $0; 2003: $0; 2004: $0; 2005: $0; 2006: $0.
Biggest contracts:
$124,554 with Department of Defense for Maintenance, Repair and Rebuilding of Equipment -- Service and Trade Equipment. Signed on 1999-12-30. Completion date: 2000-01-31.
$58,248, same as above.Signed on 2000-08-14. Completion date: 2001-06-30.
$41,911, same as above.Signed on 1999-12-29. Completion date: 2000-01-31.
$36,941, same as above.Signed on 1999-12-27. Completion date: 2000-01-31.
H. TREFFINGER REPAIR AND VEHIC (1560 ROBIN HOOD DRIVE in ETTERS, PA; small business)
$64,935 with Defense Logistics Agency for Maintenance, Repair and Rebuilding of Equipment -- Engines, Turbines, and Components. Signed on 2000-03-29. Completion date: 2000-09-30.
Top industries in this zip code by the number of employees in 2005:
Real Estate and Rental and Leasing: Lessors of Nonfinancial Intangible Assets (except Copyrighted Works) (500-999 employees: 1 establishment)
Management of Companies and Enterprises: Corporate, Subsidiary, and Regional Managing Offices (100-249: 1)
2002 - 2018 National Fire Incident Reporting System (NFIRS) incidents
Based on the data from the years 2002 - 2018 the average number of fire incidents per year is 29. The highest number of reported fires - 90 took place in 2003, and the least - 4 in 2009. The data has a rising trend.
When looking into fire subcategories, the most incidents belonged to: Structure Fires (52.4%), and Outside Fires (23.9%).
Fire incident types reported to NFIRS in Zip Code 17319


 Nearest zip codes: 17370, 17034, 17113, 17057, 17070, 17345.


 (Students: 622, Location: 700 RED MILL RD, Grades: KG-5)
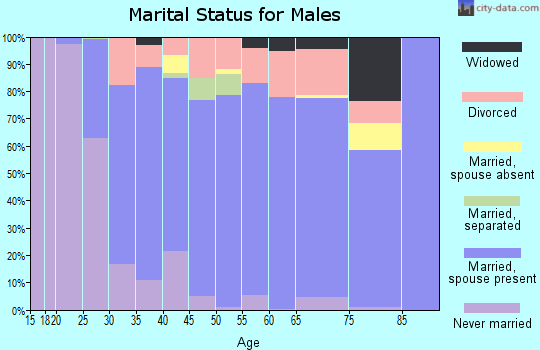

 Based on the data from the years 2002 - 2018 the average number of fire incidents per year is 29. The highest number of reported fires - 90 took place in 2003, and the least - 4 in 2009. The data has a rising trend.
 When looking into fire subcategories, the most incidents belonged to: Structure Fires (52.4%), and Outside Fires (23.9%).