Estimated zip code population in 2022: 6,444 Zip code population in 2010: 7,322 Zip code population in 2000: 7,054
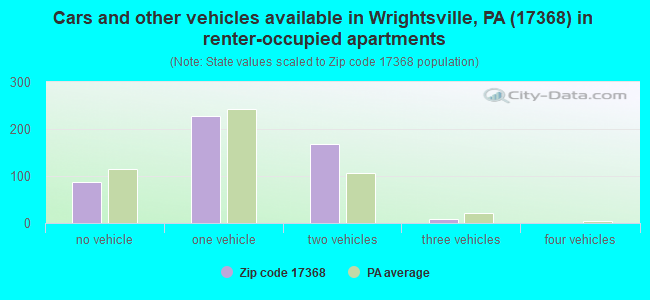
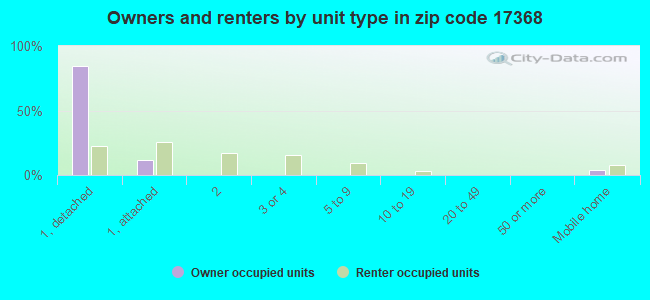
Houses and condos: 3,034 Renter-occupied apartments: 491
% of renters here:
19%
State:
31%
March 2022 cost of living index in zip code 17368: 93.3 (less than average, U.S. average is 100)
Land area: 18.3 sq. mi. Water area: 0.0 sq. mi.
Population density: 352 people per square mile
(very low).
OSM Map
General Map
Google Map
MSN Map
OSM Map
General Map
Google Map
MSN Map
OSM Map
General Map
Google Map
MSN Map
OSM Map
General Map
Google Map
MSN Map
Please wait while loading the map...
Real estate property taxes paid for housing units in 2022:
This zip code:
1.7% ($3,483)
Pennsylvania:
1.3% ($3,094)
Median real estate property taxes paid for housing units with mortgages in 2022: $3,811 (1.7%) Median real estate property taxes paid for housing units with no mortgage in 2022: $2,741 (1.7%)
Estimated median house/condo value in 2022: $201,653
17368:
$201,653
Pennsylvania:
$245,500
According to our research of Pennsylvania and other state lists, there were 14 registered sex offenders living in 17368 zip code as of April 27, 2024. The ratio of all residents to sex offenders in zip code 17368 is 523 to 1. The ratio of registered sex offenders to all residents in this zip code is near the state average.
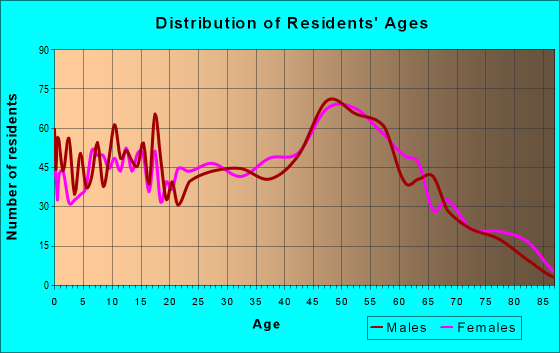
Median resident age:
This zip code:
43.5 years
Pennsylvania median age:
40.9 years
Average household size:
This zip code:
2.5 people
Pennsylvania:
2.4 people
Averages for the 2020 tax year for zip code 17368, filed in 2021:
Average Adjusted Gross Income (AGI) in 2020: $63,804 (Individual Income Tax Returns)
Here:
$63,804
State:
$75,707
Salary/wage: $54,909 (reported on 84.8% of returns)
Here:
$54,909
State:
$62,806
(% of AGI for various income ranges: 1007.7% for AGIs below $25k, 3627.1% for AGIs $25k-50k, 5990.2% for AGIs $50k-75k, 8540.8% for AGIs $75k-100k, 16433.1% for AGIs $100k-200k, 82916.7% for AGIs over 200k)
Taxable interest for individuals: $1,576 (reported on 24.8% of returns)
This zip code:
$1,576
Pennsylvania:
$1,633
(% of AGI for various income ranges: 17.5% for AGIs below $25k, 10.8% for AGIs $25k-50k, 19.2% for AGIs $50k-75k, 20.8% for AGIs $75k-100k, 158.9% for AGIs $100k-200k, 1976.7% for AGIs over 200k)
Ordinary dividends: $5,301 (reported on 17.2% of returns)
Here:
$5,301
State:
$7,382
(% of AGI for various income ranges: 26.6% for AGIs below $25k, 43.9% for AGIs $25k-50k, 69.2% for AGIs $50k-75k, 84.1% for AGIs $75k-100k, 238.9% for AGIs $100k-200k, 5146.7% for AGIs over 200k)
Net capital gain/loss in AGI: +$15,904 (reported on 13.5% of returns)
Here:
+$15,904
State:
+$23,522
(% of AGI for various income ranges: 18.4% for AGIs below $25k, 21.3% for AGIs $25k-50k, 59.6% for AGIs $50k-75k, 81.4% for AGIs $75k-100k, 412.0% for AGIs $100k-200k, 20650.0% for AGIs over 200k)
Profit/loss from business: +$13,762 (reported on 11.2% of returns)
Here:
+$13,762
State:
+$16,274
(% of AGI for various income ranges: 69.7% for AGIs below $25k, 106.8% for AGIs $25k-50k, 194.7% for AGIs $50k-75k, 327.8% for AGIs $75k-100k, 614.6% for AGIs $100k-200k, 996.7% for AGIs over 200k)
Taxable individual retirement arrangement distribution: $17,648 (reported on 10.0% of returns)
17368:
$17,648
Pennsylvania:
$18,583
(% of AGI for various income ranges: 77.3% for AGIs below $25k, 71.2% for AGIs $25k-50k, 219.2% for AGIs $50k-75k, 231.6% for AGIs $75k-100k, 556.6% for AGIs $100k-200k, 6186.7% for AGIs over 200k)
Total itemized deductions: $32,274 (reported on 4.8% of returns)
Here:
$32,274
State:
$34,850
(% of AGI for various income ranges: 63.8% for AGIs below $25k, 155.5% for AGIs $50k-75k, 189.5% for AGIs $75k-100k, 645.4% for AGIs $100k-200k, 6190.0% for AGIs over 200k)
Charity contributions: $10,633 (reported on 3.8% of returns)
Here:
$10,633
State:
$12,392
(% of AGI for various income ranges: 16.7% for AGIs $25k-50k, 14.9% for AGIs $75k-100k, 167.7% for AGIs $100k-200k, 2676.7% for AGIs over 200k)
Taxes paid: $8,626 (reported on 4.8% of returns)
17368:
$8,626
State:
$8,200
(% of AGI for various income ranges: 57.7% for AGIs $50k-75k, 74.3% for AGIs $75k-100k, 184.9% for AGIs $100k-200k, 1370.0% for AGIs over 200k)
Earned income credit: $2,094 (reported on 12.0% of returns)
Here:
$2,094
State:
$2,100
(% of AGI for various income ranges: 70.0% for AGIs below $25k, 51.8% for AGIs $25k-50k)
Percentage of individuals using paid preparers for their 2020 taxes: 92.5%
Here:
92%
State:
92%
(% for various income ranges: 90.9% for AGIs below $25k, 93.6% for AGIs $25k-50k, 94.0% for AGIs $50k-75k, 91.5% for AGIs $75k-100k, 92.6% for AGIs $100k-200k, 91.7% for AGIs over 200k)
Averages for the 2012 tax year for zip code 17368, filed in 2013:
Average Adjusted Gross Income (AGI) in 2012: $54,784 (Individual Income Tax Returns)
Here:
$54,784
State:
$61,346
Salary/wage: $46,639 (reported on 85.7% of returns)
Here:
$46,639
State:
$51,902
(% of AGI for various income ranges: 71.0% for AGIs below $25k, 81.8% for AGIs $25k-50k, 82.8% for AGIs $50k-75k, 82.1% for AGIs $75k-100k, 78.1% for AGIs $100k-200k, 42.1% for AGIs over 200k)
Taxable interest for individuals: $1,225 (reported on 31.8% of returns)
This zip code:
$1,225
Pennsylvania:
$1,588
(% of AGI for various income ranges: 1.3% for AGIs below $25k, 0.6% for AGIs $25k-50k, 0.4% for AGIs $50k-75k, 0.6% for AGIs $75k-100k, 0.9% for AGIs $100k-200k, 0.9% for AGIs over 200k)
Ordinary dividends: $4,800 (reported on 20.2% of returns)
Here:
$4,800
State:
$5,827
(% of AGI for various income ranges: 1.6% for AGIs below $25k, 0.8% for AGIs $25k-50k, 0.9% for AGIs $50k-75k, 0.7% for AGIs $75k-100k, 1.9% for AGIs $100k-200k, 4.4% for AGIs over 200k)
Net capital gain/loss in AGI: +$10,511 (reported on 11.9% of returns)
Here:
+$10,511
State:
+$14,495
(% of AGI for various income ranges: 0.1% for AGIs $25k-50k, 0.5% for AGIs $50k-75k, 0.3% for AGIs $75k-100k, 1.2% for AGIs $100k-200k, 10.0% for AGIs over 200k)
Profit/loss from business: +$13,452 (reported on 11.3% of returns)
Here:
+$13,452
State:
+$16,268
(% of AGI for various income ranges: 4.1% for AGIs below $25k, 3.3% for AGIs $25k-50k, 1.6% for AGIs $50k-75k, 3.4% for AGIs $75k-100k, 4.9% for AGIs $100k-200k)
Taxable individual retirement arrangement distribution: $11,992 (reported on 10.8% of returns)
17368:
$11,992
Pennsylvania:
$14,550
(% of AGI for various income ranges: 4.2% for AGIs below $25k, 2.6% for AGIs $25k-50k, 2.1% for AGIs $50k-75k, 2.2% for AGIs $75k-100k, 3.8% for AGIs $100k-200k)
Total itemized deductions: $20,359 (19% of AGI, reported on 29.9% of returns)
Here:
$20,359
State:
$23,538
Here:
19.4% of AGI
State:
18.4% of AGI
(% of AGI for various income ranges: 7.4% for AGIs below $25k, 8.3% for AGIs $25k-50k, 11.3% for AGIs $50k-75k, 11.8% for AGIs $75k-100k, 14.1% for AGIs $100k-200k, 11.1% for AGIs over 200k)
Charity contributions: $3,344 (reported on 21.8% of returns)
Here:
$3,344
State:
$4,025
(% of AGI for various income ranges: 0.7% for AGIs below $25k, 0.6% for AGIs $25k-50k, 1.0% for AGIs $50k-75k, 1.4% for AGIs $75k-100k, 1.9% for AGIs $100k-200k, 1.9% for AGIs over 200k)
Taxes paid: $8,783 (reported on 29.9% of returns)
17368:
$8,783
State:
$9,982
(% of AGI for various income ranges: 2.2% for AGIs below $25k, 2.8% for AGIs $25k-50k, 4.1% for AGIs $50k-75k, 4.6% for AGIs $75k-100k, 6.3% for AGIs $100k-200k, 6.9% for AGIs over 200k)
Earned income credit: $2,060 (reported on 14.0% of returns)
Here:
$2,060
State:
$2,106
(% of AGI for various income ranges: 4.8% for AGIs below $25k, 0.9% for AGIs $25k-50k)
Percentage of individuals using paid preparers for their 2012 taxes: 47.7%
Here:
48%
State:
53%
(% for various income ranges: 41.5% for AGIs below $25k, 45.5% for AGIs $25k-50k, 52.4% for AGIs $50k-75k, 54.3% for AGIs $75k-100k, 57.1% for AGIs $100k-200k, 71.4% for AGIs over 200k)
Averages for the 2004 tax year for zip code 17368, filed in 2005:
Average Adjusted Gross Income (AGI) in 2004: $46,698 (Individual Income Tax Returns)
Here:
$46,698
State:
$48,049
Salary/wage: $40,805 (reported on 88.6% of returns)
Here:
$40,805
State:
$42,646
(% of AGI for various income ranges: 124.8% for AGIs below $10k, 78.0% for AGIs $10k-25k, 86.0% for AGIs $25k-50k, 88.0% for AGIs $50k-75k, 87.4% for AGIs $75k-100k, 54.5% for AGIs over 100k)
Taxable interest for individuals: $1,494 (reported on 47.2% of returns)
This zip code:
$1,494
Pennsylvania:
$1,657
(% of AGI for various income ranges: 6.4% for AGIs below $10k, 2.1% for AGIs $10k-25k, 1.0% for AGIs $25k-50k, 0.8% for AGIs $50k-75k, 0.8% for AGIs $75k-100k, 2.5% for AGIs over 100k)
Taxable dividends: $2,304 (reported on 23.3% of returns)
Here:
$2,304
State:
$3,566
(% of AGI for various income ranges: 7.5% for AGIs below $10k, 1.5% for AGIs $10k-25k, 0.6% for AGIs $25k-50k, 0.6% for AGIs $50k-75k, 1.0% for AGIs $75k-100k, 1.8% for AGIs over 100k)
Net capital gain/loss: +$11,389 (reported on 16.5% of returns)
Here:
+$11,389
State:
+$9,716
(% of AGI for various income ranges: -1.6% for AGIs below $10k, 0.3% for AGIs $10k-25k, 0.4% for AGIs $25k-50k, 0.3% for AGIs $50k-75k, 1.2% for AGIs $75k-100k, 12.7% for AGIs over 100k)
Profit/loss from business: +$17,733 (reported on 12.3% of returns)
Here:
+$17,733
State:
+$14,267
(% of AGI for various income ranges: -2.4% for AGIs below $10k, 3.0% for AGIs $10k-25k, 2.8% for AGIs $25k-50k, 3.0% for AGIs $50k-75k, 3.6% for AGIs $75k-100k, 8.8% for AGIs over 100k)
IRA payment deduction: $2,918 (reported on 2.4% of returns)
17368:
$2,918
Pennsylvania:
$2,903
(% of AGI for various income ranges: 0.2% for AGIs $25k-50k, 0.2% for AGIs $50k-75k, 0.2% for AGIs $75k-100k, 0.1% for AGIs over 100k)
Self-employed pension: $12,182 (reported on 0.6% of returns)
Here:
$12,182
Pennsylvania:
$14,674
Total itemized deductions: $16,802 (20% of AGI, reported on 32.1% of returns)
Here:
$16,802
State:
$18,804
Here:
19.8% of AGI
State:
19.5% of AGI
(% of AGI for various income ranges: 14.5% for AGIs below $10k, 5.7% for AGIs $10k-25k, 9.0% for AGIs $25k-50k, 11.6% for AGIs $50k-75k, 13.6% for AGIs $75k-100k, 13.9% for AGIs over 100k)
Charity contributions deductions: $2,713 (3% of AGI, reported on 25.6% of returns)
Here:
$2,713
State:
$3,337
Here:
3.0% of AGI
State:
3.3% of AGI
(% of AGI for various income ranges: 0.5% for AGIs $10k-25k, 0.8% for AGIs $25k-50k, 1.2% for AGIs $50k-75k, 1.5% for AGIs $75k-100k, 2.6% for AGIs over 100k)
Total tax: $6,812 (reported on 79.7% of returns)
17368:
$6,812
State:
$8,008
(% of AGI for various income ranges: 3.2% for AGIs below $10k, 4.5% for AGIs $10k-25k, 7.7% for AGIs $25k-50k, 9.0% for AGIs $50k-75k, 10.7% for AGIs $75k-100k, 19.7% for AGIs over 100k)
Earned income credit: $1,528 (reported on 10.5% of returns)
Here:
$1,528
State:
$1,643
Percentage of individuals using paid preparers for their 2004 taxes: 53.5%
Here:
53%
State:
56%
(% for various income ranges: 43.6% for AGIs below $10k, 52.8% for AGIs $10k-25k, 54.3% for AGIs $25k-50k, 54.9% for AGIs $50k-75k, 56.8% for AGIs $75k-100k, 70.2% for AGIs over 100k)
Likely homosexual households (counted as self-reported same-sex unmarried-partner households)
Lesbian couples: 0.0% of all households
Gay men: 0.5% of all households
Household received Food Stamps/SNAP in the past 12 months: 241 Household did not receive Food Stamps/SNAP in the past 12 months: 2,368
Women who had a birth in the past 12 months: 64 (50 now married, 14 unmarried) Women who did not have a birth in the past 12 months: 1,261 (632 now married, 624 unmarried)
Housing units in zip code 17368 with a mortgage: 1,341 (182 second mortgage, 141 both second mortgage and home equity loan) Houses without a mortgage: 97
Median monthly owner costs for units with a mortgage: $1,436 Median monthly owner costs for units without a mortgage: $609
Residents with income below the poverty level in 2022:
This zip code:
9.0%
Whole state:
11.8%
Residents with income below 50% of the poverty level in 2022:
This zip code:
3.8%
Whole state:
6.1%
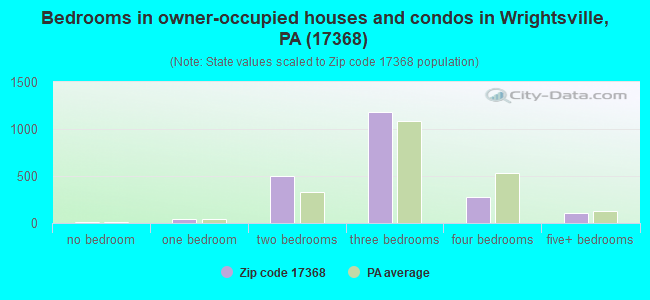
Median number of rooms in houses and condos:
Here:
6.3
State:
6.8
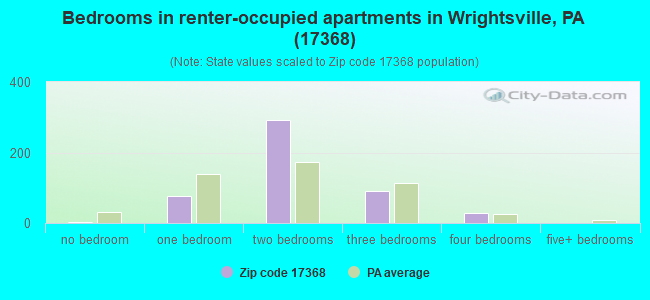
Median number of rooms in apartments:
Here:
5.0
State:
4.3
Notable locations in this zip code not listed on our city pages
Notable locations in zip code 17368: Cool Brook Country Club (A), Lauxmont Farms (B), Coal Brook Country Club (C), Lehman Farm (D), Long Level (E), Lauxman Farms (F), Wrightsville Steam Engine and Hose Company 1 Station 41 (G), Eastern York County Forest Fire Crew (H), Craley Community Fire Company Station 44 (I). Display/hide their locations on the map
Churches in zip code 17368 include: Trinity Church (A), Saint Marys Chapel (B), Saint Paul Church (C), Calvary Church (D), Springville Church (E), Ebenezer Church (F). Display/hide their locations on the map
Size of family households: 815 2-persons, 316 3-persons, 353 4-persons, 164 5-persons, 34 6-persons, 42 7-or-more-persons
Size of nonfamily households: 685 1-person, 208 2-persons
997 married couples with children.
245 single-parent households (77 men, 168 women).
96.1% of residents of 17368 zip code speak English at home.
1.6% of residents speak Spanish at home (63% very well, 22% well, 15% not well).
1.8% of residents speak other Indo-European language at home (29% very well, 52% well, 19% not at all).
0.1% of residents speak other language at home (60% very well, 40% well).
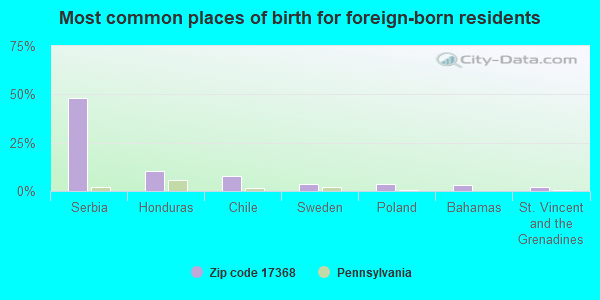
Foreign born population: 132 (2.1%) (31.9% of them are naturalized citizens)
This zip code:
2.1%
Whole state:
7.5%
48%Serbia
11%Honduras
8%Chile
4%Sweden
4%Poland
3%Bahamas
2%St. Vincent and the Grenadines
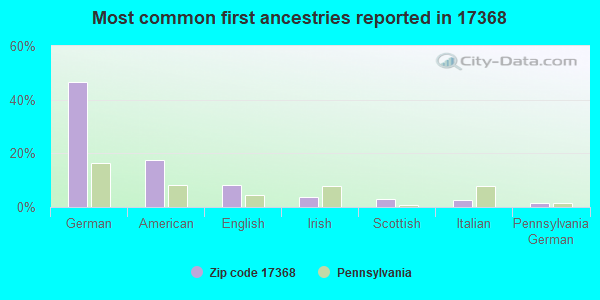
47%German
17%American
8%English
4%Irish
3%Scottish
3%Italian
2%Pennsylvania German
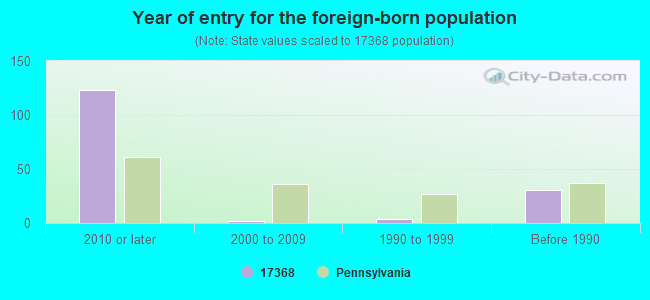
Year of entry for the foreign-born population
1232010 or later
22000 to 2009
41990 to 1999
31Before 1990
Facilities with environmental interests located in this zip code:
BARNEYS AUTO BODY & DETAIL (140 NEW BRIDGEVILLE ROAD in WRIGHTSVILLE, PA)
(Resource Conservation and Recovery Act (tracking hazardous waste)) Organizations: KEITH BARNHART (CONTACT/OWNER)
AMSPACHERS COLLISION REPAIR (RD 1 BOX 518 in WRIGHTSVILLE, PA)
Conditionally Exempt Small Quantity Generators, less than 100 kg/month of hazardous waste (Resource Conservation and Recovery Act (tracking hazardous waste)) - notification Organizations: MICHAEL L AMSPACHER (CONTACT/OWNER)
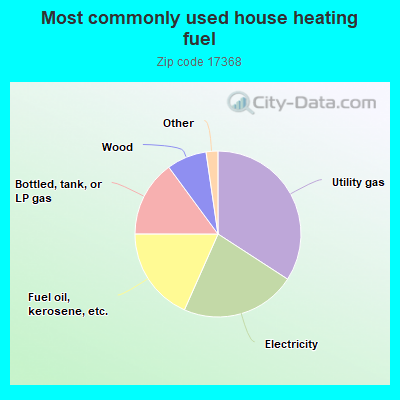
34.2%Utility gas
22.5%Electricity
18.4%Fuel oil, kerosene, etc.
14.9%Bottled, tank, or LP gas
7.8%Wood
0.9%Coal or coke
0.9%Other fuel
Population in 1990: 7,677.
Place of birth for U.S.-born residents:
This state: 5,374
Northeast: 410
Midwest: 25
South: 328
West: 124
66% of the 17368 zip code residents lived in the same house 5 years ago. Out of people who lived in different houses, 64% lived in this county. Out of people who lived in different counties, 50% lived in Pennsylvania.
96% of the 17368 zip code residents lived in the same house 1 year ago. Out of people who lived in different houses, 60% moved from this county. Out of people who lived in different houses, 37% moved from different county within same state. Out of people who lived in different houses, 9% moved from different state.
Private vs. public school enrollment:
Students in private schools in grades 1 to 8 (elementary and middle school): 11
Here:
2.0%
Pennsylvania:
15.7%
Students in private schools in grades 9 to 12 (high school): 9
Here:
2.8%
Pennsylvania:
13.4%
Students in private undergraduate colleges: 14
Here:
11.6%
Pennsylvania:
39.8%
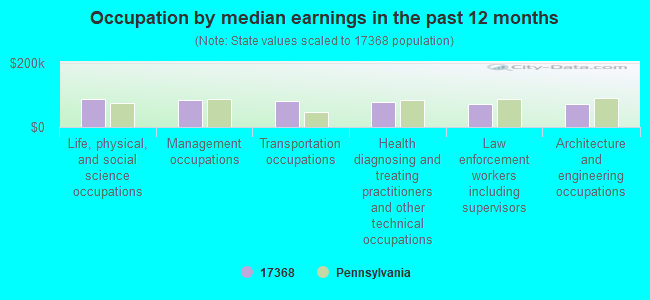
Occupation by median earnings in the past 12 months ($)
85,899Life, physical, and social science occupations
82,470Management occupations
80,844Transportation occupations
78,183Health diagnosing and treating practitioners and other technical occupations
71,229Law enforcement workers including supervisors
70,810Architecture and engineering occupations
Companies with federal contracts located in this zip code (WRIGHTSVILLE, PA):
MEMCO, INC (806 GRAND MANOR DR; small business) 500 employees, $0 revenue. Veteran Owned Business: $1,199,153 in 55 contractsfrom 2000 to 2006
Contracts for Liquid and Gas Flow, Liquid Level, and Mechanical Motion Measuring Instruments, Guns, 75 mm through 125 mm, Miscellaneous Communication Equipment, Aircraft Landing Equipment, and moreby Defense Logistics Agency Signed by year:2000: $122,973; 2001: $155,103; 2002: $231,412; 2003: $0; 2004: $157,648; 2005: $301,855; 2006: $230,162.
Biggest contracts:
$97,632 with Defense Logistics Agency for Liquid and Gas Flow, Liquid Level, and Mechanical Motion Measuring Instruments. Signed on 2001-05-19. Completion date: 2001-08-16.
$84,692 with Defense Logistics Agency for Guns, 75 mm through 125 mm. Signed on 2006-03-22. Completion date: 2006-07-20.
$78,920 with Defense Logistics Agency for Miscellaneous Communication Equipment. Signed on 2002-05-03. Completion date: 2003-04-28.
$77,882 with Defense Logistics Agency for Aircraft Landing Equipment. Signed on 2002-06-05. Completion date: 2002-10-03.
FRONT LINE MILITARY VEHICLES (1 SURPLUS DR; small business) : $199,814 in 20 contractsfrom 2003 to 2006
Contracts for Motors, Electrical, Converters, Electrical, Nonrotating, Bearings, Plain, Unmounted, Packing and Gasket Materials, and moreby Navy, Defense Logistics Agency, Army Signed by year:2000: $0; 2001: $0; 2002: $0; 2003: $3,600; 2004: $95,200; 2005: $61,757; 2006: $39,257.
Biggest contracts:
$85,050 with Navy for Motors, Electrical. Taking place in FL. Signed on 2004-03-23. Completion date: 2004-06-21.
$17,150 with Defense Logistics Agency for Converters, Electrical, Nonrotating. Signed on 2006-01-09. Completion date: 2006-02-03.
$12,640 with Defense Logistics Agency for Bearings, Plain, Unmounted. Signed on 2005-09-22. Completion date: 2005-10-30.
$12,500 with Defense Logistics Agency for Packing and Gasket Materials. Signed on 2005-09-13. Completion date: 2005-10-09.
ELECTRO-PLATERS OF YORK, INC (209 E WILLOW ST; small business) : $16,742 in 5 contractsfrom 2003 to 2004
Contracts for Maintenance, Repair and Rebuilding of Equipment -- Weapons, Maintenance, Repair and Rebuilding of Equipment -- Vehicular Equipment Components by Army Signed by year:2000: $0; 2001: $0; 2002: $0; 2003: $11,250; 2004: $5,492; 2005: $0; 2006: $0.
Biggest contracts:
$11,250 with Army for Maintenance, Repair and Rebuilding of Equipment -- Weapons. Signed on 2003-12-04. Completion date: 2003-12-13.
$2,079 with Army for Maintenance, Repair and Rebuilding of Equipment -- Vehicular Equipment Components. Signed on 2004-09-28. Completion date: 2004-06-25.
$1,668 with Army for Maintenance, Repair and Rebuilding of Equipment -- Weapons. Signed on 2004-08-02. Completion date: 2004-05-28.
$962, same as above.Signed on 2004-08-12. Completion date: 2004-08-02.
HOAK'S FOUR WHEEL DRIVE CENTER (815 HELLAM ST; small business)
$7,791 with Army for Vehicular Cab, Body, and Frame Structural Components. Signed on 2003-02-05. Completion date: 2003-02-14.
STEWART WELDING & FABRICATING, (1033 WATER ST; small business)
$438 with Army for Valves, Nonpowered. Signed on 2004-08-23. Completion date: 2004-10-08.
Top industries in this zip code by the number of employees in 2005:
Administrative and Support and Waste Management and Remediation Services: Landscaping Services (20-49 employees: 1 establishment, 5-9 employees: 1 establishment, 1-4 employees: 1 establishment)
2003 - 2018 National Fire Incident Reporting System (NFIRS) incidents
According to the data from the years 2003 - 2018 the average number of fire incidents per year is 48. The highest number of reported fires - 95 took place in 2017, and the least - 13 in 2012. The data has a rising trend.
When looking into fire subcategories, the most incidents belonged to: Structure Fires (64.3%), and Outside Fires (19.7%).
Fire incident types reported to NFIRS in Zip Code 17368


 Nearest zip codes: 17317, 17582, 17366, 17512, 17356, 17547.


 According to the data from the years 2003 - 2018 the average number of fire incidents per year is 48. The highest number of reported fires - 95 took place in 2017, and the least - 13 in 2012. The data has a rising trend.
 When looking into fire subcategories, the most incidents belonged to: Structure Fires (64.3%), and Outside Fires (19.7%).