Estimated zip code population in 2022: 18,020 Zip code population in 2010: 17,836 Zip code population in 2000: 17,333
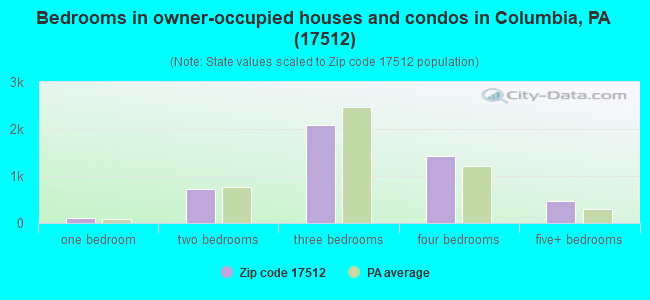
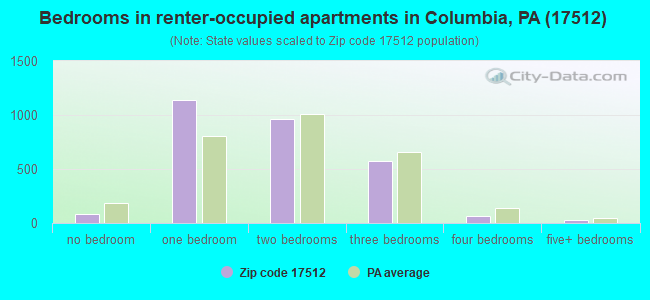
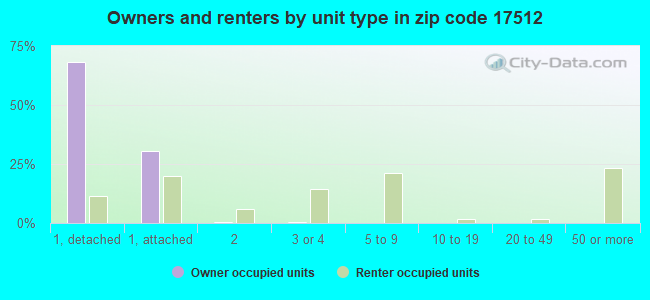
Houses and condos: 8,053 Renter-occupied apartments: 2,843
% of renters here:
37%
State:
31%
March 2022 cost of living index in zip code 17512: 95.1 (less than average, U.S. average is 100)
Land area: 16.3 sq. mi. Water area: 4.9 sq. mi.
Population density: 1,107 people per square mile
(low).
OSM Map
General Map
Google Map
MSN Map
OSM Map
General Map
Google Map
MSN Map
OSM Map
General Map
Google Map
MSN Map
OSM Map
General Map
Google Map
MSN Map
Please wait while loading the map...
Real estate property taxes paid for housing units in 2022:
This zip code:
1.6% ($3,533)
Pennsylvania:
1.3% ($3,094)
Median real estate property taxes paid for housing units with mortgages in 2022: $3,545 (1.5%) Median real estate property taxes paid for housing units with no mortgage in 2022: $3,519 (1.7%)
Averages for the 2020 tax year for zip code 17512, filed in 2021:
Average Adjusted Gross Income (AGI) in 2020: $53,701 (Individual Income Tax Returns)
Here:
$53,701
State:
$75,707
Salary/wage: $46,255 (reported on 83.1% of returns)
Here:
$46,255
State:
$62,806
(% of AGI for various income ranges: 1006.1% for AGIs below $25k, 3359.3% for AGIs $25k-50k, 6006.7% for AGIs $50k-75k, 8573.1% for AGIs $75k-100k, 16416.9% for AGIs $100k-200k, 62921.7% for AGIs over 200k)
Taxable interest for individuals: $1,045 (reported on 22.0% of returns)
This zip code:
$1,045
Pennsylvania:
$1,633
(% of AGI for various income ranges: 14.7% for AGIs below $25k, 11.1% for AGIs $25k-50k, 20.7% for AGIs $50k-75k, 29.8% for AGIs $75k-100k, 80.2% for AGIs $100k-200k, 1040.0% for AGIs over 200k)
Ordinary dividends: $3,017 (reported on 15.0% of returns)
Here:
$3,017
State:
$7,382
(% of AGI for various income ranges: 19.4% for AGIs below $25k, 19.0% for AGIs $25k-50k, 42.4% for AGIs $50k-75k, 83.3% for AGIs $75k-100k, 180.5% for AGIs $100k-200k, 2043.3% for AGIs over 200k)
Net capital gain/loss in AGI: +$8,612 (reported on 12.2% of returns)
Here:
+$8,612
State:
+$23,522
(% of AGI for various income ranges: 7.1% for AGIs below $25k, 24.9% for AGIs $25k-50k, 61.5% for AGIs $50k-75k, 106.2% for AGIs $75k-100k, 420.6% for AGIs $100k-200k, 8393.3% for AGIs over 200k)
Profit/loss from business: +$14,534 (reported on 9.4% of returns)
Here:
+$14,534
State:
+$16,274
(% of AGI for various income ranges: 51.6% for AGIs below $25k, 91.9% for AGIs $25k-50k, 204.2% for AGIs $50k-75k, 269.0% for AGIs $75k-100k, 462.4% for AGIs $100k-200k, 4335.0% for AGIs over 200k)
Taxable individual retirement arrangement distribution: $15,235 (reported on 10.3% of returns)
17512:
$15,235
Pennsylvania:
$18,583
(% of AGI for various income ranges: 75.8% for AGIs below $25k, 74.6% for AGIs $25k-50k, 196.6% for AGIs $50k-75k, 374.0% for AGIs $75k-100k, 688.4% for AGIs $100k-200k, 4115.0% for AGIs over 200k)
Self-employed (Keogh) retirement plans: $19,950 (reported on 0.2% of returns)
17512:
$19,950
Pennsylvania:
$25,407
(% of AGI for various income ranges: 68.8% for AGIs $75k-100k)
Total itemized deductions: $32,003 (reported on 4.2% of returns)
Here:
$32,003
State:
$34,850
(% of AGI for various income ranges: 50.8% for AGIs below $25k, 51.8% for AGIs $25k-50k, 168.0% for AGIs $50k-75k, 305.3% for AGIs $75k-100k, 610.8% for AGIs $100k-200k, 4600.0% for AGIs over 200k)
Charity contributions: $9,614 (reported on 3.2% of returns)
Here:
$9,614
State:
$12,392
(% of AGI for various income ranges: 1.9% for AGIs below $25k, 6.9% for AGIs $25k-50k, 18.5% for AGIs $50k-75k, 36.2% for AGIs $75k-100k, 142.6% for AGIs $100k-200k, 2156.7% for AGIs over 200k)
Taxes paid: $7,136 (reported on 4.2% of returns)
17512:
$7,136
State:
$8,200
(% of AGI for various income ranges: 5.4% for AGIs below $25k, 10.1% for AGIs $25k-50k, 45.8% for AGIs $50k-75k, 74.7% for AGIs $75k-100k, 149.4% for AGIs $100k-200k, 960.0% for AGIs over 200k)
Earned income credit: $2,319 (reported on 16.8% of returns)
Here:
$2,319
State:
$2,100
(% of AGI for various income ranges: 88.5% for AGIs below $25k, 67.0% for AGIs $25k-50k)
Percentage of individuals using paid preparers for their 2020 taxes: 94.4%
Here:
94%
State:
92%
(% for various income ranges: 93.3% for AGIs below $25k, 94.4% for AGIs $25k-50k, 95.7% for AGIs $50k-75k, 94.9% for AGIs $75k-100k, 95.0% for AGIs $100k-200k, 100.0% for AGIs over 200k)
Averages for the 2012 tax year for zip code 17512, filed in 2013:
Average Adjusted Gross Income (AGI) in 2012: $43,192 (Individual Income Tax Returns)
Here:
$43,192
State:
$61,346
Salary/wage: $39,111 (reported on 86.0% of returns)
Here:
$39,111
State:
$51,902
(% of AGI for various income ranges: 73.7% for AGIs below $25k, 82.7% for AGIs $25k-50k, 80.8% for AGIs $50k-75k, 80.0% for AGIs $75k-100k, 78.1% for AGIs $100k-200k, 58.3% for AGIs over 200k)
Taxable interest for individuals: $1,162 (reported on 27.1% of returns)
This zip code:
$1,162
Pennsylvania:
$1,588
(% of AGI for various income ranges: 1.2% for AGIs below $25k, 0.6% for AGIs $25k-50k, 0.4% for AGIs $50k-75k, 0.6% for AGIs $75k-100k, 0.8% for AGIs $100k-200k, 1.3% for AGIs over 200k)
Ordinary dividends: $2,303 (reported on 17.5% of returns)
Here:
$2,303
State:
$5,827
(% of AGI for various income ranges: 1.2% for AGIs below $25k, 0.6% for AGIs $25k-50k, 0.7% for AGIs $50k-75k, 1.1% for AGIs $75k-100k, 1.1% for AGIs $100k-200k, 1.4% for AGIs over 200k)
Net capital gain/loss in AGI: +$3,562 (reported on 10.5% of returns)
Here:
+$3,562
State:
+$14,495
(% of AGI for various income ranges: 0.1% for AGIs $25k-50k, 0.4% for AGIs $50k-75k, 0.2% for AGIs $75k-100k, 1.7% for AGIs $100k-200k, 4.9% for AGIs over 200k)
Profit/loss from business: +$12,043 (reported on 9.5% of returns)
Here:
+$12,043
State:
+$16,268
(% of AGI for various income ranges: 3.5% for AGIs below $25k, 1.9% for AGIs $25k-50k, 1.6% for AGIs $50k-75k, 3.0% for AGIs $75k-100k, 3.3% for AGIs $100k-200k, 3.4% for AGIs over 200k)
Taxable individual retirement arrangement distribution: $9,740 (reported on 11.3% of returns)
17512:
$9,740
Pennsylvania:
$14,550
(% of AGI for various income ranges: 4.0% for AGIs below $25k, 2.3% for AGIs $25k-50k, 2.0% for AGIs $50k-75k, 2.5% for AGIs $75k-100k, 3.5% for AGIs $100k-200k)
Self-employment retirement plans: $8,500 (reported on 0.4% of returns)
17512:
$8,500
Pennsylvania:
$20,922
Total itemized deductions: $17,671 (21% of AGI, reported on 25.6% of returns)
Here:
$17,671
State:
$23,538
Here:
21.3% of AGI
State:
18.4% of AGI
(% of AGI for various income ranges: 6.9% for AGIs below $25k, 8.0% for AGIs $25k-50k, 10.3% for AGIs $50k-75k, 11.8% for AGIs $75k-100k, 13.7% for AGIs $100k-200k, 11.3% for AGIs over 200k)
Charity contributions: $3,073 (reported on 18.3% of returns)
Here:
$3,073
State:
$4,025
(% of AGI for various income ranges: 0.5% for AGIs below $25k, 0.6% for AGIs $25k-50k, 1.0% for AGIs $50k-75k, 1.4% for AGIs $75k-100k, 2.1% for AGIs $100k-200k, 2.6% for AGIs over 200k)
Taxes paid: $6,993 (reported on 25.2% of returns)
17512:
$6,993
State:
$9,982
(% of AGI for various income ranges: 1.5% for AGIs below $25k, 2.6% for AGIs $25k-50k, 3.9% for AGIs $50k-75k, 4.9% for AGIs $75k-100k, 6.0% for AGIs $100k-200k, 5.5% for AGIs over 200k)
Earned income credit: $2,163 (reported on 20.4% of returns)
Here:
$2,163
State:
$2,106
(% of AGI for various income ranges: 6.7% for AGIs below $25k, 1.1% for AGIs $25k-50k)
Percentage of individuals using paid preparers for their 2012 taxes: 52.2%
Here:
52%
State:
53%
(% for various income ranges: 46.0% for AGIs below $25k, 53.7% for AGIs $25k-50k, 56.4% for AGIs $50k-75k, 61.1% for AGIs $75k-100k, 60.9% for AGIs $100k-200k, 77.8% for AGIs over 200k)
Averages for the 2004 tax year for zip code 17512, filed in 2005:
Average Adjusted Gross Income (AGI) in 2004: $37,913 (Individual Income Tax Returns)
Here:
$37,913
State:
$48,049
Salary/wage: $34,832 (reported on 88.1% of returns)
Here:
$34,832
State:
$42,646
(% of AGI for various income ranges: 83.0% for AGIs below $10k, 78.9% for AGIs $10k-25k, 86.0% for AGIs $25k-50k, 85.9% for AGIs $50k-75k, 85.4% for AGIs $75k-100k, 64.7% for AGIs over 100k)
Taxable interest for individuals: $1,080 (reported on 38.5% of returns)
This zip code:
$1,080
Pennsylvania:
$1,657
(% of AGI for various income ranges: 3.8% for AGIs below $10k, 2.0% for AGIs $10k-25k, 1.0% for AGIs $25k-50k, 0.8% for AGIs $50k-75k, 0.7% for AGIs $75k-100k, 1.0% for AGIs over 100k)
Taxable dividends: $1,911 (reported on 20.5% of returns)
Here:
$1,911
State:
$3,566
(% of AGI for various income ranges: 2.5% for AGIs below $10k, 1.0% for AGIs $10k-25k, 0.6% for AGIs $25k-50k, 0.6% for AGIs $50k-75k, 0.7% for AGIs $75k-100k, 2.1% for AGIs over 100k)
Net capital gain/loss: +$3,832 (reported on 13.4% of returns)
Here:
+$3,832
State:
+$9,716
(% of AGI for various income ranges: -0.8% for AGIs below $10k, 0.4% for AGIs $10k-25k, 0.2% for AGIs $25k-50k, 0.5% for AGIs $50k-75k, 1.7% for AGIs $75k-100k, 4.6% for AGIs over 100k)
Profit/loss from business: +$12,303 (reported on 9.4% of returns)
Here:
+$12,303
State:
+$14,267
(% of AGI for various income ranges: 2.5% for AGIs below $10k, 3.3% for AGIs $10k-25k, 1.7% for AGIs $25k-50k, 2.6% for AGIs $50k-75k, 3.6% for AGIs $75k-100k, 5.0% for AGIs over 100k)
IRA payment deduction: $2,551 (reported on 2.1% of returns)
17512:
$2,551
Pennsylvania:
$2,903
(% of AGI for various income ranges: 0.1% for AGIs $10k-25k, 0.2% for AGIs $25k-50k, 0.1% for AGIs $50k-75k, 0.1% for AGIs $75k-100k, 0.1% for AGIs over 100k)
Self-employed pension: $9,179 (reported on 0.5% of returns)
Here:
$9,179
Pennsylvania:
$14,674
Total itemized deductions: $14,678 (21% of AGI, reported on 27.6% of returns)
Here:
$14,678
State:
$18,804
Here:
20.9% of AGI
State:
19.5% of AGI
(% of AGI for various income ranges: 8.4% for AGIs below $10k, 5.6% for AGIs $10k-25k, 8.6% for AGIs $25k-50k, 11.9% for AGIs $50k-75k, 13.7% for AGIs $75k-100k, 12.6% for AGIs over 100k)
Charity contributions deductions: $2,514 (3% of AGI, reported on 22.3% of returns)
Here:
$2,514
State:
$3,337
Here:
3.3% of AGI
State:
3.3% of AGI
(% of AGI for various income ranges: 0.5% for AGIs below $10k, 0.5% for AGIs $10k-25k, 0.9% for AGIs $25k-50k, 1.4% for AGIs $50k-75k, 1.9% for AGIs $75k-100k, 2.7% for AGIs over 100k)
Total tax: $4,995 (reported on 73.8% of returns)
17512:
$4,995
State:
$8,008
(% of AGI for various income ranges: 1.6% for AGIs below $10k, 4.1% for AGIs $10k-25k, 7.3% for AGIs $25k-50k, 9.1% for AGIs $50k-75k, 10.6% for AGIs $75k-100k, 17.6% for AGIs over 100k)
Earned income credit: $1,642 (reported on 15.4% of returns)
Here:
$1,642
State:
$1,643
Percentage of individuals using paid preparers for their 2004 taxes: 58.4%
Here:
58%
State:
56%
(% for various income ranges: 50.3% for AGIs below $10k, 58.9% for AGIs $10k-25k, 58.5% for AGIs $25k-50k, 63.6% for AGIs $50k-75k, 62.0% for AGIs $75k-100k, 68.7% for AGIs over 100k)
Likely homosexual households (counted as self-reported same-sex unmarried-partner households)
Lesbian couples: 0.3% of all households
Gay men: 0.0% of all households
Household received Food Stamps/SNAP in the past 12 months: 1,415 Household did not receive Food Stamps/SNAP in the past 12 months: 6,261
Women who had a birth in the past 12 months: 128 (61 now married, 61 unmarried) Women who did not have a birth in the past 12 months: 3,551 (1,626 now married, 1,917 unmarried)
Housing units in zip code 17512 with a mortgage: 3,167 (457 second mortgage, 28 home equity loan, 383 both second mortgage and home equity loan) Houses without a mortgage: 519
Median monthly owner costs for units with a mortgage: $1,388 Median monthly owner costs for units without a mortgage: $636
Residents with income below the poverty level in 2022:
This zip code:
11.5%
Whole state:
11.8%
Residents with income below 50% of the poverty level in 2022:
This zip code:
6.4%
Whole state:
6.1%
Median number of rooms in houses and condos:
Here:
7.0
State:
6.8
Median number of rooms in apartments:
Here:
4.1
State:
4.3
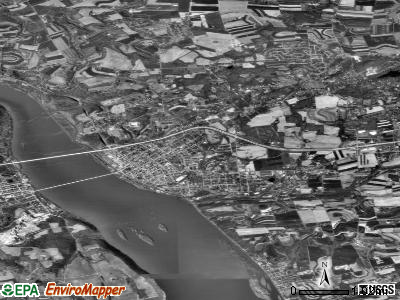
Notable locations in this zip code not listed on our city pages
Notable locations in zip code 17512: Cordelia Station (A), Columbia 1 Fire Department Station 8 - 1 / Columbia Quick Response Service 8 (B), Saint Anne Home (C), Columbia Consolidated Fire Department Station 8 - 7 (D), Susquehanna Fire and Rescue Company 4 Station 8 - 4 (E). Display/hide their locations on the map
Churches in zip code 17512 include: Manor Church (A), Cookman Church (B), Concordia Church (C), Chestnut Hill Church (D), First English Church (E). Display/hide their locations on the map
Streams, rivers, and creeks: Kreutz Creek (A), Strickler Run (B), Stamans Run (C), Donegal Creek (D), Shawnee Run (E), Chiques Creek (F). Display/hide their locations on the map
2,228 married couples with children.
758 single-parent households (122 men, 636 women).
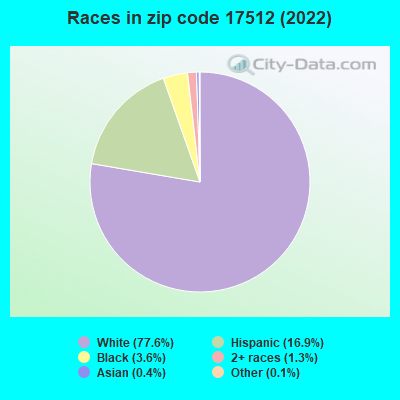
87.6% of residents of 17512 zip code speak English at home.
10.3% of residents speak Spanish at home (62% very well, 15% well, 20% not well, 2% not at all).
1.3% of residents speak other Indo-European language at home (97% very well, 3% well).
0.2% of residents speak Asian or Pacific Island language at home (100% very well).
1.1% of residents speak other language at home (55% very well, 27% well, 18% not well).
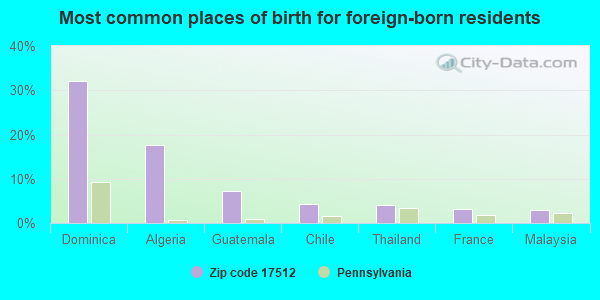
Foreign born population: 741 (4.1%) (54.8% of them are naturalized citizens)
This zip code:
4.1%
Whole state:
7.5%
32%Dominica
18%Algeria
7%Guatemala
4%Chile
4%Thailand
3%France
3%Malaysia
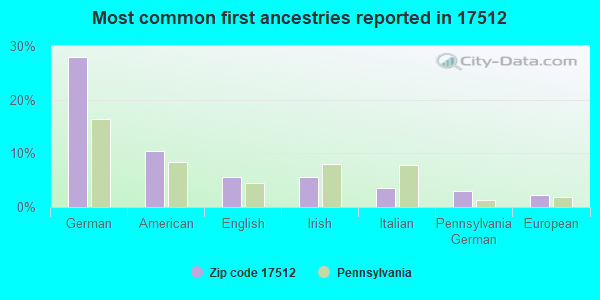
28%German
10%American
6%English
6%Irish
4%Italian
3%Pennsylvania German
2%European
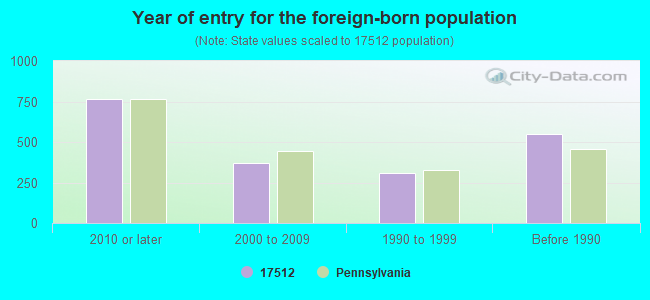
Year of entry for the foreign-born population
7672010 or later
3712000 to 2009
3081990 to 1999
547Before 1990
Facilities with environmental interests located in this zip code:
ANVIL WALTER IND IRON FOUNDRY COLUMBIA (1411 LANCASTER AVENUE in COLUMBIA, PA)
AIR MAJOR (AIRS/AFS) SUPERFUND (Superfund database) (Integrated Compliance Information System) - ICIS-03-1986-0057, FORMAL ENFORCEMENT ACTION COMPLIANCE ACTIVITY (Tracking inspections of insecticide, fungicide, and rodenticide, and toxic substances) CRITERIA AND HAZARDOUS AIR POLLUTANT INVENTORY (Inventory of air pollution sources) STATE MASTER (Pennsylvania database) - AFS-02-0510023-1, AIR PROGRAM, RCRIS-PAD096266499, HAZARDOUS WASTE PROGRAM National Pollutant Discharge Elimination System NON-MAJOR (Tracking pollutant discharge elimination systems) - permit HAZARDOUS WASTE BIENNIAL REPORTER (Resource Conservation and Recovery Act (tracking hazardous waste)) Large Quantity Generators, more that 1000 kg of hazardous waste/month (Resource Conservation and Recovery Act (tracking hazardous waste)) - notification TRI REPORTER (Tracking of toxic chemicals releasing facilities) Business SIC classification: GRAY AND DUCTILE IRON FOUNDRIES; MALLEABLE IRON FOUNDRIES; VALVES AND PIPE FITTINGS; AIRCRAFT PARTS AND AUXILIARY EQUIPMENT Business NAICS classification: IRON FOUNDRIES. Organizations: ANVIL INTERNATIONAL INC (CONTACT/OPERATOR)
, ANVIL INTERNATIONAL, INC. (CONTACT/OPERATOR)
, GRINNEL CORPORATION (CONTACT/OPERATOR)
, MUELLER GROUP INC (CONTACT/OWNER)
, WALTER INDUSTRIES, INC. (CONTACT/OWNER)
, ANVIL INTERNATIONAL, INC. (CONTACT/OWNER)
, GRINNEL CORPORATION (CONTACT/OWNER)
Alternative names: ANVIL INTERNATIONAL INC, ANVIL INTL SUPPLY SALES GRINNELL IRON FOUNDRY COLUMBIA, GRINNELL CORPORATION, GRINNELL CORP ITT, GRINNELL CORP.- MFG., ITT GRINNELL CORP HSCA, WALTER INDUSTRIES INC/ANVIL IN
AIKEN RES (2522 IRONVILLE PIKE in COLUMBIA, PA)
STATE MASTER (Pennsylvania database) - PCS-PAG043516, National Pollutant Discharge Elimination System Permit National Pollutant Discharge Elimination System NON-MAJOR (Tracking pollutant discharge elimination systems) - permit Business SIC classification: OPERATORS OF DWELLINGS OTHER THAN APARTMENT BUILDINGS Alternative names: AIKEN RESIDENCE, GARDNER, MATTHEW, JOSEPH AND ERIN AIKEN, MATTHEW GARDNER
ATLANTIC SERVICE STATION (1414 LANCASTER AVE-TANKS in COLUMBIA, PA)
Conditionally Exempt Small Quantity Generators, less than 100 kg/month of hazardous waste (Resource Conservation and Recovery Act (tracking hazardous waste)) - notification Organizations: OPERNAME (CONTACT/OPERATOR)
, ATLANTIC REFINING & MARKETING (CONTACT/OWNER)
BETH GAINER (1050 DRAGER RD in COLUMBIA, PA)
National Pollutant Discharge Elimination System NON-MAJOR (Tracking pollutant discharge elimination systems) - permit Business SIC classification: SEWERAGE SYSTEMS Alternative names: BETH DORSEY, DORSEY, BETH, GAINER, BETH
Housing units lacking complete plumbing facilities: 1.3% Housing units lacking complete kitchen facilities: 2.1%
42.9%Utility gas
34.5%Electricity
11.4%Fuel oil, kerosene, etc.
8.4%Bottled, tank, or LP gas
1.0%Wood
0.9%No fuel used
0.7%Coal or coke
Population in 1990: 17,454.
Place of birth for U.S.-born residents:
This state: 13,489
Northeast: 966
Midwest: 452
South: 875
West: 201
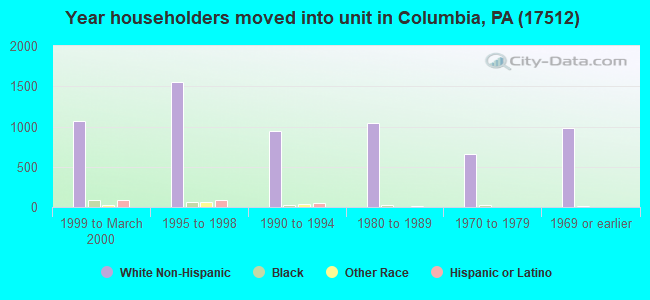
58% of the 17512 zip code residents lived in the same house 5 years ago. Out of people who lived in different houses, 84% lived in this county. Out of people who lived in different counties, 50% lived in Pennsylvania.
92% of the 17512 zip code residents lived in the same house 1 year ago. Out of people who lived in different houses, 69% moved from this county. Out of people who lived in different houses, 15% moved from different county within same state. Out of people who lived in different houses, 15% moved from different state.
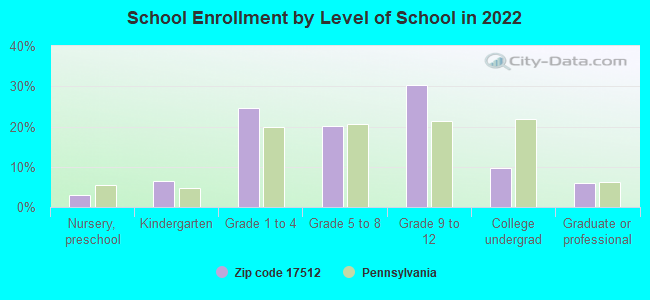
Private vs. public school enrollment:
Students in private schools in grades 1 to 8 (elementary and middle school): 417
Here:
28.5%
Pennsylvania:
15.7%
Students in private schools in grades 9 to 12 (high school): 77
Here:
7.9%
Pennsylvania:
13.4%
Students in private undergraduate colleges: 81
Here:
26.1%
Pennsylvania:
39.8%
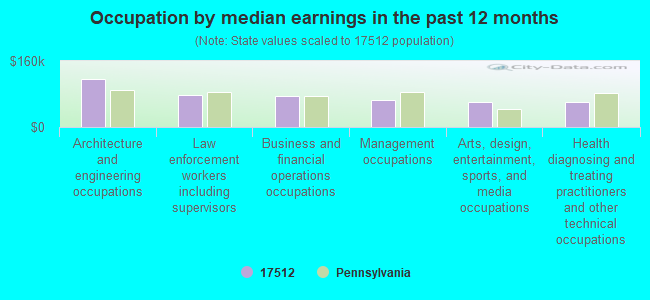
Occupation by median earnings in the past 12 months ($)
116,512Architecture and engineering occupations
77,430Law enforcement workers including supervisors
74,403Business and financial operations occupations
66,217Management occupations
61,749Arts, design, entertainment, sports, and media occupations
60,225Health diagnosing and treating practitioners and other technical occupations
Companies with federal contracts located in this zip code (COLUMBIA, PA):
COLONIAL METALS COMPANY (217 LINDEN STREET; small business) : $850,215 in 30 contractsfrom 2000 to 2006
Contracts for Bars and Rods, Nonferrous Base Metal, Bars and Rods, Nonferrous Base Metal Refinery and Intermediate Forms, Installation of Equipment -- Metal Bars, Sheets, and Shapes, and moreby Navy, Army Signed by year:2000: $144,833; 2001: $100,725; 2002: $172,994; 2003: $218,973; 2004: $48,570; 2005: $137,770; 2006: $26,350.
Biggest contracts:
$157,500 with Navy for Bars and Rods, Nonferrous Base Metal. Signed on 2003-06-12. Completion date: 2004-06-11.
$57,343 with Navy for Bars and Rods. Signed on 2001-05-03. Completion date: 2001-06-03.
$51,858, same as above.Signed on 2000-02-28. Completion date: 2000-03-28.
$50,967, same as above.Signed on 2000-08-30. Completion date: 2000-09-30.
WILMAC CORPORATION (745 CHIQUES HILL RD; small business) : $120,000 in 10 contractsfrom 1999 to 2002
Contracts for Nursing Home Care Contracts by Department of Veterans Affairs Signed by year:2000: $48,000; 2001: $50,000; 2002: $11,000; 2003: $0; 2004: $0; 2005: $0; 2006: $0.
Biggest contracts:
$16,000 with Department of Veterans Affairs for Nursing Home Care Contracts. Signed on 2001-03-15. Completion date: 2002-02-15.
$15,000, same as above.Signed on 2000-12-15. Completion date: 2002-02-15.
$12,000, same as above.Signed on 2001-12-15. Completion date: 2002-02-15.
$11,000, same as above.Signed on 2002-03-15. Completion date: 2003-02-15.
LANCASTER COMPOSITE, INC (1000 HOUSTON ST; small business)
$56,702 with Navy for Electron Tubes and Associated Hardware. Signed on 2004-02-19. Completion date: 2004-02-15.
PEERLESS HARDWARE MFG CO INC (210 CHESTNUT ST; small business)
$4,930 with Defense Logistics Agency for Hardware, Commercial. Signed on 2005-12-12. Completion date: 2006-04-11.
EX-ACTMARKETING INC (121 WALNUT STREET; small business) : -$88 in 2 contractsin 2002
$0 with Army for Athletic and Sporting Equipment. Signed on 2002-10-09. Completion date: 2002-09-09.
-$88, same as above.Signed on 2002-10-09. Completion date: 2002-09-09.
Top industries in this zip code by the number of employees in 2005:
Health Care and Social Assistance: Nursing Care Facilities (100-249 employees: 2 establishments)
2002 - 2018 National Fire Incident Reporting System (NFIRS) incidents
According to the data from the years 2002 - 2018 the average number of fire incidents per year is 167. The highest number of reported fire incidents - 289 took place in 2006, and the least - 82 in 2018. The data has a decreasing trend.
When looking into fire subcategories, the most reports belonged to: Structure Fires (68.7%), and Outside Fires (16.2%).
Fire incident types reported to NFIRS in Zip Code 17512

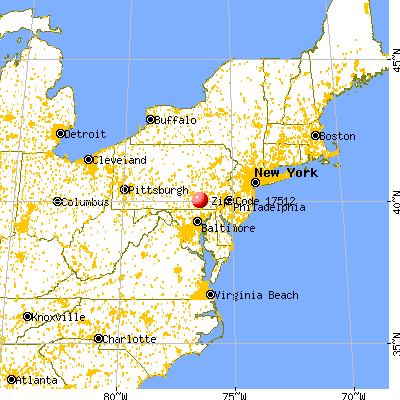


 Nearest zip codes: 17582, 17554, 17368, 17552, 17317, 17538.


 According to the data from the years 2002 - 2018 the average number of fire incidents per year is 167. The highest number of reported fire incidents - 289 took place in 2006, and the least - 82 in 2018. The data has a decreasing trend.
 When looking into fire subcategories, the most reports belonged to: Structure Fires (68.7%), and Outside Fires (16.2%).