Estimated zip code population in 2022: 19,875 Zip code population in 2010: 17,831 Zip code population in 2000: 14,224
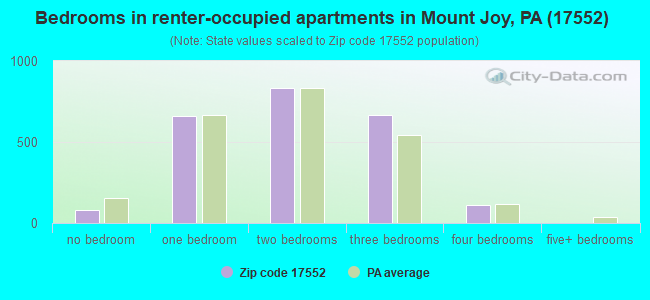
Houses and condos: 8,727 Renter-occupied apartments: 2,365
% of renters here:
27%
State:
31%
March 2022 cost of living index in zip code 17552: 95.4 (near average, U.S. average is 100)
Land area: 32.5 sq. mi. Water area: 0.2 sq. mi.
Population density: 612 people per square mile
(low).
OSM Map
General Map
Google Map
MSN Map
OSM Map
General Map
Google Map
MSN Map
OSM Map
General Map
Google Map
MSN Map
OSM Map
General Map
Google Map
MSN Map
Please wait while loading the map...
Real estate property taxes paid for housing units in 2022:
This zip code:
1.4% ($3,987)
Pennsylvania:
1.3% ($3,094)
Median real estate property taxes paid for housing units with mortgages in 2022: $4,091 (1.5%) Median real estate property taxes paid for housing units with no mortgage in 2022: $3,794 (1.3%)
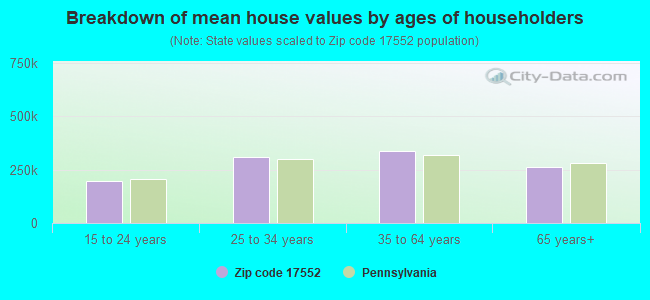
Estimated median house/condo value in 2022: $282,184
17552:
$282,184
Pennsylvania:
$245,500
According to our research of Pennsylvania and other state lists, there were 16 registered sex offenders living in 17552 zip code as of April 26, 2024. The ratio of all residents to sex offenders in zip code 17552 is 1,272 to 1. The ratio of registered sex offenders to all residents in this zip code is lower than the state average.
Median resident age:
This zip code:
43.6 years
Pennsylvania median age:
40.9 years
Average household size:
This zip code:
2.3 people
Pennsylvania:
2.4 people
Averages for the 2020 tax year for zip code 17552, filed in 2021:
Average Adjusted Gross Income (AGI) in 2020: $69,797 (Individual Income Tax Returns)
Here:
$69,797
State:
$75,707
Salary/wage: $58,587 (reported on 81.5% of returns)
Here:
$58,587
State:
$62,806
(% of AGI for various income ranges: 1020.9% for AGIs below $25k, 3510.3% for AGIs $25k-50k, 6021.7% for AGIs $50k-75k, 9315.1% for AGIs $75k-100k, 16084.1% for AGIs $100k-200k, 56288.2% for AGIs over 200k)
Taxable interest for individuals: $1,601 (reported on 33.9% of returns)
This zip code:
$1,601
Pennsylvania:
$1,633
(% of AGI for various income ranges: 26.0% for AGIs below $25k, 22.8% for AGIs $25k-50k, 39.6% for AGIs $50k-75k, 55.6% for AGIs $75k-100k, 134.2% for AGIs $100k-200k, 2015.5% for AGIs over 200k)
Ordinary dividends: $3,872 (reported on 24.7% of returns)
Here:
$3,872
State:
$7,382
(% of AGI for various income ranges: 38.9% for AGIs below $25k, 37.0% for AGIs $25k-50k, 65.9% for AGIs $50k-75k, 119.6% for AGIs $75k-100k, 267.4% for AGIs $100k-200k, 3231.8% for AGIs over 200k)
Net capital gain/loss in AGI: +$10,774 (reported on 20.6% of returns)
Here:
+$10,774
State:
+$23,522
(% of AGI for various income ranges: 16.2% for AGIs below $25k, 50.2% for AGIs $25k-50k, 80.7% for AGIs $50k-75k, 137.8% for AGIs $75k-100k, 458.1% for AGIs $100k-200k, 13327.3% for AGIs over 200k)
Profit/loss from business: +$15,594 (reported on 12.8% of returns)
Here:
+$15,594
State:
+$16,274
(% of AGI for various income ranges: 66.5% for AGIs below $25k, 155.0% for AGIs $25k-50k, 193.2% for AGIs $50k-75k, 324.9% for AGIs $75k-100k, 559.3% for AGIs $100k-200k, 4366.4% for AGIs over 200k)
Taxable individual retirement arrangement distribution: $17,619 (reported on 13.9% of returns)
17552:
$17,619
Pennsylvania:
$18,583
(% of AGI for various income ranges: 106.3% for AGIs below $25k, 155.8% for AGIs $25k-50k, 253.5% for AGIs $50k-75k, 422.9% for AGIs $75k-100k, 800.8% for AGIs $100k-200k, 3862.7% for AGIs over 200k)
Self-employed (Keogh) retirement plans: $21,950 (reported on 0.4% of returns)
17552:
$21,950
Pennsylvania:
$25,407
(% of AGI for various income ranges: 70.2% for AGIs $100k-200k)
Total itemized deductions: $32,108 (reported on 7.1% of returns)
Here:
$32,108
State:
$34,850
(% of AGI for various income ranges: 49.9% for AGIs below $25k, 88.4% for AGIs $25k-50k, 189.2% for AGIs $50k-75k, 378.4% for AGIs $75k-100k, 634.1% for AGIs $100k-200k, 7386.4% for AGIs over 200k)
Charity contributions: $14,510 (reported on 5.8% of returns)
Here:
$14,510
State:
$12,392
(% of AGI for various income ranges: 5.3% for AGIs below $25k, 15.2% for AGIs $25k-50k, 23.8% for AGIs $50k-75k, 72.7% for AGIs $75k-100k, 195.9% for AGIs $100k-200k, 4826.4% for AGIs over 200k)
Taxes paid: $7,796 (reported on 7.0% of returns)
17552:
$7,796
State:
$8,200
(% of AGI for various income ranges: 7.6% for AGIs below $25k, 17.8% for AGIs $25k-50k, 59.4% for AGIs $50k-75k, 116.0% for AGIs $75k-100k, 180.9% for AGIs $100k-200k, 1198.2% for AGIs over 200k)
Earned income credit: $1,915 (reported on 8.4% of returns)
Here:
$1,915
State:
$2,100
(% of AGI for various income ranges: 49.2% for AGIs below $25k, 40.2% for AGIs $25k-50k, 0.6% for AGIs $50k-75k)
Percentage of individuals using paid preparers for their 2020 taxes: 93.7%
Here:
94%
State:
92%
(% for various income ranges: 90.9% for AGIs below $25k, 94.9% for AGIs $25k-50k, 94.9% for AGIs $50k-75k, 94.0% for AGIs $75k-100k, 94.7% for AGIs $100k-200k, 94.4% for AGIs over 200k)
Averages for the 2012 tax year for zip code 17552, filed in 2013:
Average Adjusted Gross Income (AGI) in 2012: $55,946 (Individual Income Tax Returns)
Here:
$55,946
State:
$61,346
Salary/wage: $47,398 (reported on 85.5% of returns)
Here:
$47,398
State:
$51,902
(% of AGI for various income ranges: 71.8% for AGIs below $25k, 80.1% for AGIs $25k-50k, 78.2% for AGIs $50k-75k, 77.7% for AGIs $75k-100k, 75.3% for AGIs $100k-200k, 39.5% for AGIs over 200k)
Taxable interest for individuals: $1,166 (reported on 39.1% of returns)
This zip code:
$1,166
Pennsylvania:
$1,588
(% of AGI for various income ranges: 1.9% for AGIs below $25k, 0.6% for AGIs $25k-50k, 0.7% for AGIs $50k-75k, 0.6% for AGIs $75k-100k, 0.7% for AGIs $100k-200k, 1.1% for AGIs over 200k)
Ordinary dividends: $2,614 (reported on 23.9% of returns)
Here:
$2,614
State:
$5,827
(% of AGI for various income ranges: 1.6% for AGIs below $25k, 0.8% for AGIs $25k-50k, 0.8% for AGIs $50k-75k, 0.9% for AGIs $75k-100k, 1.3% for AGIs $100k-200k, 1.9% for AGIs over 200k)
Net capital gain/loss in AGI: +$5,700 (reported on 16.5% of returns)
Here:
+$5,700
State:
+$14,495
(% of AGI for various income ranges: 0.2% for AGIs $25k-50k, 0.5% for AGIs $50k-75k, 0.6% for AGIs $75k-100k, 1.4% for AGIs $100k-200k, 8.5% for AGIs over 200k)
Profit/loss from business: +$14,647 (reported on 12.0% of returns)
Here:
+$14,647
State:
+$16,268
(% of AGI for various income ranges: 5.4% for AGIs below $25k, 3.3% for AGIs $25k-50k, 2.6% for AGIs $50k-75k, 1.6% for AGIs $75k-100k, 2.9% for AGIs $100k-200k, 5.4% for AGIs over 200k)
Taxable individual retirement arrangement distribution: $12,435 (reported on 12.9% of returns)
17552:
$12,435
Pennsylvania:
$14,550
(% of AGI for various income ranges: 4.9% for AGIs below $25k, 2.9% for AGIs $25k-50k, 2.5% for AGIs $50k-75k, 3.2% for AGIs $75k-100k, 2.6% for AGIs $100k-200k, 2.4% for AGIs over 200k)
Self-employment retirement plans: $14,125 (reported on 0.4% of returns)
17552:
$14,125
Pennsylvania:
$20,922
Total itemized deductions: $19,889 (21% of AGI, reported on 37.4% of returns)
Here:
$19,889
State:
$23,538
Here:
21.4% of AGI
State:
18.4% of AGI
(% of AGI for various income ranges: 10.2% for AGIs below $25k, 10.5% for AGIs $25k-50k, 13.5% for AGIs $50k-75k, 14.7% for AGIs $75k-100k, 14.5% for AGIs $100k-200k, 13.5% for AGIs over 200k)
Charity contributions: $4,837 (reported on 29.9% of returns)
Here:
$4,837
State:
$4,025
(% of AGI for various income ranges: 1.0% for AGIs below $25k, 1.4% for AGIs $25k-50k, 1.9% for AGIs $50k-75k, 2.3% for AGIs $75k-100k, 2.8% for AGIs $100k-200k, 5.9% for AGIs over 200k)
Taxes paid: $7,345 (reported on 37.4% of returns)
17552:
$7,345
State:
$9,982
(% of AGI for various income ranges: 2.3% for AGIs below $25k, 3.4% for AGIs $25k-50k, 4.7% for AGIs $50k-75k, 5.5% for AGIs $75k-100k, 6.3% for AGIs $100k-200k, 4.8% for AGIs over 200k)
Earned income credit: $2,001 (reported on 10.5% of returns)
Here:
$2,001
State:
$2,106
(% of AGI for various income ranges: 3.6% for AGIs below $25k, 0.8% for AGIs $25k-50k)
Percentage of individuals using paid preparers for their 2012 taxes: 52.5%
Here:
52%
State:
53%
(% for various income ranges: 46.3% for AGIs below $25k, 51.2% for AGIs $25k-50k, 56.7% for AGIs $50k-75k, 54.9% for AGIs $75k-100k, 60.0% for AGIs $100k-200k, 76.5% for AGIs over 200k)
Averages for the 2004 tax year for zip code 17552, filed in 2005:
Average Adjusted Gross Income (AGI) in 2004: $44,488 (Individual Income Tax Returns)
Here:
$44,488
State:
$48,049
Salary/wage: $40,330 (reported on 87.6% of returns)
Here:
$40,330
State:
$42,646
(% of AGI for various income ranges: 97.8% for AGIs below $10k, 74.5% for AGIs $10k-25k, 83.4% for AGIs $25k-50k, 84.0% for AGIs $50k-75k, 86.1% for AGIs $75k-100k, 65.3% for AGIs over 100k)
Taxable interest for individuals: $1,344 (reported on 48.2% of returns)
This zip code:
$1,344
Pennsylvania:
$1,657
(% of AGI for various income ranges: 5.8% for AGIs below $10k, 3.1% for AGIs $10k-25k, 1.1% for AGIs $25k-50k, 0.9% for AGIs $50k-75k, 1.1% for AGIs $75k-100k, 1.8% for AGIs over 100k)
Taxable dividends: $1,920 (reported on 27.1% of returns)
Here:
$1,920
State:
$3,566
(% of AGI for various income ranges: 3.0% for AGIs below $10k, 1.5% for AGIs $10k-25k, 1.0% for AGIs $25k-50k, 0.8% for AGIs $50k-75k, 0.9% for AGIs $75k-100k, 1.7% for AGIs over 100k)
Net capital gain/loss: +$5,169 (reported on 18.9% of returns)
Here:
+$5,169
State:
+$9,716
(% of AGI for various income ranges: -1.4% for AGIs below $10k, 0.4% for AGIs $10k-25k, 0.5% for AGIs $25k-50k, 0.6% for AGIs $50k-75k, 0.9% for AGIs $75k-100k, 7.6% for AGIs over 100k)
Profit/loss from business: +$13,641 (reported on 12.9% of returns)
Here:
+$13,641
State:
+$14,267
(% of AGI for various income ranges: 5.1% for AGIs below $10k, 3.7% for AGIs $10k-25k, 3.6% for AGIs $25k-50k, 3.2% for AGIs $50k-75k, 3.1% for AGIs $75k-100k, 5.9% for AGIs over 100k)
Profit/loss from farming: +$8,587 (reported on 1.8% of returns)
Here:
+$8,587
State:
+$274
(% of AGI for various income ranges: -4.7% for AGIs below $10k, 0.3% for AGIs $10k-25k, 0.1% for AGIs $25k-50k, 0.4% for AGIs $50k-75k, 0.3% for AGIs $75k-100k, 0.9% for AGIs over 100k)
IRA payment deduction: $2,781 (reported on 2.7% of returns)
17552:
$2,781
Pennsylvania:
$2,903
(% of AGI for various income ranges: 0.2% for AGIs $10k-25k, 0.2% for AGIs $25k-50k, 0.2% for AGIs $50k-75k, 0.1% for AGIs $75k-100k, 0.1% for AGIs over 100k)
Self-employed pension: $11,189 (reported on 0.7% of returns)
Here:
$11,189
Pennsylvania:
$14,674
Total itemized deductions: $15,430 (22% of AGI, reported on 38.0% of returns)
Here:
$15,430
State:
$18,804
Here:
21.6% of AGI
State:
19.5% of AGI
(% of AGI for various income ranges: 14.1% for AGIs below $10k, 9.3% for AGIs $10k-25k, 11.8% for AGIs $25k-50k, 14.1% for AGIs $50k-75k, 14.3% for AGIs $75k-100k, 13.8% for AGIs over 100k)
Charity contributions deductions: $3,714 (5% of AGI, reported on 32.2% of returns)
Here:
$3,714
State:
$3,337
Here:
4.9% of AGI
State:
3.3% of AGI
(% of AGI for various income ranges: 1.0% for AGIs below $10k, 1.4% for AGIs $10k-25k, 1.7% for AGIs $25k-50k, 2.3% for AGIs $50k-75k, 2.5% for AGIs $75k-100k, 4.7% for AGIs over 100k)
Total tax: $5,759 (reported on 79.7% of returns)
17552:
$5,759
State:
$8,008
(% of AGI for various income ranges: 2.6% for AGIs below $10k, 4.5% for AGIs $10k-25k, 7.6% for AGIs $25k-50k, 8.8% for AGIs $50k-75k, 10.5% for AGIs $75k-100k, 17.1% for AGIs over 100k)
Earned income credit: $1,518 (reported on 9.3% of returns)
Here:
$1,518
State:
$1,643
Percentage of individuals using paid preparers for their 2004 taxes: 57.0%
Here:
57%
State:
56%
(% for various income ranges: 48.4% for AGIs below $10k, 57.7% for AGIs $10k-25k, 57.3% for AGIs $25k-50k, 60.0% for AGIs $50k-75k, 57.9% for AGIs $75k-100k, 67.0% for AGIs over 100k)
Household received Food Stamps/SNAP in the past 12 months: 559 Household did not receive Food Stamps/SNAP in the past 12 months: 8,009
Women who had a birth in the past 12 months: 150 (136 now married, 20 unmarried) Women who did not have a birth in the past 12 months: 3,836 (2,300 now married, 1,509 unmarried)
Housing units in zip code 17552 with a mortgage: 4,038 (669 second mortgage, 70 home equity loan, 532 both second mortgage and home equity loan) Houses without a mortgage: 319
Median monthly owner costs for units with a mortgage: $1,578 Median monthly owner costs for units without a mortgage: $670
Residents with income below the poverty level in 2022:
This zip code:
5.2%
Whole state:
11.8%
Residents with income below 50% of the poverty level in 2022:
This zip code:
4.2%
Whole state:
6.1%
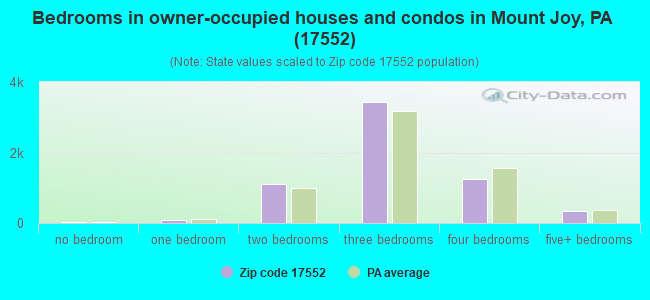
Median number of rooms in houses and condos:
Here:
6.8
State:
6.8
Median number of rooms in apartments:
Here:
4.5
State:
4.3
Notable locations in this zip code not listed on our city pages
Notable locations in zip code 17552: Hessland Farms (A), Rocky Acre Farms (B), Esbenshade Farms (C), Green Acres Farm (D), Hillside Farm (E), Cloverleaf Herb Farm (F), Chickies Creek Farm (G), Vogt Farm (H), Fittery Farms (I), Sauder Farm (J), Fire Department Mount Joy Station 7 - 5 (K), Mount Joy Township Forest Fire Crew Station 7 - 14 (L). Display/hide their locations on the map
Churches in zip code 17552 include: Glossbremer Church (A), Cross Roads Church (B), Florin Church (C), Mount Pleasant Church (D), Saint Lukes Church (E), Calvary Church (F). Display/hide their locations on the map
In group quarters: 24 (-1 institutionalized population)
Size of family households: 3,416 2-persons, 1,229 3-persons, 641 4-persons, 449 5-persons, 242 6-persons, 62 7-or-more-persons
Size of nonfamily households: 2,245 1-person, 322 2-persons
2,960 married couples with children.
762 single-parent households (251 men, 511 women).
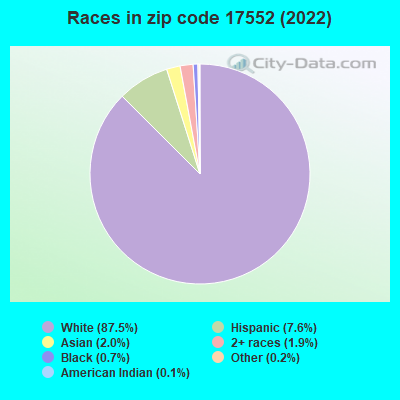
92.7% of residents of 17552 zip code speak English at home.
3.4% of residents speak Spanish at home (48% very well, 39% well, 13% not well).
1.8% of residents speak other Indo-European language at home (93% very well, 7% well).
1.3% of residents speak Asian or Pacific Island language at home (40% very well, 11% well, 9% not well, 39% not at all).
0.4% of residents speak other language at home (75% very well, 25% not at all).
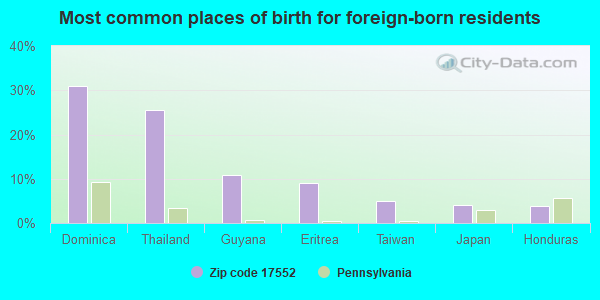
Foreign born population: 845 (4.3%) (64.7% of them are naturalized citizens)
This zip code:
4.3%
Whole state:
7.5%
31%Dominica
26%Thailand
11%Guyana
9%Eritrea
5%Taiwan
4%Japan
4%Honduras
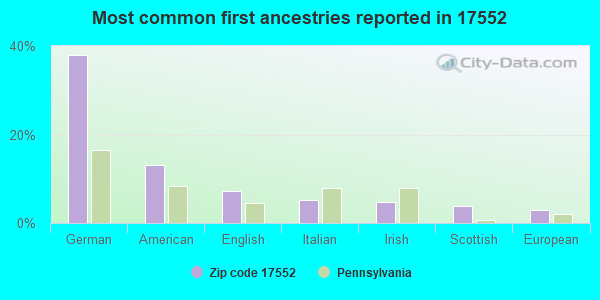
38%German
13%American
7%English
5%Italian
5%Irish
4%Scottish
3%European
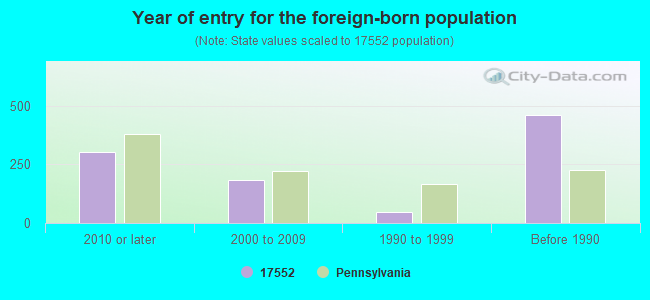
Year of entry for the foreign-born population
3012010 or later
1832000 to 2009
491990 to 1999
461Before 1990
Facilities with environmental interests located in this zip code:
AMP MFG (30 S JACOB ST in MOUNT JOY, PA)
STATE MASTER (Pennsylvania database) - RCRIS-PAD981741226, HAZARDOUS WASTE PROGRAM Small Quantity Generators, between 100 kg and 1000 kg of hazardous waste/month (Resource Conservation and Recovery Act (tracking hazardous waste)) - notification Business NAICS classification: OTHER ELECTRONIC COMPONENT MANUFACTURING. Organizations: OPERNAME (CONTACT/OPERATOR)
, A M P INC (CONTACT/OWNER)
, TYCO ELECTRONICS CORP (CONTACT/OWNER)
Alternative names: AMP INC MFG, TYCO ELECTRONICS CORP
AMP (218 S PLUM STREET in MOUNT JOY, PA)
STATE MASTER (Pennsylvania database) - RCRIS-PAD010557643, HAZARDOUS WASTE PROGRAM Small Quantity Generators, between 100 kg and 1000 kg of hazardous waste/month (Resource Conservation and Recovery Act (tracking hazardous waste)) - notification Organizations: OPERNAME (CONTACT/OPERATOR)
, AMP INC (CONTACT/OWNER)
AUTOKRAFT BOX (MARKET & FRANK STS in MOUNT JOY, PA)
STATE MASTER (Pennsylvania database) - RCRIS-PAD987299963, HAZARDOUS WASTE PROGRAM Small Quantity Generators, between 100 kg and 1000 kg of hazardous waste/month (Resource Conservation and Recovery Act (tracking hazardous waste)) - notification Organizations: AUTOKRAFT BOX CORP (CONTACT/OWNER)
BARTON'S BODY SHOP (970 REAR MAIN ST in MOUNT JOY, PA)
AIR MINOR (AIRS/AFS) Conditionally Exempt Small Quantity Generators, less than 100 kg/month of hazardous waste (Resource Conservation and Recovery Act (tracking hazardous waste)) Business SIC classification: AUTOMOTIVE REPAIR SHOPS Organizations: OPERNAME (CONTACT/OPERATOR)
, BARTON, EUGENE (CONTACT/OWNER)
AGREEABLE AUTO SALVAGE (865 MILTON GROVE RD in MOUNT JOY, PA)
Small Quantity Generators, between 100 kg and 1000 kg of hazardous waste/month (Resource Conservation and Recovery Act (tracking hazardous waste)) - notification Organizations: OPERNAME (CONTACT/OPERATOR)
, GRIMM, BRIAN; RAY; SANDRA (CONTACT/OWNER)
Housing units lacking complete kitchen facilities: 1.7%
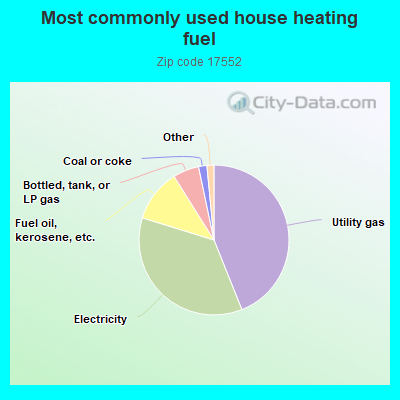
43.9%Utility gas
35.8%Electricity
11.3%Fuel oil, kerosene, etc.
5.6%Bottled, tank, or LP gas
1.8%Coal or coke
0.7%Other fuel
0.5%Wood
Population in 1990: 12,282. Population change in the 1990s: +1,942 (+15.8%).
Place of birth for U.S.-born residents:
This state: 15,560
Northeast: 1,432
Midwest: 571
South: 1,089
West: 128
63% of the 17552 zip code residents lived in the same house 5 years ago. Out of people who lived in different houses, 74% lived in this county. Out of people who lived in different counties, 50% lived in Pennsylvania.
89% of the 17552 zip code residents lived in the same house 1 year ago. Out of people who lived in different houses, 67% moved from this county. Out of people who lived in different houses, 15% moved from different county within same state. Out of people who lived in different houses, 14% moved from different state. Out of people who lived in different houses, 2% moved from abroad.
Private vs. public school enrollment:
Students in private schools in grades 1 to 8 (elementary and middle school): 443
Here:
22.2%
Pennsylvania:
15.7%
Students in private schools in grades 9 to 12 (high school): 155
Here:
27.9%
Pennsylvania:
13.4%
Students in private undergraduate colleges: 155
Here:
43.8%
Pennsylvania:
39.8%
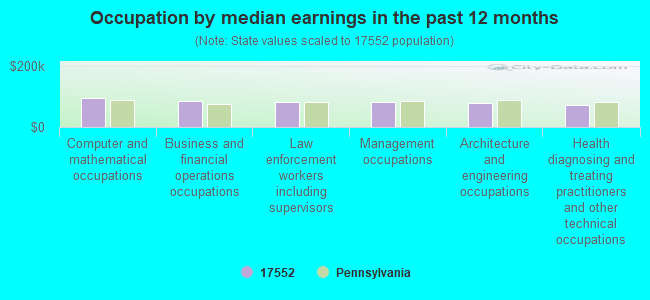
Occupation by median earnings in the past 12 months ($)
96,067Computer and mathematical occupations
86,456Business and financial operations occupations
81,271Law enforcement workers including supervisors
80,836Management occupations
77,877Architecture and engineering occupations
73,104Health diagnosing and treating practitioners and other technical occupations
Companies with federal contracts located in this zip code:
BLOCK ELEVATOR COMPANY (1150 WEST MAIN STREET in MOUNT JOY, PA; small business) : $212,789 in 41 contractsfrom 1999 to 2005
Contracts for Maintenance, Repair and Rebuilding of Equipment -- Electric Wire, and Power and Distribution Equipment, Maintenance, Repair and Rebuilding of Equipment -- Electrical and Electronic Equipment Components, Other Professional Services, Maintenance, Repair and Rebuilding of Equipment -- Special Industry Machinery, and moreby Army, Air Force, Navy, Department of Veterans Affairs, and others Signed by year:2000: $4,000; 2001: $68,424; 2002: $11,395; 2003: $55,603; 2004: $38,594; 2005: $33,773; 2006: $0.
Biggest contracts:
$33,781 with Army for Maintenance, Repair and Rebuilding of Equipment -- Electric Wire, and Power and Distribution Equipment. Signed on 2001-12-21. Completion date: 2002-09-30.
$31,418 with Army for Maintenance, Repair and Rebuilding of Equipment -- Electrical and Electronic Equipment Components. Signed on 2005-10-20. Completion date: 2003-09-30.
$26,258, same as above.Signed on 2004-10-25. Completion date: 2003-09-30.
$25,588 with Air Force for Other Professional Services. Taking place in DC. Signed on 2001-01-29. Completion date: 2001-02-21.
REPFOR, INC (879 FARMDALE RD in MOUNT JOY, PA; small business) : $58,549 in 11 contractsfrom 2003 to 2006
Contracts for Bearings, Antifriction, Unmounted, Nails, Machine Keys, and Pins, Hardware, Commercial, Nuts and Washers, and moreby Army, Defense Logistics Agency, Navy Signed by year:2000: $0; 2001: $0; 2002: $0; 2003: $2,724; 2004: $21,133; 2005: $21,003; 2006: $13,689.
Biggest contracts:
$15,155 with Army for Bearings, Antifriction, Unmounted. Signed on 2004-04-06. Completion date: 2004-06-30.
$9,997 with Defense Logistics Agency for Nails, Machine Keys, and Pins. Taking place in WI. Signed on 2006-05-13. Completion date: 2006-06-26.
$9,238 with Defense Logistics Agency for Hardware, Commercial. Signed on 2005-03-15. Completion date: 2005-07-13.
$3,692 with Defense Logistics Agency for Nails, Machine Keys, and Pins. Signed on 2006-03-03. Completion date: 2006-05-02.
DONEGAL HYDRAULICS COMPANY INC (1303 W MAIN ST in MOUNT JOY, PA; small business) : $2,045 in 2 contractsin 2005
$3,670 with Navy for Power and Hand Pumps. Taking place in CA. Signed on 2005-08-08. Completion date: 2005-11-07.
-$1,625 with Navy for Power and Hand Pumps. Signed on 2005-10-11. Completion date: 2005-11-04.
Top industries in this zip code by the number of employees in 2005:
2002 - 2018 National Fire Incident Reporting System (NFIRS) incidents
Based on the data from the years 2002 - 2018 the average number of fire incidents per year is 93. The highest number of fires - 166 took place in 2007, and the least - 22 in 2002. The data has an increasing trend.
When looking into fire subcategories, the most reports belonged to: Structure Fires (69.5%), and Outside Fires (17.7%).
Fire incident types reported to NFIRS in Zip Code 17552

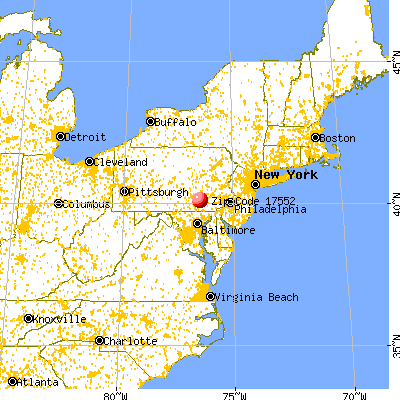


 Nearest zip codes: 17570, 17512, 17550, 17547, 17538, 17545.
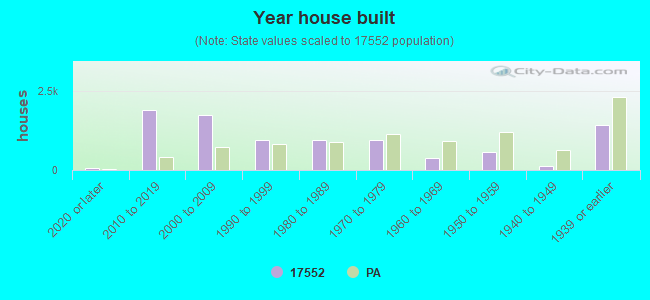


 Based on the data from the years 2002 - 2018 the average number of fire incidents per year is 93. The highest number of fires - 166 took place in 2007, and the least - 22 in 2002. The data has an increasing trend.
 When looking into fire subcategories, the most reports belonged to: Structure Fires (69.5%), and Outside Fires (17.7%).