Estimated zip code population in 2022: 22,538 Zip code population in 2010: 21,256 Zip code population in 2000: 19,225
Houses and condos: 9,178 Renter-occupied apartments: 1,613
% of renters here:
18%
State:
31%
March 2022 cost of living index in zip code 17545: 95.8 (near average, U.S. average is 100)
Land area: 70.9 sq. mi. Water area: 0.4 sq. mi.
Population density: 318 people per square mile
(very low).
OSM Map
General Map
Google Map
MSN Map
OSM Map
General Map
Google Map
MSN Map
OSM Map
General Map
Google Map
MSN Map
OSM Map
General Map
Google Map
MSN Map
Please wait while loading the map...
Real estate property taxes paid for housing units in 2022:
This zip code:
1.3% ($3,471)
Pennsylvania:
1.3% ($3,094)
Median real estate property taxes paid for housing units with mortgages in 2022: $3,457 (1.2%) Median real estate property taxes paid for housing units with no mortgage in 2022: $3,498 (1.4%)
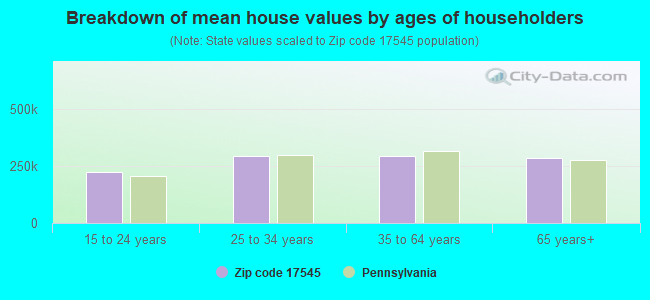
Estimated median house/condo value in 2022: $277,191
17545:
$277,191
Pennsylvania:
$245,500
According to our research of Pennsylvania and other state lists, there were 26 registered sex offenders living in 17545 zip code as of April 27, 2024. The ratio of all residents to sex offenders in zip code 17545 is 876 to 1. The ratio of registered sex offenders to all residents in this zip code is lower than the state average.
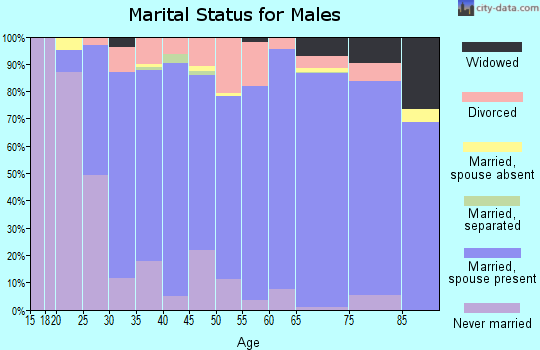
Median resident age:
This zip code:
44.8 years
Pennsylvania median age:
40.9 years
Average household size:
This zip code:
2.4 people
Pennsylvania:
2.4 people
Averages for the 2020 tax year for zip code 17545, filed in 2021:
Average Adjusted Gross Income (AGI) in 2020: $75,875 (Individual Income Tax Returns)
Here:
$75,875
State:
$75,707
Salary/wage: $58,476 (reported on 79.8% of returns)
Here:
$58,476
State:
$62,806
(% of AGI for various income ranges: 1116.7% for AGIs below $25k, 3617.2% for AGIs $25k-50k, 6734.3% for AGIs $50k-75k, 9426.2% for AGIs $75k-100k, 17486.8% for AGIs $100k-200k, 80180.0% for AGIs over 200k)
Taxable interest for individuals: $2,291 (reported on 35.1% of returns)
This zip code:
$2,291
Pennsylvania:
$1,633
(% of AGI for various income ranges: 41.0% for AGIs below $25k, 46.1% for AGIs $25k-50k, 59.3% for AGIs $50k-75k, 94.5% for AGIs $75k-100k, 193.9% for AGIs $100k-200k, 3106.2% for AGIs over 200k)
Ordinary dividends: $4,241 (reported on 24.7% of returns)
Here:
$4,241
State:
$7,382
(% of AGI for various income ranges: 53.2% for AGIs below $25k, 49.5% for AGIs $25k-50k, 96.1% for AGIs $50k-75k, 133.6% for AGIs $75k-100k, 289.7% for AGIs $100k-200k, 3676.9% for AGIs over 200k)
Net capital gain/loss in AGI: +$15,034 (reported on 22.0% of returns)
Here:
+$15,034
State:
+$23,522
(% of AGI for various income ranges: 24.9% for AGIs below $25k, 44.6% for AGIs $25k-50k, 125.7% for AGIs $50k-75k, 172.7% for AGIs $75k-100k, 858.9% for AGIs $100k-200k, 19176.2% for AGIs over 200k)
Profit/loss from business: +$18,869 (reported on 15.1% of returns)
Here:
+$18,869
State:
+$16,274
(% of AGI for various income ranges: 118.3% for AGIs below $25k, 196.7% for AGIs $25k-50k, 353.4% for AGIs $50k-75k, 495.5% for AGIs $75k-100k, 945.4% for AGIs $100k-200k, 6537.7% for AGIs over 200k)
Taxable individual retirement arrangement distribution: $15,361 (reported on 13.7% of returns)
17545:
$15,361
Pennsylvania:
$18,583
(% of AGI for various income ranges: 133.4% for AGIs below $25k, 161.5% for AGIs $25k-50k, 240.4% for AGIs $50k-75k, 431.5% for AGIs $75k-100k, 813.8% for AGIs $100k-200k, 2763.8% for AGIs over 200k)
Self-employed (Keogh) retirement plans: $19,150 (reported on 0.5% of returns)
17545:
$19,150
Pennsylvania:
$25,407
(% of AGI for various income ranges: 39.4% for AGIs $100k-200k, 580.8% for AGIs over 200k)
Total itemized deductions: $40,713 (reported on 8.0% of returns)
Here:
$40,713
State:
$34,850
(% of AGI for various income ranges: 84.2% for AGIs below $25k, 124.2% for AGIs $25k-50k, 225.8% for AGIs $50k-75k, 370.7% for AGIs $75k-100k, 1155.8% for AGIs $100k-200k, 11920.0% for AGIs over 200k)
Charity contributions: $22,276 (reported on 6.6% of returns)
Here:
$22,276
State:
$12,392
(% of AGI for various income ranges: 5.1% for AGIs below $25k, 26.2% for AGIs $25k-50k, 50.0% for AGIs $50k-75k, 81.2% for AGIs $75k-100k, 397.7% for AGIs $100k-200k, 8321.5% for AGIs over 200k)
Taxes paid: $7,745 (reported on 8.0% of returns)
17545:
$7,745
State:
$8,200
(% of AGI for various income ranges: 10.5% for AGIs below $25k, 20.5% for AGIs $25k-50k, 52.9% for AGIs $50k-75k, 97.7% for AGIs $75k-100k, 262.0% for AGIs $100k-200k, 1802.3% for AGIs over 200k)
Earned income credit: $1,875 (reported on 7.7% of returns)
Here:
$1,875
State:
$2,100
(% of AGI for various income ranges: 42.3% for AGIs below $25k, 41.7% for AGIs $25k-50k, 1.0% for AGIs $50k-75k)
Percentage of individuals using paid preparers for their 2020 taxes: 92.5%
Here:
92%
State:
92%
(% for various income ranges: 91.2% for AGIs below $25k, 92.7% for AGIs $25k-50k, 93.0% for AGIs $50k-75k, 92.4% for AGIs $75k-100k, 93.7% for AGIs $100k-200k, 94.0% for AGIs over 200k)
Averages for the 2012 tax year for zip code 17545, filed in 2013:
Average Adjusted Gross Income (AGI) in 2012: $57,714 (Individual Income Tax Returns)
Here:
$57,714
State:
$61,346
Salary/wage: $46,672 (reported on 81.1% of returns)
Here:
$46,672
State:
$51,902
(% of AGI for various income ranges: 65.6% for AGIs below $25k, 72.9% for AGIs $25k-50k, 73.8% for AGIs $50k-75k, 74.2% for AGIs $75k-100k, 71.0% for AGIs $100k-200k, 41.9% for AGIs over 200k)
Taxable interest for individuals: $1,984 (reported on 42.0% of returns)
This zip code:
$1,984
Pennsylvania:
$1,588
(% of AGI for various income ranges: 2.7% for AGIs below $25k, 1.4% for AGIs $25k-50k, 0.9% for AGIs $50k-75k, 0.8% for AGIs $75k-100k, 1.3% for AGIs $100k-200k, 2.2% for AGIs over 200k)
Ordinary dividends: $3,755 (reported on 26.8% of returns)
Here:
$3,755
State:
$5,827
(% of AGI for various income ranges: 3.0% for AGIs below $25k, 1.2% for AGIs $25k-50k, 1.3% for AGIs $50k-75k, 1.0% for AGIs $75k-100k, 1.6% for AGIs $100k-200k, 2.7% for AGIs over 200k)
Net capital gain/loss in AGI: +$7,958 (reported on 19.4% of returns)
Here:
+$7,958
State:
+$14,495
(% of AGI for various income ranges: 0.9% for AGIs $25k-50k, 1.1% for AGIs $50k-75k, 0.7% for AGIs $75k-100k, 2.0% for AGIs $100k-200k, 8.3% for AGIs over 200k)
Profit/loss from business: +$16,944 (reported on 15.5% of returns)
Here:
+$16,944
State:
+$16,268
(% of AGI for various income ranges: 6.1% for AGIs below $25k, 4.7% for AGIs $25k-50k, 4.3% for AGIs $50k-75k, 4.1% for AGIs $75k-100k, 5.2% for AGIs $100k-200k, 3.9% for AGIs over 200k)
Taxable individual retirement arrangement distribution: $11,876 (reported on 15.1% of returns)
17545:
$11,876
Pennsylvania:
$14,550
(% of AGI for various income ranges: 6.3% for AGIs below $25k, 3.5% for AGIs $25k-50k, 2.9% for AGIs $50k-75k, 3.1% for AGIs $75k-100k, 3.3% for AGIs $100k-200k, 1.8% for AGIs over 200k)
Self-employment retirement plans: $14,183 (reported on 0.6% of returns)
17545:
$14,183
Pennsylvania:
$20,922
Total itemized deductions: $21,994 (21% of AGI, reported on 34.3% of returns)
Here:
$21,994
State:
$23,538
Here:
20.6% of AGI
State:
18.4% of AGI
(% of AGI for various income ranges: 9.7% for AGIs below $25k, 10.9% for AGIs $25k-50k, 13.5% for AGIs $50k-75k, 14.6% for AGIs $75k-100k, 15.4% for AGIs $100k-200k, 11.7% for AGIs over 200k)
Charity contributions: $6,331 (reported on 28.3% of returns)
Here:
$6,331
State:
$4,025
(% of AGI for various income ranges: 1.2% for AGIs below $25k, 1.9% for AGIs $25k-50k, 2.5% for AGIs $50k-75k, 2.7% for AGIs $75k-100k, 3.7% for AGIs $100k-200k, 4.7% for AGIs over 200k)
Taxes paid: $7,870 (reported on 34.2% of returns)
17545:
$7,870
State:
$9,982
(% of AGI for various income ranges: 2.1% for AGIs below $25k, 3.1% for AGIs $25k-50k, 4.5% for AGIs $50k-75k, 5.2% for AGIs $75k-100k, 6.2% for AGIs $100k-200k, 4.7% for AGIs over 200k)
Earned income credit: $1,831 (reported on 10.6% of returns)
Here:
$1,831
State:
$2,106
(% of AGI for various income ranges: 3.2% for AGIs below $25k, 0.7% for AGIs $25k-50k)
Percentage of individuals using paid preparers for their 2012 taxes: 59.5%
Here:
59%
State:
53%
(% for various income ranges: 53.7% for AGIs below $25k, 60.7% for AGIs $25k-50k, 62.3% for AGIs $50k-75k, 62.1% for AGIs $75k-100k, 64.2% for AGIs $100k-200k, 85.2% for AGIs over 200k)
Averages for the 2004 tax year for zip code 17545, filed in 2005:
Average Adjusted Gross Income (AGI) in 2004: $48,106 (Individual Income Tax Returns)
Here:
$48,106
State:
$48,049
Salary/wage: $40,123 (reported on 83.7% of returns)
Here:
$40,123
State:
$42,646
(% of AGI for various income ranges: 122.2% for AGIs below $10k, 69.2% for AGIs $10k-25k, 77.5% for AGIs $25k-50k, 79.8% for AGIs $50k-75k, 78.1% for AGIs $75k-100k, 52.5% for AGIs over 100k)
Taxable interest for individuals: $1,825 (reported on 52.9% of returns)
This zip code:
$1,825
Pennsylvania:
$1,657
(% of AGI for various income ranges: 9.8% for AGIs below $10k, 4.3% for AGIs $10k-25k, 1.9% for AGIs $25k-50k, 1.5% for AGIs $50k-75k, 1.3% for AGIs $75k-100k, 2.0% for AGIs over 100k)
Taxable dividends: $2,450 (reported on 31.2% of returns)
Here:
$2,450
State:
$3,566
(% of AGI for various income ranges: 5.7% for AGIs below $10k, 2.2% for AGIs $10k-25k, 1.3% for AGIs $25k-50k, 1.1% for AGIs $50k-75k, 1.3% for AGIs $75k-100k, 1.9% for AGIs over 100k)
Net capital gain/loss: +$12,522 (reported on 22.5% of returns)
Here:
+$12,522
State:
+$9,716
(% of AGI for various income ranges: 5.3% for AGIs below $10k, 0.4% for AGIs $10k-25k, 1.4% for AGIs $25k-50k, 1.1% for AGIs $50k-75k, 1.7% for AGIs $75k-100k, 15.1% for AGIs over 100k)
Profit/loss from business: +$15,362 (reported on 15.7% of returns)
Here:
+$15,362
State:
+$14,267
(% of AGI for various income ranges: 3.5% for AGIs below $10k, 6.4% for AGIs $10k-25k, 4.6% for AGIs $25k-50k, 4.2% for AGIs $50k-75k, 5.0% for AGIs $75k-100k, 5.6% for AGIs over 100k)
Profit/loss from farming: +$7,127 (reported on 3.2% of returns)
Here:
+$7,127
State:
+$274
(% of AGI for various income ranges: -6.0% for AGIs below $10k, -0.2% for AGIs $10k-25k, 1.0% for AGIs $25k-50k, 0.6% for AGIs $50k-75k, 1.7% for AGIs $75k-100k, -0.1% for AGIs over 100k)
IRA payment deduction: $3,022 (reported on 3.8% of returns)
17545:
$3,022
Pennsylvania:
$2,903
(% of AGI for various income ranges: 0.4% for AGIs below $10k, 0.4% for AGIs $10k-25k, 0.4% for AGIs $25k-50k, 0.3% for AGIs $50k-75k, 0.2% for AGIs $75k-100k, 0.1% for AGIs over 100k)
Self-employed pension: $11,690 (reported on 0.9% of returns)
Here:
$11,690
Pennsylvania:
$14,674
Total itemized deductions: $17,407 (20% of AGI, reported on 34.6% of returns)
Here:
$17,407
State:
$18,804
Here:
20.5% of AGI
State:
19.5% of AGI
(% of AGI for various income ranges: 12.6% for AGIs below $10k, 10.2% for AGIs $10k-25k, 11.5% for AGIs $25k-50k, 13.6% for AGIs $50k-75k, 15.4% for AGIs $75k-100k, 11.5% for AGIs over 100k)
Charity contributions deductions: $4,965 (6% of AGI, reported on 30.5% of returns)
Here:
$4,965
State:
$3,337
Here:
5.6% of AGI
State:
3.3% of AGI
(% of AGI for various income ranges: 1.4% for AGIs below $10k, 1.7% for AGIs $10k-25k, 2.0% for AGIs $25k-50k, 2.7% for AGIs $50k-75k, 3.9% for AGIs $75k-100k, 4.2% for AGIs over 100k)
Total tax: $7,244 (reported on 77.9% of returns)
17545:
$7,244
State:
$8,008
(% of AGI for various income ranges: 3.4% for AGIs below $10k, 4.7% for AGIs $10k-25k, 7.2% for AGIs $25k-50k, 8.5% for AGIs $50k-75k, 10.3% for AGIs $75k-100k, 19.3% for AGIs over 100k)
Earned income credit: $1,502 (reported on 7.5% of returns)
Here:
$1,502
State:
$1,643
Percentage of individuals using paid preparers for their 2004 taxes: 62.0%
Here:
62%
State:
56%
(% for various income ranges: 53.9% for AGIs below $10k, 61.0% for AGIs $10k-25k, 62.2% for AGIs $25k-50k, 67.3% for AGIs $50k-75k, 63.2% for AGIs $75k-100k, 70.5% for AGIs over 100k)
Likely homosexual households (counted as self-reported same-sex unmarried-partner households)
Lesbian couples: 0.0% of all households
Gay men: 0.1% of all households
Household received Food Stamps/SNAP in the past 12 months: 423 Household did not receive Food Stamps/SNAP in the past 12 months: 8,733
Women who had a birth in the past 12 months: 368 (380 now married, 10 unmarried) Women who did not have a birth in the past 12 months: 4,207 (2,269 now married, 1,917 unmarried)
Housing units in zip code 17545 with a mortgage: 4,180 (682 second mortgage, 14 home equity loan, 611 both second mortgage and home equity loan) Houses without a mortgage: 402
Median monthly owner costs for units with a mortgage: $1,576 Median monthly owner costs for units without a mortgage: $618
Residents with income below the poverty level in 2022:
This zip code:
6.0%
Whole state:
11.8%
Residents with income below 50% of the poverty level in 2022:
This zip code:
2.1%
Whole state:
6.1%
Median number of rooms in houses and condos:
Here:
6.7
State:
6.8
Median number of rooms in apartments:
Here:
4.4
State:
4.3
Notable locations in this zip code not listed on our city pages
Notable locations in zip code 17545: Tree Top Golf Course (A), Aljane Farm (B), Hershvale Farms (C), King Dairy Farm (D), Maplebrink Farms (E), Sparkle Stream Farm (F), Wil Lyn Farms (G), Skyview Dairy (H), Spring Valley Dairy (I), Kulpdale Farm (J), Lehman Farms (K), Graemont Farm (L), Oberley Farms (M), Fahnestock Farms (N), Longnecker Farm (O), Windward Farms (P), Kready Farm (Q), Blueberry Hill Farm (R), Lancaster Junction Farm (S), Seibel Farms (T). Display/hide their locations on the map
Churches in zip code 17545 include: Union Church (A), White Oak Church (B), Pleasant View Church (C), Hernley Church (D), Gantzs Church (E), Ruhls Church (F), Kreiders Church (G), Mount Hope Church (H), Chickies Church (I). Display/hide their locations on the map
Cemeteries: Shumaker Cemetery (1), Earhart Cemetery (2), Pleasant View Cemetery (3), Fairview Cemetery (4), Kauffman Cemetery (5). Display/hide their locations on the map
Streams, rivers, and creeks: Dellinger Run (A), Shearers Creek (B), Doe Run (C), Rife Run (D), Behm Run (E), Boyers Run (F). Display/hide their locations on the map
3,648 married couples with children.
537 single-parent households (69 men, 468 women).
94.5% of residents of 17545 zip code speak English at home.
0.6% of residents speak Spanish at home (67% very well, 15% well, 18% not well).
4.0% of residents speak other Indo-European language at home (87% very well, 12% well, 1% not well, 1% not at all).
0.5% of residents speak Asian or Pacific Island language at home (70% very well, 30% well).
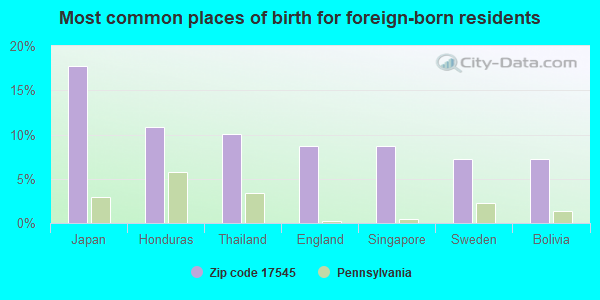
Foreign born population: 279 (1.2%) (77.5% of them are naturalized citizens)
This zip code:
1.2%
Whole state:
7.5%
18%Japan
11%Honduras
10%Thailand
9%England
9%Singapore
7%Sweden
7%Bolivia
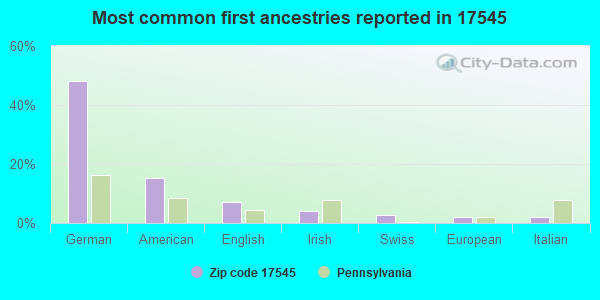
48%German
15%American
7%English
4%Irish
3%Swiss
2%European
2%Italian
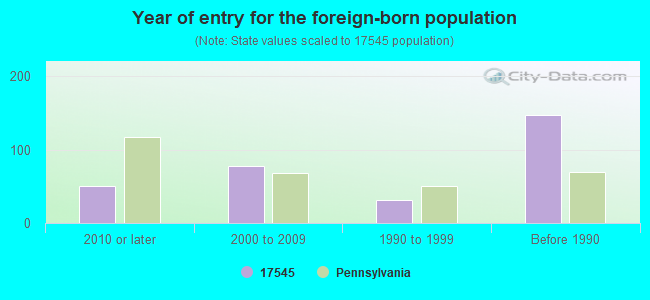
Year of entry for the foreign-born population
512010 or later
782000 to 2009
311990 to 1999
147Before 1990
Facilities with environmental interests located in this zip code:
BIGBEE STEEL MFG PLT (99 W. ELIZABETHTOWN RD. in MANHEIM, PA)
AIR MAJOR (AIRS/AFS) CRITERIA AND HAZARDOUS AIR POLLUTANT INVENTORY (Inventory of air pollution sources) STATE MASTER (Pennsylvania database) - PCS-PAR203523, National Pollutant Discharge Elimination System Permit, AFS-23-1581345-1, AIR PROGRAM, RCRIS-PAD003003340, HAZARDOUS WASTE PROGRAM National Pollutant Discharge Elimination System NON-MAJOR (Tracking pollutant discharge elimination systems) - permit Large Quantity Generators, more that 1000 kg of hazardous waste/month (Resource Conservation and Recovery Act (tracking hazardous waste)) TRI REPORTER (Tracking of toxic chemicals releasing facilities) Business SIC classification: FABRICATED PLATE WORK (BOILER SHOPS) Organizations: OPERNAME (CONTACT/OPERATOR)
, BIGBEE STEEL & TANK CO (CONTACT/OWNER)
Alternative names: BIGBEE STEEL & TANK CO
A&M COMPOSTING INC (2022 MOUNTAIN ROAD in MANHEIM, PA)
AIR MINOR (AIRS/AFS) STATE MASTER (New Jersey environmental info) - NJEMS-292918, WATER QUALITY - NJPDES STATE MASTER (Pennsylvania database) - AFS-23-2240278-1, AIR PROGRAM Business SIC classification: REFUSE SYSTEMS Alternative names: A & M COMPOSTING FAC
AL HAMILTON TRUCK MAINT (55 DOE RUN ROAD in MANHEIM, PA)
STATE MASTER (Pennsylvania database) - RCRIS-PAR000035386, HAZARDOUS WASTE PROGRAM Conditionally Exempt Small Quantity Generators, less than 100 kg/month of hazardous waste (Resource Conservation and Recovery Act (tracking hazardous waste)) - notification Organizations: HAMILTON AL (CONTACT/OWNER)
Alternative names: AL HAMILTON REAL ESTATE
BIO-PLEX ORGANICS (2213 HUBER DR in MANHEIM, PA)
COMPLIANCE ACTIVITY (Tracking inspections of insecticide, fungicide, and rodenticide, and toxic substances) Alternative names: BIOPLEX ORGANICS
ACE AUTO CO (744 BUCHDALE DR E in MANHEIM, PA)
Small Quantity Generators, between 100 kg and 1000 kg of hazardous waste/month (Resource Conservation and Recovery Act (tracking hazardous waste)) - notification Organizations: OPERNAME (CONTACT/OPERATOR)
, BASILE JACK (CONTACT/OWNER)
BILLIPS AUTO BODY (RD 8 E TOWN RD in MANHEIM, PA)
Small Quantity Generators, between 100 kg and 1000 kg of hazardous waste/month (Resource Conservation and Recovery Act (tracking hazardous waste)) - notification Organizations: OPERNAME (CONTACT/OPERATOR)
, BILLIPS, TOM (CONTACT/OWNER)
AMER PAPER PROD CO/MANHEIM (MANHEIM TWP in MANHEIM, PA)
AIR MAJOR (AIRS/AFS) Business SIC classification: PAPERBOARD MILLS
BEST OF FRIENDS BODY SHOP (126 EAST ELIZABETHTOWN RD in MANHEIM, PA)
Conditionally Exempt Small Quantity Generators, less than 100 kg/month of hazardous waste (Resource Conservation and Recovery Act (tracking hazardous waste)) - notification Organizations: ROHRER JIM (CONTACT/OWNER)
AGWAY INCORPORATED FEED PLANT (149 W. STEIGEL ST. in MANHEIM, PA)
TRI REPORTER (Tracking of toxic chemicals releasing facilities) Business SIC classification: PREPARED FEEDS AND FEED INGREDIENTS FOR ANIMALS AND FOWLS, EXCEPT DOGS AND CATS
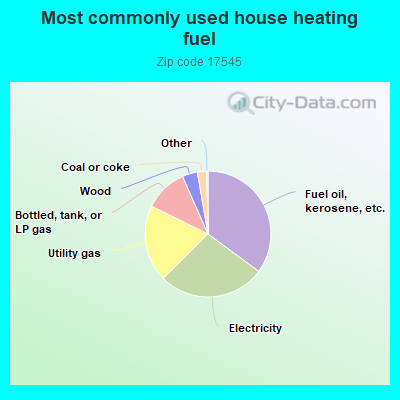
Housing units lacking complete kitchen facilities: 0.3%
35.1%Fuel oil, kerosene, etc.
27.5%Electricity
19.7%Utility gas
11.1%Bottled, tank, or LP gas
3.9%Wood
2.4%Coal or coke
Population in 1990: 16,992. Population change in the 1990s: +2,233 (+13.1%).
Place of birth for U.S.-born residents:
This state: 19,093
Northeast: 1,134
Midwest: 730
South: 958
West: 163
66% of the 17545 zip code residents lived in the same house 5 years ago. Out of people who lived in different houses, 79% lived in this county. Out of people who lived in different counties, 50% lived in Pennsylvania.
92% of the 17545 zip code residents lived in the same house 1 year ago. Out of people who lived in different houses, 63% moved from this county. Out of people who lived in different houses, 21% moved from different county within same state. Out of people who lived in different houses, 16% moved from different state.
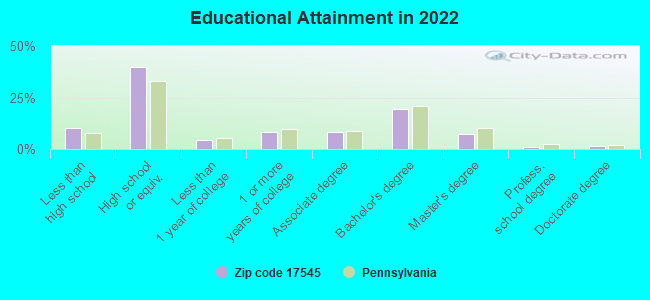
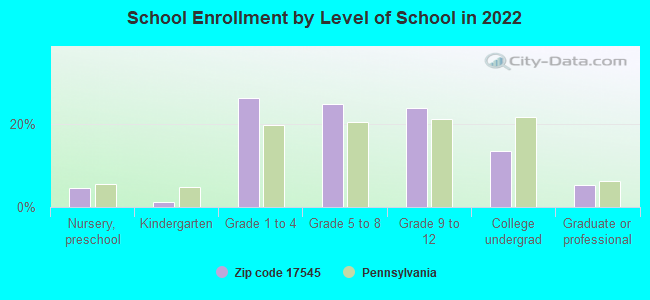
Private vs. public school enrollment:
Students in private schools in grades 1 to 8 (elementary and middle school): 718
Here:
33.9%
Pennsylvania:
15.7%
Students in private schools in grades 9 to 12 (high school): 61
Here:
6.3%
Pennsylvania:
13.4%
Students in private undergraduate colleges: 280
Here:
51.3%
Pennsylvania:
39.8%
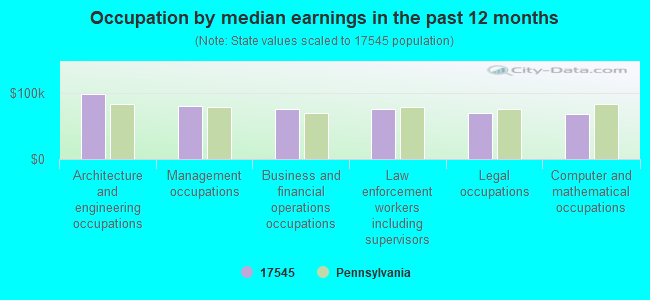
Occupation by median earnings in the past 12 months ($)
98,412Architecture and engineering occupations
80,239Management occupations
75,559Business and financial operations occupations
75,180Law enforcement workers including supervisors
68,565Legal occupations
67,775Computer and mathematical occupations
Companies with federal contracts located in this zip code (MANHEIM, PA):
PENN EL SERVICE CO (882 S CHIQUES RD; small business) : $61,434 in 17 contractsfrom 2002 to 2005
Contracts for Electrical Hardware and Supplies, Electrical Insulators and Insulating Materials, Packing and Gasket Materials, Nuts and Washers by Defense Logistics Agency, Navy Signed by year:2000: $0; 2001: $0; 2002: $34,945; 2003: $0; 2004: $10,495; 2005: $15,994; 2006: $0.
Biggest contracts:
$34,945 with Defense Logistics Agency for Electrical Hardware and Supplies. Signed on 2002-06-20. Completion date: 2002-09-03.
$4,684, same as above.Signed on 2005-01-13. Completion date: 2005-04-06.
$4,226, same as above.Signed on 2005-06-17. Completion date: 2005-09-04.
$3,870, same as above.Signed on 2005-03-22. Completion date: 2005-06-06.
CRANE SPECIALISTS INC (37 EAST END DRIVE; small business) : $41,610 in 9 contractsfrom 2003 to 2004
Contracts for Cranes and Crane-Shovels, Crane and Crane-Shovel Attachments by U.S. Army Corps of Engineers - civil program financing only, Army Signed by year:2000: $0; 2001: $0; 2002: $0; 2003: $34,560; 2004: $7,050; 2005: $0; 2006: $0.
Biggest contracts:
$15,662 with U.S. Army Corps of Engineers - civil program financing only for Cranes and Crane-Shovels. Signed on 2003-06-18. Completion date: 2003-06-03.
$9,449 with Army for Cranes and Crane-Shovels. Signed on 2003-11-03. Completion date: 2003-10-14.
$9,449 with U.S. Army Corps of Engineers - civil program financing only for Cranes and Crane-Shovels. Signed on 2003-11-03. Completion date: 2003-10-14.
$3,525 with Army for Crane and Crane-Shovel Attachments. Taking place in MO. Signed on 2004-02-27. Completion date: 2004-03-08.
AMISH COUNTRY GAZEBOS (340 HOSTETTER ROAD; small business)
$9,530 with Navy for Building Components, Prefabricated. Signed on 2004-09-10. Completion date: 2004-11-19.
FDL-USA INC (150 SHELLYLAND RD; small business)
$1,269 with Army for Miscellaneous Fabricated Nonmetallic Materials. Signed on 2005-11-21. Completion date: 2006-01-17.
Top industries in this zip code by the number of employees in 2005:
2002 - 2018 National Fire Incident Reporting System (NFIRS) incidents
Based on the data from the years 2002 - 2018 the average number of fire incidents per year is 122. The highest number of fires - 179 took place in 2005, and the least - 63 in 2012. The data has a rising trend.
When looking into fire subcategories, the most incidents belonged to: Structure Fires (66.1%), and Outside Fires (18.8%).
Fire incident types reported to NFIRS in Zip Code 17545


 Nearest zip codes: 17064, 17538, 17083, 17016, 17552, 17041.


 Based on the data from the years 2002 - 2018 the average number of fire incidents per year is 122. The highest number of fires - 179 took place in 2005, and the least - 63 in 2012. The data has a rising trend.
 When looking into fire subcategories, the most incidents belonged to: Structure Fires (66.1%), and Outside Fires (18.8%).