Estimated zip code population in 2022: 1,049 Zip code population in 2010: 1,277 Zip code population in 2000: 1,142
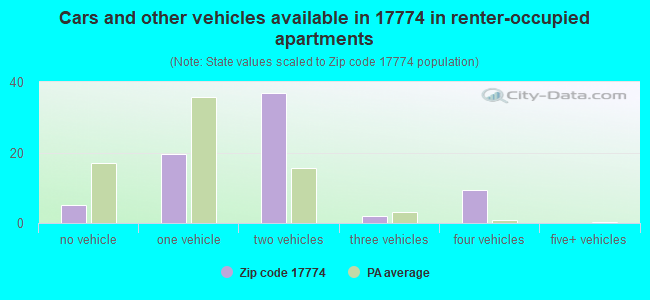
Houses and condos: 477 Renter-occupied apartments: 72
% of renters here:
18%
State:
31%
March 2022 cost of living index in zip code 17774: 92.6 (less than average, U.S. average is 100)
Land area: 47.7 sq. mi. Water area: 0.1 sq. mi.
Population density: 22 people per square mile
(very low).
OSM Map
General Map
Google Map
MSN Map
OSM Map
General Map
Google Map
MSN Map
OSM Map
General Map
Google Map
MSN Map
OSM Map
General Map
Google Map
MSN Map
Please wait while loading the map...
Real estate property taxes paid for housing units in 2022:
This zip code:
1.0% ($2,310)
Pennsylvania:
1.3% ($3,094)
Median real estate property taxes paid for housing units with mortgages in 2022: $2,679 (1.0%) Median real estate property taxes paid for housing units with no mortgage in 2022: $1,762 (0.9%)
Business Search- 14 Million verified businesses
Males: 507
(48.3%)
Females: 542
(51.7%)
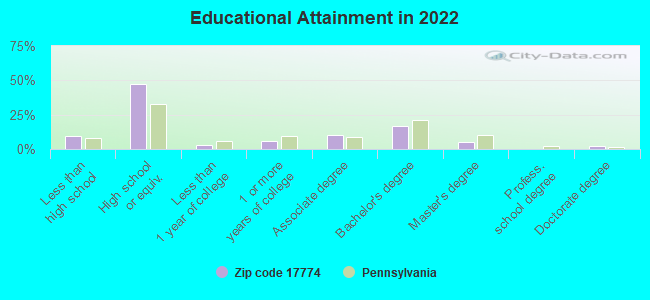
For population 25 years and over in 17774:
High school or higher: 89.6%
Bachelor's degree or higher: 23.9%
Graduate or professional degree: 7.1%
Unemployed: 8.5%
Mean travel time to work (commute): 29.2 minutes
For population 15 years and over in 17774:
Never married: 24.5%
Now married: 56.5%
Separated: 3.1%
Widowed: 7.1%
Divorced: 8.9%
Zip code 17774 compared to state average:
Unemployed percentage above state average.
Black race population percentage significantly below state average.
Hispanic race population percentage significantly below state average.
Median age above state average.
Foreign-born population percentage significantly below state average.
Renting percentage below state average.
Length of stay since moving in significantly above state average.
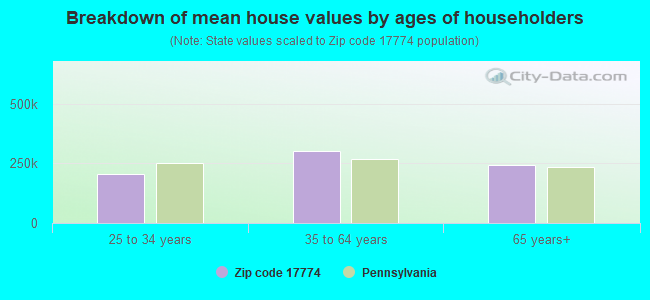
Estimated median house/condo value in 2022: $234,972
17774:
$234,972
Pennsylvania:
$245,500
According to our research of Pennsylvania and other state lists, there was 1 registered sex offender living in 17774 zip code as of April 26, 2024. The ratio of all residents to sex offenders in zip code 17774 is 1,431 to 1. The ratio of registered sex offenders to all residents in this zip code is much lower than the state average.
Median resident age:
This zip code:
45.7 years
Pennsylvania median age:
40.9 years
Average household size:
This zip code:
2.6 people
Pennsylvania:
2.4 people
Averages for the 2020 tax year for zip code 17774, filed in 2021:
Average Adjusted Gross Income (AGI) in 2020: $51,260 (Individual Income Tax Returns)
Here:
$51,260
State:
$75,707
Salary/wage: $46,048 (reported on 79.2% of returns)
Here:
$46,048
State:
$62,806
(% of AGI for various income ranges: 1070.8% for AGIs below $25k, 3632.7% for AGIs $25k-50k, 5466.7% for AGIs $50k-75k, 10943.3% for AGIs $75k-100k, 18472.5% for AGIs $100k-200k)
Taxable interest for individuals: $377 (reported on 24.5% of returns)
This zip code:
$377
Pennsylvania:
$1,633
(% of AGI for various income ranges: 15.4% for AGIs below $25k, 13.6% for AGIs $25k-50k, 10.0% for AGIs $50k-75k, 20.0% for AGIs $100k-200k)
Ordinary dividends: $843 (reported on 13.2% of returns)
Here:
$843
State:
$7,382
(% of AGI for various income ranges: 30.0% for AGIs $25k-50k, 86.7% for AGIs $75k-100k)
Net capital gain/loss in AGI: +$3,180 (reported on 9.4% of returns)
Here:
+$3,180
State:
+$23,522
(% of AGI for various income ranges: 20.8% for AGIs below $25k, 220.0% for AGIs $50k-75k)
Profit/loss from business: +$6,900 (reported on 9.4% of returns)
Here:
+$6,900
State:
+$16,274
(% of AGI for various income ranges: 139.2% for AGIs below $25k, 149.1% for AGIs $25k-50k)
Taxable individual retirement arrangement distribution: $9,460 (reported on 9.4% of returns)
17774:
$9,460
Pennsylvania:
$18,583
(% of AGI for various income ranges: 110.0% for AGIs below $25k, 300.0% for AGIs $25k-50k)
Earned income credit: $2,025 (reported on 15.1% of returns)
Here:
$2,025
State:
$2,100
(% of AGI for various income ranges: 82.3% for AGIs below $25k, 50.0% for AGIs $25k-50k)
Percentage of individuals using paid preparers for their 2020 taxes: 92.5%
Here:
92%
State:
92%
(% for various income ranges: 94.7% for AGIs below $25k, 92.9% for AGIs $25k-50k, 87.5% for AGIs $50k-75k, 100.0% for AGIs $75k-100k, 85.7% for AGIs $100k-200k)
Averages for the 2012 tax year for zip code 17774, filed in 2013:
Average Adjusted Gross Income (AGI) in 2012: $42,300 (Individual Income Tax Returns)
Here:
$42,300
State:
$61,346
Salary/wage: $36,642 (reported on 83.3% of returns)
Here:
$36,642
State:
$51,902
(% of AGI for various income ranges: 66.6% for AGIs below $25k, 76.8% for AGIs $25k-50k, 75.1% for AGIs $50k-75k, 78.5% for AGIs $75k-100k, 63.9% for AGIs $100k-200k)
Taxable interest for individuals: $480 (reported on 27.8% of returns)
This zip code:
$480
Pennsylvania:
$1,588
(% of AGI for various income ranges: 0.9% for AGIs below $25k, 0.5% for AGIs $25k-50k, 0.4% for AGIs $50k-75k)
Ordinary dividends: $1,000 (reported on 13.0% of returns)
Here:
$1,000
State:
$5,827
Net capital gain/loss in AGI: +$1,250 (reported on 7.4% of returns)
Here:
+$1,250
State:
+$14,495
Profit/loss from business: +$8,562 (reported on 14.8% of returns)
Here:
+$8,562
State:
+$16,268
(% of AGI for various income ranges: 10.3% for AGIs below $25k, 3.2% for AGIs $25k-50k, 4.3% for AGIs $50k-75k)
Taxable individual retirement arrangement distribution: $9,980 (reported on 9.3% of returns)
17774:
$9,980
Pennsylvania:
$14,550
Total itemized deductions: $16,140 (19% of AGI, reported on 18.5% of returns)
Here:
$16,140
State:
$23,538
Here:
19.3% of AGI
State:
18.4% of AGI
(% of AGI for various income ranges: 8.7% for AGIs $25k-50k, 10.4% for AGIs $50k-75k, 9.6% for AGIs $100k-200k)
Charity contributions: $1,767 (reported on 11.1% of returns)
Here:
$1,767
State:
$4,025
Taxes paid: $6,070 (reported on 18.5% of returns)
17774:
$6,070
State:
$9,982
(% of AGI for various income ranges: 2.2% for AGIs $25k-50k, 3.7% for AGIs $50k-75k, 4.7% for AGIs $100k-200k)
Earned income credit: $2,144 (reported on 16.7% of returns)
Here:
$2,144
State:
$2,106
(% of AGI for various income ranges: 5.2% for AGIs below $25k, 1.1% for AGIs $25k-50k)
Percentage of individuals using paid preparers for their 2012 taxes: 66.7%
Here:
67%
State:
53%
(% for various income ranges: 59.1% for AGIs below $25k, 71.4% for AGIs $25k-50k, 70.0% for AGIs $50k-75k, 75.0% for AGIs $75k-100k, 75.0% for AGIs $100k-200k)
Averages for the 2004 tax year for zip code 17774, filed in 2005:
Average Adjusted Gross Income (AGI) in 2004: $32,572 (Individual Income Tax Returns)
Here:
$32,572
State:
$48,049
Salary/wage: $30,428 (reported on 87.7% of returns)
Here:
$30,428
State:
$42,646
(% of AGI for various income ranges: 191.9% for AGIs below $10k, 78.9% for AGIs $10k-25k, 81.5% for AGIs $25k-50k, 86.8% for AGIs $50k-75k, 83.3% for AGIs $75k-100k, 60.5% for AGIs over 100k)
Taxable interest for individuals: $807 (reported on 45.3% of returns)
This zip code:
$807
Pennsylvania:
$1,657
(% of AGI for various income ranges: 8.5% for AGIs below $10k, 1.4% for AGIs $10k-25k, 2.0% for AGIs $25k-50k, 0.4% for AGIs $50k-75k, 0.1% for AGIs $75k-100k, 0.6% for AGIs over 100k)
Taxable dividends: $889 (reported on 19.3% of returns)
Here:
$889
State:
$3,566
(% of AGI for various income ranges: 2.0% for AGIs below $10k, 0.6% for AGIs $10k-25k, 0.8% for AGIs $25k-50k, 0.6% for AGIs $50k-75k, 0.1% for AGIs $75k-100k)
Net capital gain/loss: +$3,524 (reported on 12.3% of returns)
Here:
+$3,524
State:
+$9,716
(% of AGI for various income ranges: 0.8% for AGIs below $10k, 0.5% for AGIs $10k-25k, 0.3% for AGIs $25k-50k, 3.8% for AGIs $50k-75k)
Profit/loss from business: +$6,000 (reported on 14.4% of returns)
Here:
+$6,000
State:
+$14,267
(% of AGI for various income ranges: -3.6% for AGIs below $10k, 9.4% for AGIs $10k-25k, 4.1% for AGIs $25k-50k, 0.2% for AGIs $50k-75k)
IRA payment deduction: $2,467 (reported on 2.9% of returns)
17774:
$2,467
Pennsylvania:
$2,903
Total itemized deductions: $12,938 (20% of AGI, reported on 18.7% of returns)
Here:
$12,938
State:
$18,804
Here:
20.0% of AGI
State:
19.5% of AGI
(% of AGI for various income ranges: 4.8% for AGIs $10k-25k, 5.2% for AGIs $25k-50k, 9.4% for AGIs $50k-75k, 10.5% for AGIs $75k-100k, 8.9% for AGIs over 100k)
Charity contributions deductions: $1,613 (2% of AGI, reported on 14.6% of returns)
Here:
$1,613
State:
$3,337
Here:
2.3% of AGI
State:
3.3% of AGI
(% of AGI for various income ranges: 0.5% for AGIs $25k-50k, 1.2% for AGIs $50k-75k, 0.2% for AGIs $75k-100k, 1.6% for AGIs over 100k)
Total tax: $3,853 (reported on 72.8% of returns)
17774:
$3,853
State:
$8,008
(% of AGI for various income ranges: 4.4% for AGIs below $10k, 4.8% for AGIs $10k-25k, 6.2% for AGIs $25k-50k, 8.3% for AGIs $50k-75k, 11.9% for AGIs $75k-100k, 17.4% for AGIs over 100k)
Earned income credit: $1,587 (reported on 17.9% of returns)
Here:
$1,587
State:
$1,643
Percentage of individuals using paid preparers for their 2004 taxes: 64.8%
Here:
65%
State:
56%
(% for various income ranges: 64.4% for AGIs below $10k, 70.4% for AGIs $10k-25k, 57.9% for AGIs $25k-50k, 61.9% for AGIs $50k-75k, 68.2% for AGIs $75k-100k, 91.7% for AGIs over 100k)
Likely homosexual households (counted as self-reported same-sex unmarried-partner households)
Lesbian couples: 0.7% of all households
Gay men: 0.0% of all households
Household received Food Stamps/SNAP in the past 12 months: 59 Household did not receive Food Stamps/SNAP in the past 12 months: 340
Women who had a birth in the past 12 months: 6 (6 now married, 0 unmarried) Women who did not have a birth in the past 12 months: 225 (94 now married, 131 unmarried)
Housing units in zip code 17774 with a mortgage: 170 (48 second mortgage, 39 both second mortgage and home equity loan) Houses without a mortgage: 43
Median monthly owner costs for units with a mortgage: $1,282 Median monthly owner costs for units without a mortgage: $496
Residents with income below the poverty level in 2022:
This zip code:
11.4%
Whole state:
11.8%
Residents with income below 50% of the poverty level in 2022:
This zip code:
9.1%
Whole state:
6.1%
Median number of rooms in houses and condos:
Here:
6.3
State:
6.8
Median number of rooms in apartments:
Here:
7.2
State:
4.3
Notable locations in this zip code not listed on our city pages
Churches in zip code 17774 include: Germany Church (A), Franklin Church (B), Saint Johns Church (C), Salem Church (D), Fairview Church (E), Pine Summit Church (F). Display/hide their locations on the map
Streams, rivers, and creeks: West Creek (A), West Branch Little Muncy Creek (B), Little Indian Run (C), Buck Run (D). Display/hide their locations on the map
Size of family households: 122 2-persons, 83 3-persons, 36 4-persons, 31 5-persons, 15 6-persons
Size of nonfamily households: 78 1-person, 21 2-persons, 8 3-persons
138 married couples with children.
30 single-parent households (3 men, 27 women).
99.1% of residents of 17774 zip code speak English at home.
0.2% of residents speak Spanish at home (100% very well).
0.1% of residents speak Asian or Pacific Island language at home (100% well).
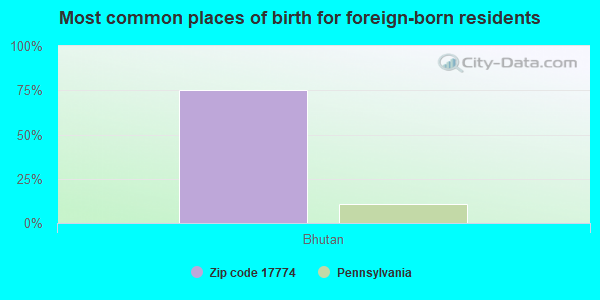
Foreign born population: 4 (0.4%) (0.0% of them are naturalized citizens)
:
0.4%
Whole state:
7.5%
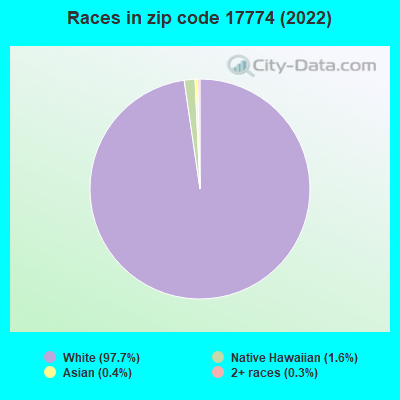
75%Bhutan
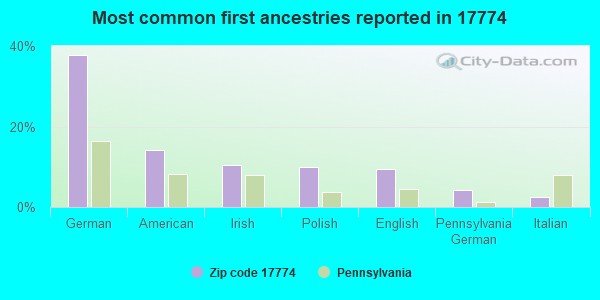
38%German
14%American
11%Irish
10%Polish
9%English
4%Pennsylvania German
2%Italian
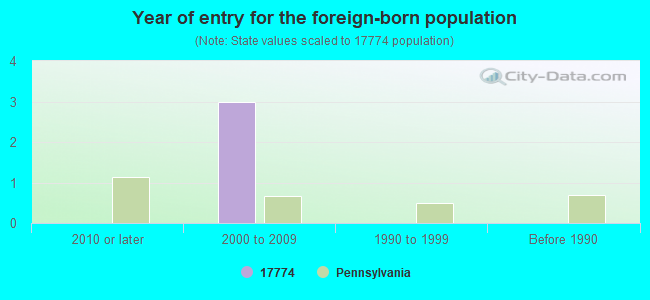
Year of entry for the foreign-born population
02010 or later
32000 to 2009
01990 to 1999
0Before 1990
Facilities with environmental interests located in this zip code:
BOMBOY, FRANK (944 BOMBOY BOULEVARD ROAD in UNITYVILLE, PA)
National Pollutant Discharge Elimination System NON-MAJOR (Tracking pollutant discharge elimination systems) - permit Business SIC classification: OPERATORS OF DWELLINGS OTHER THAN APARTMENT BUILDINGS Alternative names: FRANK BOMBOY
Housing units lacking complete plumbing facilities: 3.7% Housing units lacking complete kitchen facilities: 5.8%
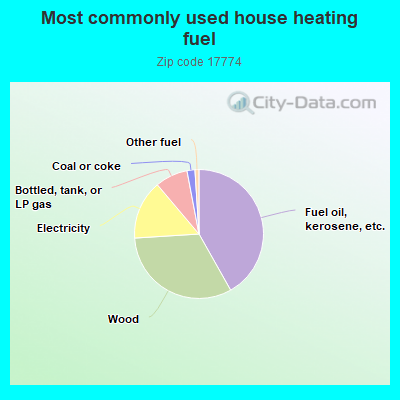
42.0%Fuel oil, kerosene, etc.
32.3%Wood
14.9%Electricity
8.2%Bottled, tank, or LP gas
2.0%Coal or coke
1.0%Other fuel
Population in 1990: 871. Population change in the 1990s: +271 (+31.1%).
Place of birth for U.S.-born residents:
This state: 915
Northeast: 64
Midwest: 2
South: 49
West: 6
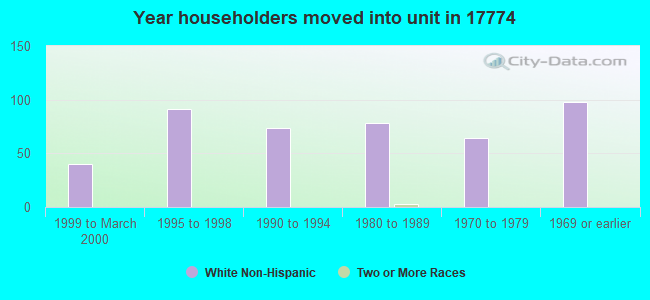
72% of the 17774 zip code residents lived in the same house 5 years ago. Out of people who lived in different houses, 61% lived in this county. Out of people who lived in different counties, 50% lived in Pennsylvania.
96% of the 17774 zip code residents lived in the same house 1 year ago. Out of people who lived in different houses, 41% moved from this county. Out of people who lived in different houses, 19% moved from different county within same state. Out of people who lived in different houses, 41% moved from different state.
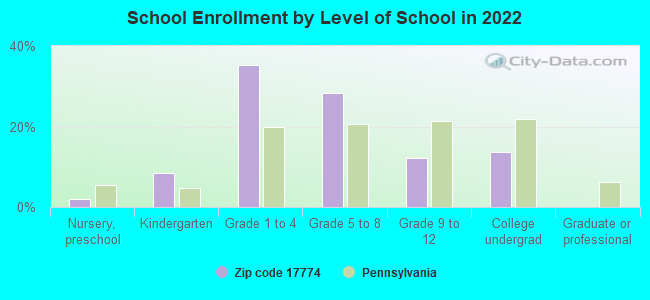
Private vs. public school enrollment:
Students in private schools in grades 1 to 8 (elementary and middle school):
Here:
0.0%
Pennsylvania:
15.7%
Students in private schools in grades 9 to 12 (high school): 2
Here:
12.0%
Pennsylvania:
13.4%
Students in private undergraduate colleges: 8
Here:
33.2%
Pennsylvania:
39.8%
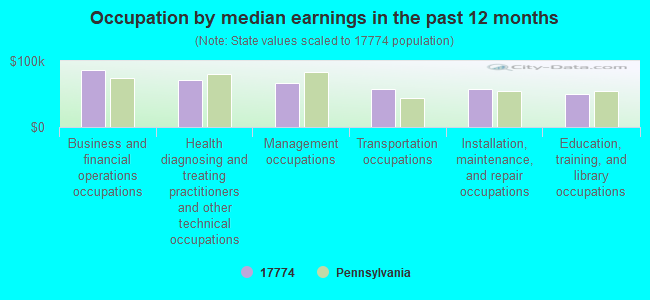
Occupation by median earnings in the past 12 months ($)
85,714Business and financial operations occupations
70,877Health diagnosing and treating practitioners and other technical occupations
66,588Management occupations
58,222Transportation occupations
57,673Installation, maintenance, and repair occupations
50,560Education, training, and library occupations
Top industries in this zip code by the number of employees in 2005:
Accommodation and Food Services: Full-Service Restaurants (10-19 employees: 1 establishment)
Construction: Power and Communication Line and Related Structures Construction (10-19: 1)
Construction: Drywall and Insulation Contractors (10-19: 1)
Construction: Poured Concrete Foundation and Structure Contractors (1-4: 1)
Construction: Site Preparation Contractors (1-4: 1)
Fatal accident statistics in 2014:
Fatal accident count: 1
Vehicles involved in fatal accidents: 2
Fatal accidents caused by drunken drivers: 1
Fatalities: 1
Persons involved in fatal accidents: 2
Pedestrians involved in fatal accidents: 0
Fatal accident statistics in 2013:
Fatal accident count: 1
Vehicles involved in fatal accidents: 1
Fatal accidents caused by drunken drivers: 1
Fatalities: 1
Persons involved in fatal accidents: 1
Pedestrians involved in fatal accidents: 0
Home Mortgage Disclosure Act Aggregated Statistics For Year 2009 (Based on 2 partial tracts)
A) FHA, FSA/RHS & VA Home Purchase Loans
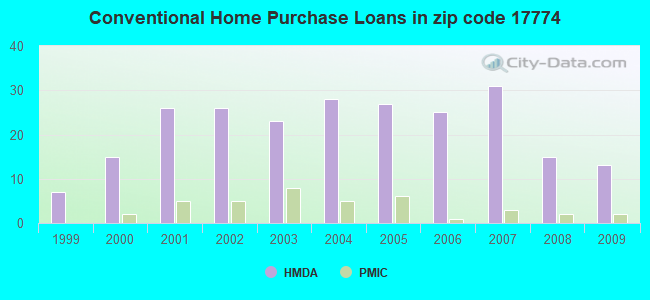
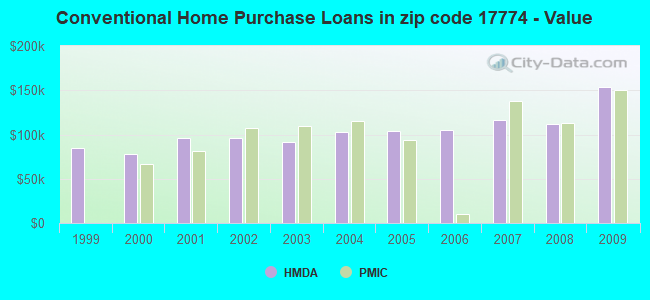
B) Conventional Home Purchase Loans
C) Refinancings
D) Home Improvement Loans
F) Non-occupant Loans on < 5 Family Dwellings (A B C & D)
G) Loans On Manufactured Home Dwelling (A B C & D)
Number
Average Value
Number
Average Value
Number
Average Value
Number
Average Value
Number
Average Value
Number
Average Value
LOANS ORIGINATED
2
$112,305
13
$153,367
45
$141,909
5
$57,536
4
$311,142
7
$105,344
APPLICATIONS APPROVED, NOT ACCEPTED
0
$0
0
$0
2
$135,635
0
$0
1
$133,330
0
$0
APPLICATIONS DENIED
1
$87,690
4
$89,740
17
$125,847
3
$47,177
3
$121,877
1
$52,310
APPLICATIONS WITHDRAWN
0
$0
1
$65,640
15
$142,524
1
$23,080
1
$40,000
1
$124,100
FILES CLOSED FOR INCOMPLETENESS
0
$0
0
$0
1
$145,640
0
$0
0
$0
0
$0
Aggregated Statistics For Year 2008 (Based on 2 partial tracts)
A) FHA, FSA/RHS & VA Home Purchase Loans
B) Conventional Home Purchase Loans
C) Refinancings
D) Home Improvement Loans
F) Non-occupant Loans on < 5 Family Dwellings (A B C & D)
G) Loans On Manufactured Home Dwelling (A B C & D)
Number
Average Value
Number
Average Value
Number
Average Value
Number
Average Value
Number
Average Value
Number
Average Value
LOANS ORIGINATED
1
$126,660
15
$111,619
27
$92,190
12
$34,358
5
$95,484
7
$63,880
APPLICATIONS APPROVED, NOT ACCEPTED
1
$116,920
1
$95,890
3
$90,767
2
$25,385
0
$0
0
$0
APPLICATIONS DENIED
1
$77,430
4
$93,842
29
$122,966
4
$55,510
1
$101,530
2
$99,485
APPLICATIONS WITHDRAWN
0
$0
0
$0
9
$122,617
1
$80,510
0
$0
1
$33,330
FILES CLOSED FOR INCOMPLETENESS
0
$0
1
$14,360
2
$107,690
0
$0
1
$14,360
0
$0
Aggregated Statistics For Year 2007 (Based on 2 partial tracts)
A) FHA, FSA/RHS & VA Home Purchase Loans
B) Conventional Home Purchase Loans
C) Refinancings
D) Home Improvement Loans
F) Non-occupant Loans on < 5 Family Dwellings (A B C & D)
G) Loans On Manufactured Home Dwelling (A B C & D)
Number
Average Value
Number
Average Value
Number
Average Value
Number
Average Value
Number
Average Value
Number
Average Value
LOANS ORIGINATED
1
$138,460
31
$115,992
37
$100,453
18
$27,691
6
$115,380
10
$65,382
APPLICATIONS APPROVED, NOT ACCEPTED
1
$45,640
3
$75,723
4
$73,458
3
$21,197
0
$0
1
$18,460
APPLICATIONS DENIED
1
$73,330
3
$138,970
29
$98,882
8
$31,858
2
$92,815
3
$64,613
APPLICATIONS WITHDRAWN
0
$0
2
$134,355
16
$111,278
1
$96,920
0
$0
0
$0
FILES CLOSED FOR INCOMPLETENESS
0
$0
1
$74,870
3
$112,987
0
$0
1
$96,410
0
$0
Aggregated Statistics For Year 2006 (Based on 2 partial tracts)
A) FHA, FSA/RHS & VA Home Purchase Loans
B) Conventional Home Purchase Loans
C) Refinancings
D) Home Improvement Loans
F) Non-occupant Loans on < 5 Family Dwellings (A B C & D)
G) Loans On Manufactured Home Dwelling (A B C & D)
Number
Average Value
Number
Average Value
Number
Average Value
Number
Average Value
Number
Average Value
Number
Average Value
LOANS ORIGINATED
1
$70,250
25
$104,714
54
$89,816
24
$33,247
4
$126,405
11
$54,124
APPLICATIONS APPROVED, NOT ACCEPTED
0
$0
2
$76,665
10
$92,509
3
$26,493
1
$45,130
1
$121,020
APPLICATIONS DENIED
0
$0
11
$75,848
54
$100,946
4
$49,612
3
$59,143
5
$64,716
APPLICATIONS WITHDRAWN
1
$35,900
3
$82,903
25
$102,355
1
$92,300
0
$0
2
$62,820
FILES CLOSED FOR INCOMPLETENESS
0
$0
1
$66,660
5
$100,816
1
$7,690
0
$0
0
$0
Aggregated Statistics For Year 2005 (Based on 2 partial tracts)
A) FHA, FSA/RHS & VA Home Purchase Loans
B) Conventional Home Purchase Loans
C) Refinancings
D) Home Improvement Loans
F) Non-occupant Loans on < 5 Family Dwellings (A B C & D)
G) Loans On Manufactured Home Dwelling (A B C & D)
Number
Average Value
Number
Average Value
Number
Average Value
Number
Average Value
Number
Average Value
Number
Average Value
LOANS ORIGINATED
1
$134,350
27
$104,364
55
$94,896
15
$33,332
8
$70,830
6
$64,100
APPLICATIONS APPROVED, NOT ACCEPTED
1
$21,540
4
$120,380
10
$102,098
1
$8,720
0
$0
1
$41,020
APPLICATIONS DENIED
0
$0
8
$58,139
61
$107,327
12
$50,340
2
$77,690
8
$46,858
APPLICATIONS WITHDRAWN
0
$0
4
$156,405
23
$132,860
3
$62,220
1
$94,870
0
$0
FILES CLOSED FOR INCOMPLETENESS
0
$0
1
$36,920
2
$156,150
0
$0
0
$0
0
$0
Aggregated Statistics For Year 2004 (Based on 2 partial tracts)
A) FHA, FSA/RHS & VA Home Purchase Loans
B) Conventional Home Purchase Loans
C) Refinancings
D) Home Improvement Loans
F) Non-occupant Loans on < 5 Family Dwellings (A B C & D)
G) Loans On Manufactured Home Dwelling (A B C & D)
Number
Average Value
Number
Average Value
Number
Average Value
Number
Average Value
Number
Average Value
Number
Average Value
LOANS ORIGINATED
2
$107,945
28
$102,395
73
$89,965
21
$31,769
7
$96,187
8
$65,446
APPLICATIONS APPROVED, NOT ACCEPTED
0
$0
1
$109,230
16
$80,670
4
$22,178
1
$36,410
1
$17,950
APPLICATIONS DENIED
0
$0
7
$98,824
62
$85,613
10
$55,126
3
$69,227
3
$70,597
APPLICATIONS WITHDRAWN
0
$0
5
$115,380
28
$109,996
2
$22,050
1
$322,550
2
$51,535
FILES CLOSED FOR INCOMPLETENESS
0
$0
2
$75,640
6
$102,475
0
$0
1
$36,410
0
$0
Aggregated Statistics For Year 2003 (Based on 2 partial tracts)
A) FHA, FSA/RHS & VA Home Purchase Loans
B) Conventional Home Purchase Loans
C) Refinancings
D) Home Improvement Loans
F) Non-occupant Loans on < 5 Family Dwellings (A B C & D)
Number
Average Value
Number
Average Value
Number
Average Value
Number
Average Value
Number
Average Value
LOANS ORIGINATED
2
$61,535
23
$91,323
96
$86,214
15
$31,623
5
$88,714
APPLICATIONS APPROVED, NOT ACCEPTED
0
$0
0
$0
12
$80,039
1
$12,820
0
$0
APPLICATIONS DENIED
0
$0
7
$55,969
43
$81,953
6
$46,408
3
$39,657
APPLICATIONS WITHDRAWN
1
$35,380
5
$100,714
34
$95,637
1
$15,380
1
$30,770
FILES CLOSED FOR INCOMPLETENESS
1
$37,950
1
$56,920
4
$113,585
1
$10,260
0
$0
Aggregated Statistics For Year 2002 (Based on 2 partial tracts)
A) FHA, FSA/RHS & VA Home Purchase Loans
B) Conventional Home Purchase Loans
C) Refinancings
D) Home Improvement Loans
F) Non-occupant Loans on < 5 Family Dwellings (A B C & D)
Number
Average Value
Number
Average Value
Number
Average Value
Number
Average Value
Number
Average Value
LOANS ORIGINATED
2
$82,560
26
$95,578
58
$91,040
11
$22,330
5
$89,330
APPLICATIONS APPROVED, NOT ACCEPTED
0
$0
4
$91,920
11
$63,121
1
$33,330
2
$119,740
APPLICATIONS DENIED
1
$30,770
9
$78,914
36
$81,492
4
$8,078
3
$69,227
APPLICATIONS WITHDRAWN
0
$0
6
$89,825
14
$90,729
1
$14,360
1
$51,280
FILES CLOSED FOR INCOMPLETENESS
0
$0
0
$0
3
$49,057
0
$0
0
$0
Aggregated Statistics For Year 2001 (Based on 2 partial tracts)
A) FHA, FSA/RHS & VA Home Purchase Loans
B) Conventional Home Purchase Loans
C) Refinancings
D) Home Improvement Loans
F) Non-occupant Loans on < 5 Family Dwellings (A B C & D)
Number
Average Value
Number
Average Value
Number
Average Value
Number
Average Value
Number
Average Value
LOANS ORIGINATED
1
$49,740
26
$96,288
59
$77,615
17
$31,069
3
$62,220
APPLICATIONS APPROVED, NOT ACCEPTED
0
$0
1
$40,510
5
$70,664
3
$30,083
0
$0
APPLICATIONS DENIED
0
$0
8
$74,420
23
$81,334
3
$40,683
0
$0
APPLICATIONS WITHDRAWN
0
$0
1
$88,200
12
$84,826
1
$33,840
0
$0
FILES CLOSED FOR INCOMPLETENESS
0
$0
0
$0
4
$82,560
0
$0
0
$0
Aggregated Statistics For Year 2000 (Based on 2 partial tracts)
A) FHA, FSA/RHS & VA Home Purchase Loans
B) Conventional Home Purchase Loans
C) Refinancings
D) Home Improvement Loans
F) Non-occupant Loans on < 5 Family Dwellings (A B C & D)
Number
Average Value
Number
Average Value
Number
Average Value
Number
Average Value
Number
Average Value
LOANS ORIGINATED
2
$90,510
15
$78,424
22
$54,473
18
$25,668
4
$41,665
APPLICATIONS APPROVED, NOT ACCEPTED
1
$45,130
2
$44,870
6
$66,835
3
$35,553
0
$0
APPLICATIONS DENIED
1
$43,590
12
$46,280
23
$59,017
5
$12,308
1
$76,920
APPLICATIONS WITHDRAWN
0
$0
3
$67,860
8
$62,369
2
$21,280
0
$0
FILES CLOSED FOR INCOMPLETENESS
0
$0
0
$0
3
$81,023
0
$0
0
$0
Aggregated Statistics For Year 1999 (Based on 1 partial tract)
A) FHA, FSA/RHS & VA Home Purchase Loans
B) Conventional Home Purchase Loans
C) Refinancings
D) Home Improvement Loans
F) Non-occupant Loans on < 5 Family Dwellings (A B C & D)

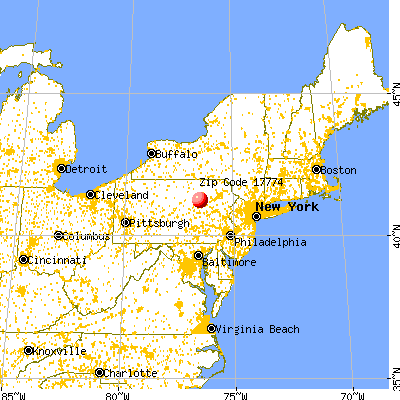


 Nearest zip codes: 17758, 17742, 18626, 17846, 17737, 17731.