Estimated zip code population in 2022: 3,493 Zip code population in 2010: 3,565 Zip code population in 2000: 3,494
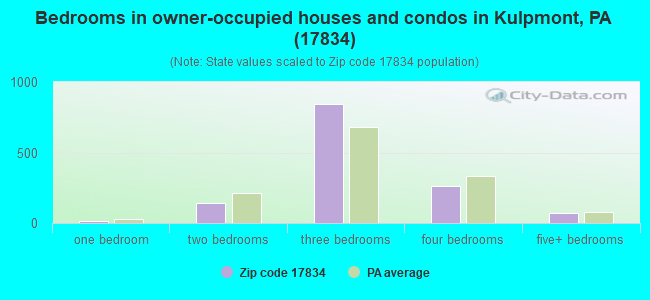
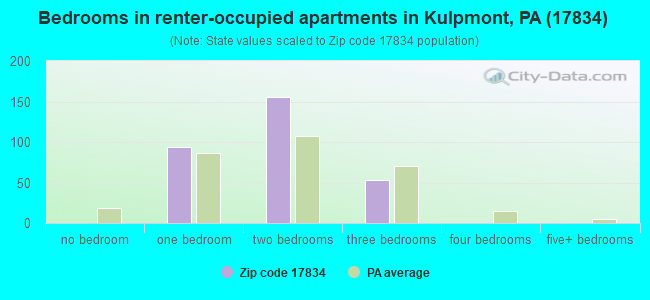
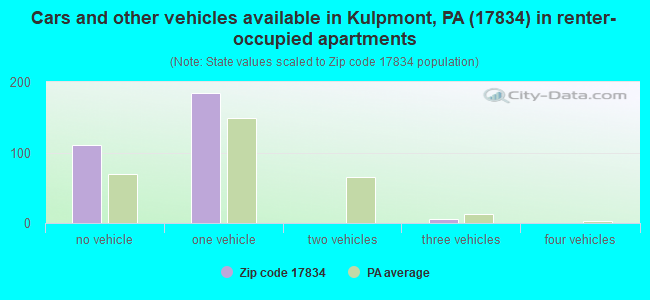
Houses and condos: 1,797 Renter-occupied apartments: 302
% of renters here:
18%
State:
31%
March 2022 cost of living index in zip code 17834: 82.0 (low, U.S. average is 100)
Land area: 5.1 sq. mi. Water area: 0.0 sq. mi.
Population density: 680 people per square mile
(low).
OSM Map
General Map
Google Map
MSN Map
OSM Map
General Map
Google Map
MSN Map
OSM Map
General Map
Google Map
MSN Map
OSM Map
General Map
Google Map
MSN Map
Please wait while loading the map...
Real estate property taxes paid for housing units in 2022:
This zip code:
1.4% ($1,297)
Pennsylvania:
1.3% ($3,094)
Median real estate property taxes paid for housing units with mortgages in 2022: $1,372 (1.1%) Median real estate property taxes paid for housing units with no mortgage in 2022: $1,187 (1.3%)
Business Search- 14 Million verified businesses
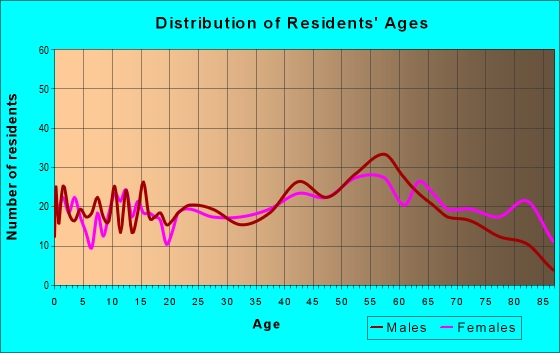
Males: 1,884
(54.0%)
Females: 1,608
(46.0%)
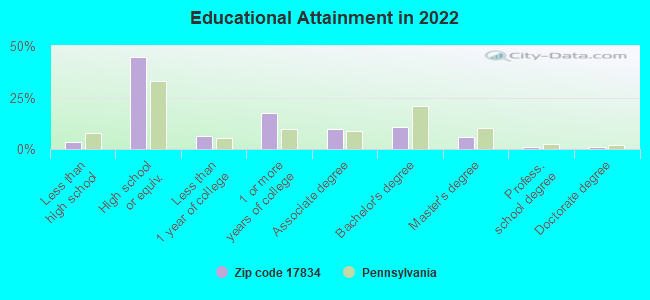
For population 25 years and over in 17834:
High school or higher: 95.7%
Bachelor's degree or higher: 18.2%
Graduate or professional degree: 7.5%
Unemployed: 3.0%
Mean travel time to work (commute): 32.2 minutes
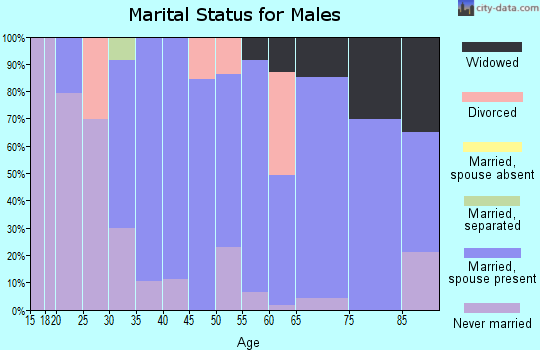
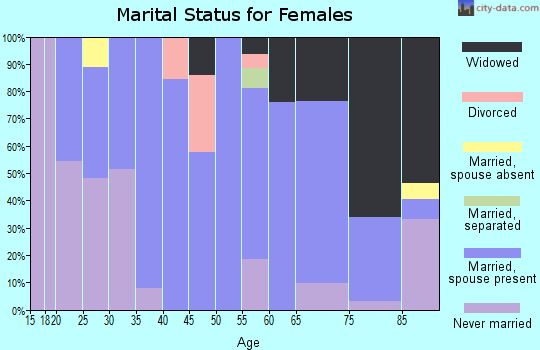
For population 15 years and over in 17834:
Never married: 32.1%
Now married: 49.3%
Separated: 1.6%
Widowed: 9.8%
Divorced: 7.2%
Zip code 17834 compared to state average:
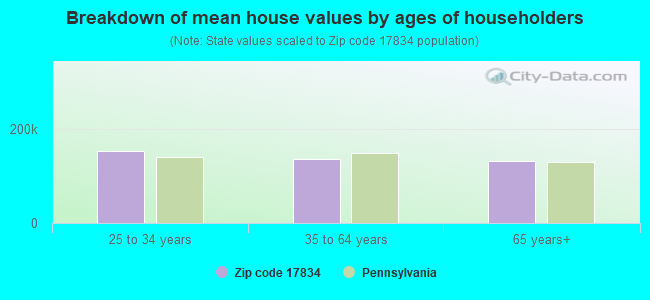
Median house value significantly below state average.
Black race population percentage significantly below state average.
Median age significantly above state average.
Foreign-born population percentage significantly below state average.
Renting percentage below state average.
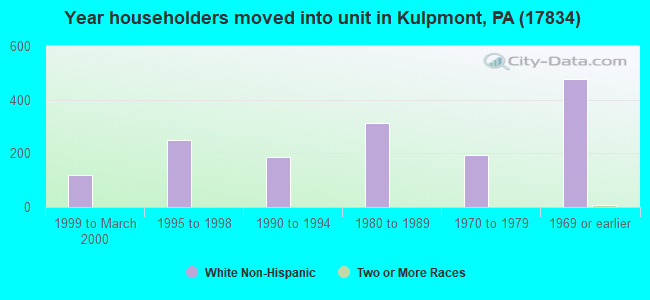
Length of stay since moving in significantly above state average.
Percentage of population with a bachelor's degree or higher below state average.
Estimated median house/condo value in 2022: $93,989
17834:
$93,989
Pennsylvania:
$245,500
According to our research of Pennsylvania and other state lists, there were 5 registered sex offenders living in 17834 zip code as of April 27, 2024. The ratio of all residents to sex offenders in zip code 17834 is 741 to 1. The ratio of registered sex offenders to all residents in this zip code is lower than the state average.
Median resident age:
This zip code:
50.1 years
Pennsylvania median age:
40.9 years
Average household size:
This zip code:
2.1 people
Pennsylvania:
2.4 people
Averages for the 2020 tax year for zip code 17834, filed in 2021:
Average Adjusted Gross Income (AGI) in 2020: $52,919 (Individual Income Tax Returns)
Here:
$52,919
State:
$75,707
Salary/wage: $45,878 (reported on 77.1% of returns)
Here:
$45,878
State:
$62,806
(% of AGI for various income ranges: 998.9% for AGIs below $25k, 3264.3% for AGIs $25k-50k, 5757.9% for AGIs $50k-75k, 8015.5% for AGIs $75k-100k, 13839.2% for AGIs $100k-200k)
Taxable interest for individuals: $1,200 (reported on 29.5% of returns)
This zip code:
$1,200
Pennsylvania:
$1,633
(% of AGI for various income ranges: 12.4% for AGIs below $25k, 55.4% for AGIs $25k-50k, 42.1% for AGIs $50k-75k, 133.6% for AGIs $75k-100k, 58.5% for AGIs $100k-200k)
Ordinary dividends: $2,414 (reported on 21.1% of returns)
Here:
$2,414
State:
$7,382
(% of AGI for various income ranges: 33.2% for AGIs below $25k, 52.7% for AGIs $25k-50k, 64.7% for AGIs $50k-75k, 171.8% for AGIs $75k-100k, 88.5% for AGIs $100k-200k)
Net capital gain/loss in AGI: +$7,683 (reported on 14.5% of returns)
Here:
+$7,683
State:
+$23,522
(% of AGI for various income ranges: 2.4% for AGIs below $25k, 30.8% for AGIs $25k-50k, 40.0% for AGIs $50k-75k, 64.5% for AGIs $75k-100k, 173.8% for AGIs $100k-200k)
Profit/loss from business: +$12,083 (reported on 7.2% of returns)
Here:
+$12,083
State:
+$16,274
(% of AGI for various income ranges: 52.4% for AGIs below $25k, 85.7% for AGIs $25k-50k, 167.9% for AGIs $50k-75k, 473.1% for AGIs $100k-200k)
Taxable individual retirement arrangement distribution: $10,610 (reported on 12.7% of returns)
17834:
$10,610
Pennsylvania:
$18,583
(% of AGI for various income ranges: 81.8% for AGIs below $25k, 121.9% for AGIs $25k-50k, 237.4% for AGIs $50k-75k, 341.8% for AGIs $75k-100k, 491.5% for AGIs $100k-200k)
Total itemized deductions: $31,467 (reported on 1.8% of returns)
Here:
$31,467
State:
$34,850
(% of AGI for various income ranges: 496.8% for AGIs $50k-75k)
Taxes paid: $5,533 (reported on 1.8% of returns)
17834:
$5,533
State:
$8,200
(% of AGI for various income ranges: 87.4% for AGIs $50k-75k)
Earned income credit: $2,004 (reported on 15.1% of returns)
Here:
$2,004
State:
$2,100
(% of AGI for various income ranges: 78.7% for AGIs below $25k, 54.6% for AGIs $25k-50k)
Percentage of individuals using paid preparers for their 2020 taxes: 92.2%
Here:
92%
State:
92%
(% for various income ranges: 92.9% for AGIs below $25k, 93.5% for AGIs $25k-50k, 88.5% for AGIs $50k-75k, 93.8% for AGIs $75k-100k, 89.5% for AGIs $100k-200k, 100.0% for AGIs over 200k)
Averages for the 2012 tax year for zip code 17834, filed in 2013:
Average Adjusted Gross Income (AGI) in 2012: $41,963 (Individual Income Tax Returns)
Here:
$41,963
State:
$61,346
Salary/wage: $38,246 (reported on 79.3% of returns)
Here:
$38,246
State:
$51,902
(% of AGI for various income ranges: 57.5% for AGIs below $25k, 70.8% for AGIs $25k-50k, 77.4% for AGIs $50k-75k, 73.6% for AGIs $75k-100k, 74.7% for AGIs $100k-200k)
Taxable interest for individuals: $1,250 (reported on 36.6% of returns)
This zip code:
$1,250
Pennsylvania:
$1,588
(% of AGI for various income ranges: 2.3% for AGIs below $25k, 1.0% for AGIs $25k-50k, 0.8% for AGIs $50k-75k, 1.0% for AGIs $75k-100k, 1.0% for AGIs $100k-200k)
Ordinary dividends: $1,943 (reported on 25.6% of returns)
Here:
$1,943
State:
$5,827
(% of AGI for various income ranges: 2.8% for AGIs below $25k, 1.4% for AGIs $25k-50k, 0.8% for AGIs $50k-75k, 1.0% for AGIs $75k-100k, 0.8% for AGIs $100k-200k)
Net capital gain/loss in AGI: +$558 (reported on 11.6% of returns)
Here:
+$558
State:
+$14,495
(% of AGI for various income ranges: 0.2% for AGIs $75k-100k, 0.6% for AGIs $100k-200k)
Profit/loss from business: +$10,519 (reported on 9.8% of returns)
Here:
+$10,519
State:
+$16,268
(% of AGI for various income ranges: 5.4% for AGIs below $25k, 2.8% for AGIs $25k-50k, 2.6% for AGIs $50k-75k, 3.6% for AGIs $75k-100k)
Taxable individual retirement arrangement distribution: $10,679 (reported on 11.6% of returns)
17834:
$10,679
Pennsylvania:
$14,550
(% of AGI for various income ranges: 4.8% for AGIs below $25k, 3.1% for AGIs $25k-50k, 1.4% for AGIs $50k-75k, 8.0% for AGIs $75k-100k)
Total itemized deductions: $19,391 (23% of AGI, reported on 13.4% of returns)
Here:
$19,391
State:
$23,538
Here:
23.0% of AGI
State:
18.4% of AGI
(% of AGI for various income ranges: 7.1% for AGIs below $25k, 3.8% for AGIs $25k-50k, 5.2% for AGIs $50k-75k, 5.9% for AGIs $75k-100k, 8.7% for AGIs $100k-200k)
Charity contributions: $2,112 (reported on 9.8% of returns)
Here:
$2,112
State:
$4,025
(% of AGI for various income ranges: 0.7% for AGIs $25k-50k, 0.3% for AGIs $50k-75k, 0.6% for AGIs $75k-100k, 0.7% for AGIs $100k-200k)
Taxes paid: $5,186 (reported on 13.4% of returns)
17834:
$5,186
State:
$9,982
(% of AGI for various income ranges: 0.7% for AGIs below $25k, 0.8% for AGIs $25k-50k, 1.0% for AGIs $50k-75k, 1.6% for AGIs $75k-100k, 3.3% for AGIs $100k-200k)
Earned income credit: $1,769 (reported on 15.9% of returns)
Here:
$1,769
State:
$2,106
(% of AGI for various income ranges: 4.6% for AGIs below $25k, 0.6% for AGIs $25k-50k)
Percentage of individuals using paid preparers for their 2012 taxes: 60.4%
Here:
60%
State:
53%
(% for various income ranges: 54.9% for AGIs below $25k, 63.4% for AGIs $25k-50k, 62.5% for AGIs $50k-75k, 64.3% for AGIs $75k-100k, 71.4% for AGIs $100k-200k)
Averages for the 2004 tax year for zip code 17834, filed in 2005:
Average Adjusted Gross Income (AGI) in 2004: $33,898 (Individual Income Tax Returns)
Here:
$33,898
State:
$48,049
Salary/wage: $32,695 (reported on 81.1% of returns)
Here:
$32,695
State:
$42,646
(% of AGI for various income ranges: 81.2% for AGIs below $10k, 66.3% for AGIs $10k-25k, 79.5% for AGIs $25k-50k, 81.7% for AGIs $50k-75k, 85.8% for AGIs $75k-100k, 71.2% for AGIs over 100k)
Taxable interest for individuals: $1,197 (reported on 48.0% of returns)
This zip code:
$1,197
Pennsylvania:
$1,657
(% of AGI for various income ranges: 7.4% for AGIs below $10k, 3.2% for AGIs $10k-25k, 1.7% for AGIs $25k-50k, 1.3% for AGIs $50k-75k, 0.9% for AGIs $75k-100k, 0.8% for AGIs over 100k)
Taxable dividends: $1,623 (reported on 28.8% of returns)
Here:
$1,623
State:
$3,566
(% of AGI for various income ranges: 4.4% for AGIs below $10k, 2.1% for AGIs $10k-25k, 0.9% for AGIs $25k-50k, 1.5% for AGIs $50k-75k, 0.4% for AGIs $75k-100k, 2.0% for AGIs over 100k)
Net capital gain/loss: +$3,498 (reported on 17.0% of returns)
Here:
+$3,498
State:
+$9,716
(% of AGI for various income ranges: -5.0% for AGIs below $10k, 0.9% for AGIs $10k-25k, 0.4% for AGIs $25k-50k, 0.2% for AGIs $50k-75k, -0.0% for AGIs $75k-100k, 11.1% for AGIs over 100k)
Profit/loss from business: +$9,686 (reported on 9.8% of returns)
Here:
+$9,686
State:
+$14,267
(% of AGI for various income ranges: 8.1% for AGIs below $10k, 3.7% for AGIs $10k-25k, 3.4% for AGIs $25k-50k, 3.6% for AGIs $50k-75k, 1.4% for AGIs $75k-100k)
IRA payment deduction: $2,683 (reported on 3.7% of returns)
17834:
$2,683
Pennsylvania:
$2,903
Total itemized deductions: $14,083 (21% of AGI, reported on 13.5% of returns)
Here:
$14,083
State:
$18,804
Here:
20.8% of AGI
State:
19.5% of AGI
(% of AGI for various income ranges: 5.0% for AGIs $10k-25k, 4.9% for AGIs $25k-50k, 5.5% for AGIs $50k-75k, 6.6% for AGIs $75k-100k, 7.3% for AGIs over 100k)
Charity contributions deductions: $1,636 (2% of AGI, reported on 11.4% of returns)
Here:
$1,636
State:
$3,337
Here:
2.3% of AGI
State:
3.3% of AGI
(% of AGI for various income ranges: 0.4% for AGIs $10k-25k, 0.3% for AGIs $25k-50k, 0.5% for AGIs $50k-75k, 0.8% for AGIs $75k-100k, 1.0% for AGIs over 100k)
Total tax: $4,299 (reported on 70.8% of returns)
17834:
$4,299
State:
$8,008
(% of AGI for various income ranges: 2.0% for AGIs below $10k, 4.1% for AGIs $10k-25k, 6.8% for AGIs $25k-50k, 9.0% for AGIs $50k-75k, 10.7% for AGIs $75k-100k, 16.6% for AGIs over 100k)
Earned income credit: $1,490 (reported on 12.3% of returns)
Here:
$1,490
State:
$1,643
Percentage of individuals using paid preparers for their 2004 taxes: 60.2%
Here:
60%
State:
56%
(% for various income ranges: 55.6% for AGIs below $10k, 62.1% for AGIs $10k-25k, 60.7% for AGIs $25k-50k, 61.3% for AGIs $50k-75k, 63.8% for AGIs $75k-100k, 63.0% for AGIs over 100k)
Household received Food Stamps/SNAP in the past 12 months: 161 Household did not receive Food Stamps/SNAP in the past 12 months: 1,477
Women who had a birth in the past 12 months: 55 (58 now married, 0 unmarried) Women who did not have a birth in the past 12 months: 501 (210 now married, 290 unmarried)
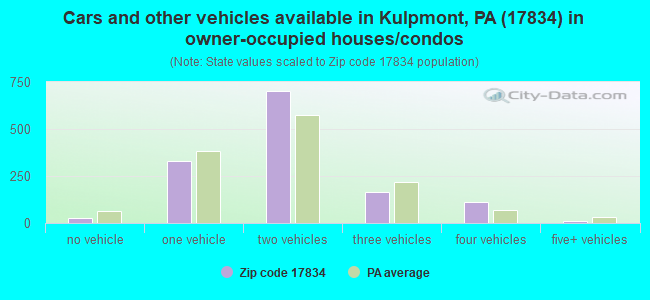
Housing units in zip code 17834 with a mortgage: 657 (60 second mortgage, 48 both second mortgage and home equity loan) Houses without a mortgage: 97
Median monthly owner costs for units with a mortgage: $1,153 Median monthly owner costs for units without a mortgage: $484
Residents with income below the poverty level in 2022:
This zip code:
7.3%
Whole state:
11.8%
Residents with income below 50% of the poverty level in 2022:
This zip code:
3.3%
Whole state:
6.1%
Median number of rooms in houses and condos:
Here:
6.8
State:
6.8
Median number of rooms in apartments:
Here:
4.3
State:
4.3
Notable locations in this zip code not listed on our city pages
In group quarters: 93 (-1 institutionalized population)
Size of family households: 532 2-persons, 234 3-persons, 89 4-persons, 101 5-persons, 9 6-persons
Size of nonfamily households: 579 1-person, 101 2-persons
393 married couples with children.
147 single-parent households (102 men, 45 women).
96.0% of residents of 17834 zip code speak English at home.
0.2% of residents speak Spanish at home (100% very well).
1.9% of residents speak other Indo-European language at home (68% very well, 32% not well).
1.5% of residents speak Asian or Pacific Island language at home (100% very well).
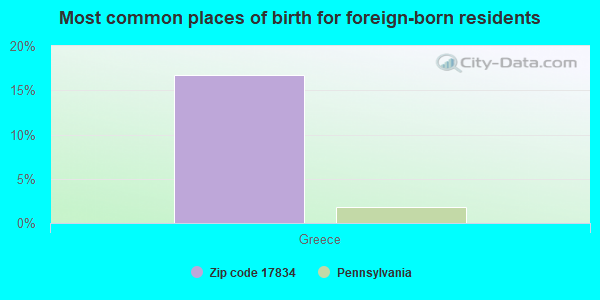
Foreign born population: 65 (1.9%) (24.2% of them are naturalized citizens)
This zip code:
1.9%
Whole state:
7.5%
17%Greece
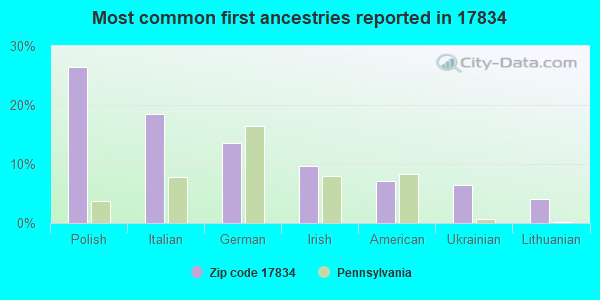
26%Polish
18%Italian
13%German
10%Irish
7%American
7%Ukrainian
4%Lithuanian
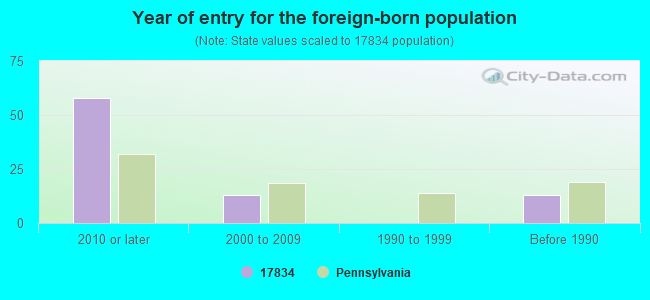
Year of entry for the foreign-born population
582010 or later
132000 to 2009
01990 to 1999
13Before 1990
Housing units lacking complete plumbing facilities: 2.4% Housing units lacking complete kitchen facilities: 2.5%
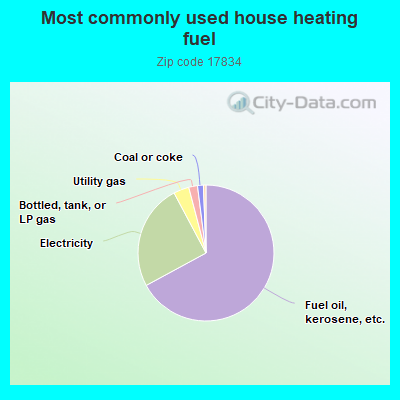
67.3%Fuel oil, kerosene, etc.
25.2%Electricity
3.7%Utility gas
2.1%Bottled, tank, or LP gas
1.4%Coal or coke
0.6%Wood
Population in 1990: 3,183. Population change in the 1990s: +311 (+9.8%).
Place of birth for U.S.-born residents:
This state: 2,976
Northeast: 301
Midwest: 48
South: 64
West: 1
78% of the 17834 zip code residents lived in the same house 5 years ago. Out of people who lived in different houses, 68% lived in this county. Out of people who lived in different counties, 50% lived in Pennsylvania.
95% of the 17834 zip code residents lived in the same house 1 year ago. Out of people who lived in different houses, 55% moved from this county. Out of people who lived in different houses, 48% moved from different county within same state.
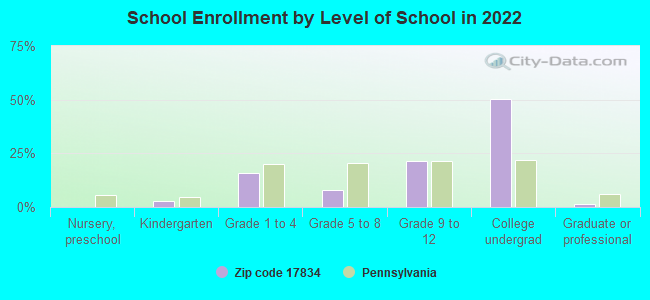
Private vs. public school enrollment:
Students in private schools in grades 1 to 8 (elementary and middle school): 14
Here:
10.5%
Pennsylvania:
15.7%
Students in private schools in grades 9 to 12 (high school):
Here:
0.0%
Pennsylvania:
13.4%
Students in private undergraduate colleges: 112
Here:
38.6%
Pennsylvania:
39.8%
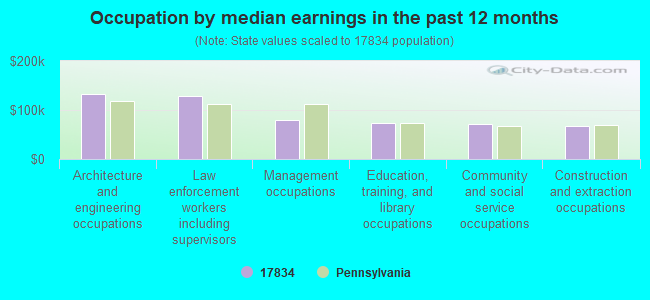
Occupation by median earnings in the past 12 months ($)
132,194Architecture and engineering occupations
127,640Law enforcement workers including supervisors
80,038Management occupations
74,184Education, training, and library occupations
71,144Community and social service occupations
67,185Construction and extraction occupations
Top industries in this zip code by the number of employees in 2005:
Health Care and Social Assistance: All Other Outpatient Care Centers (20-49 employees: 1 establishment)
Health Care and Social Assistance: Nursing Care Facilities (20-49: 1)
Health Care and Social Assistance: Offices of Dentists (10-19: 1)
Accommodation and Food Services: Full-Service Restaurants (10-19: 1)
Mining: Anthracite Mining (10-19: 1)
Health Care and Social Assistance: Homes for the Elderly (10-19: 1)
Professional, Scientific, and Technical Services: Payroll Services (10-19: 1)
Construction: Residential Remodelers (1-4: 4)
People in group quarters in 2010:
11 people in group homes intended for adults
People in group quarters in 2000:
16 people in other noninstitutional group quarters
2005 - 2018 National Fire Incident Reporting System (NFIRS) incidents
Based on the data from the years 2005 - 2018 the average number of fire incidents per year is 7. The highest number of reported fires - 18 took place in 2012, and the least - 1 in 2005. The data has an increasing trend.
When looking into fire subcategories, the most reports belonged to: Structure Fires (83.7%), and Outside Fires (10.6%).
Fire incident types reported to NFIRS in Zip Code 17834
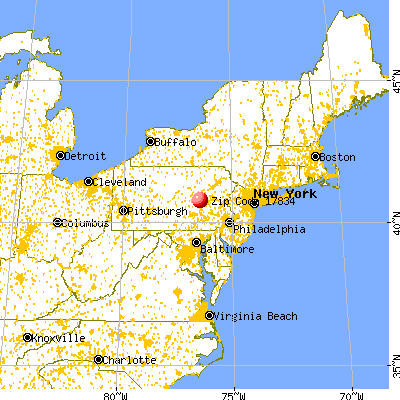


 Nearest zip codes: 17832, 17840, 17851, 17964, 17824, 17943.


 Based on the data from the years 2005 - 2018 the average number of fire incidents per year is 7. The highest number of reported fires - 18 took place in 2012, and the least - 1 in 2005. The data has an increasing trend.
 When looking into fire subcategories, the most reports belonged to: Structure Fires (83.7%), and Outside Fires (10.6%).