Estimated zip code population in 2022: 9,891 Zip code population in 2010: 10,310 Zip code population in 2000: 10,566
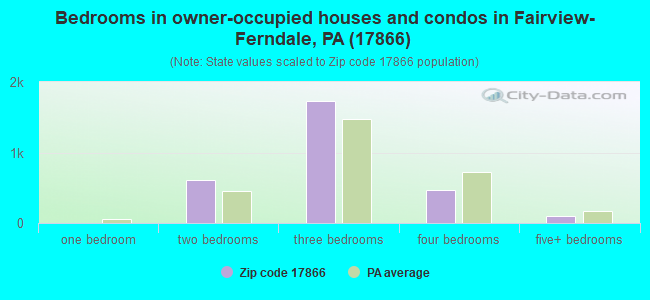
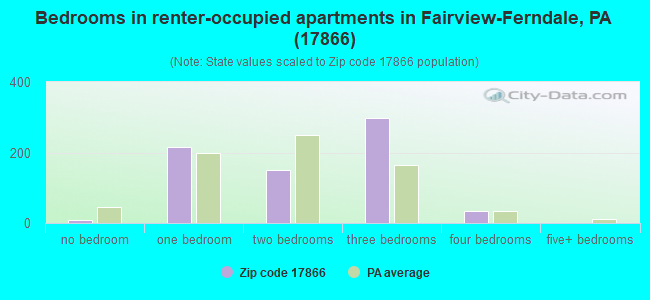
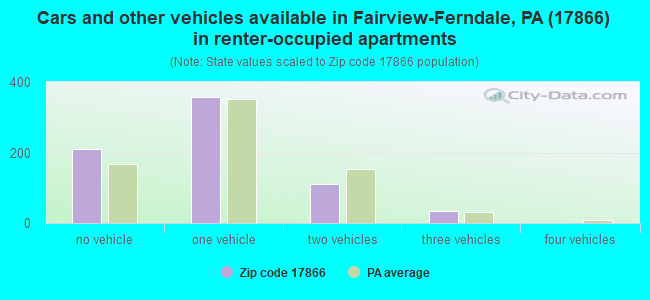
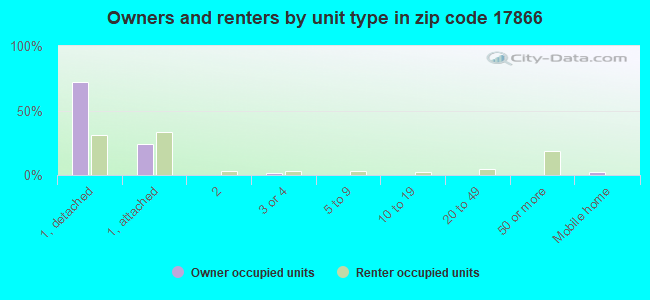
Houses and condos: 4,059 Renter-occupied apartments: 715
% of renters here:
20%
State:
31%
March 2022 cost of living index in zip code 17866: 82.0 (low, U.S. average is 100)
Land area: 25.1 sq. mi. Water area: 0.1 sq. mi.
Population density: 394 people per square mile
(very low).
OSM Map
General Map
Google Map
MSN Map
OSM Map
General Map
Google Map
MSN Map
OSM Map
General Map
Google Map
MSN Map
OSM Map
General Map
Google Map
MSN Map
Please wait while loading the map...
Real estate property taxes paid for housing units in 2022:
This zip code:
1.1% ($885)
Pennsylvania:
1.3% ($3,094)
Median real estate property taxes paid for housing units with mortgages in 2022: $812 (1.0%) Median real estate property taxes paid for housing units with no mortgage in 2022: $938 (1.2%)
Averages for the 2020 tax year for zip code 17866, filed in 2021:
Average Adjusted Gross Income (AGI) in 2020: $41,501 (Individual Income Tax Returns)
Here:
$41,501
State:
$75,707
Salary/wage: $40,196 (reported on 73.6% of returns)
Here:
$40,196
State:
$62,806
(% of AGI for various income ranges: 925.2% for AGIs below $25k, 3263.8% for AGIs $25k-50k, 5536.9% for AGIs $50k-75k, 8350.4% for AGIs $75k-100k, 14228.7% for AGIs $100k-200k)
Taxable interest for individuals: $433 (reported on 26.4% of returns)
This zip code:
$433
Pennsylvania:
$1,633
(% of AGI for various income ranges: 9.7% for AGIs below $25k, 10.2% for AGIs $25k-50k, 24.7% for AGIs $50k-75k, 15.2% for AGIs $75k-100k, 57.4% for AGIs $100k-200k)
Ordinary dividends: $3,196 (reported on 11.9% of returns)
Here:
$3,196
State:
$7,382
(% of AGI for various income ranges: 15.5% for AGIs below $25k, 17.3% for AGIs $25k-50k, 45.8% for AGIs $50k-75k, 58.0% for AGIs $75k-100k, 399.1% for AGIs $100k-200k)
Net capital gain/loss in AGI: +$7,933 (reported on 7.8% of returns)
Here:
+$7,933
State:
+$23,522
(% of AGI for various income ranges: 14.0% for AGIs $25k-50k, 28.4% for AGIs $50k-75k, 43.2% for AGIs $75k-100k, 976.1% for AGIs $100k-200k)
Profit/loss from business: +$8,350 (reported on 6.2% of returns)
Here:
+$8,350
State:
+$16,274
(% of AGI for various income ranges: 37.9% for AGIs below $25k, 54.8% for AGIs $25k-50k, 41.1% for AGIs $50k-75k, 467.0% for AGIs $100k-200k)
Taxable individual retirement arrangement distribution: $9,020 (reported on 8.3% of returns)
17866:
$9,020
Pennsylvania:
$18,583
(% of AGI for various income ranges: 56.9% for AGIs below $25k, 64.1% for AGIs $25k-50k, 139.3% for AGIs $50k-75k, 240.0% for AGIs $75k-100k, 310.9% for AGIs $100k-200k)
Total itemized deductions: $31,325 (reported on 1.0% of returns)
Here:
$31,325
State:
$34,850
(% of AGI for various income ranges: 501.2% for AGIs $75k-100k)
Charity contributions: $5,450 (reported on 0.5% of returns)
Here:
$5,450
State:
$12,392
(% of AGI for various income ranges: 24.2% for AGIs $50k-75k)
Taxes paid: $6,175 (reported on 1.0% of returns)
17866:
$6,175
State:
$8,200
(% of AGI for various income ranges: 98.8% for AGIs $75k-100k)
Earned income credit: $2,042 (reported on 15.2% of returns)
Here:
$2,042
State:
$2,100
(% of AGI for various income ranges: 75.9% for AGIs below $25k, 53.8% for AGIs $25k-50k)
Percentage of individuals using paid preparers for their 2020 taxes: 83.6%
Here:
84%
State:
92%
(% for various income ranges: 70.2% for AGIs below $25k, 94.9% for AGIs $25k-50k, 92.7% for AGIs $50k-75k, 93.8% for AGIs $75k-100k, 90.9% for AGIs $100k-200k, 100.0% for AGIs over 200k)
Averages for the 2012 tax year for zip code 17866, filed in 2013:
Average Adjusted Gross Income (AGI) in 2012: $36,537 (Individual Income Tax Returns)
Here:
$36,537
State:
$61,346
Salary/wage: $33,946 (reported on 82.3% of returns)
Here:
$33,946
State:
$51,902
(% of AGI for various income ranges: 68.2% for AGIs below $25k, 77.5% for AGIs $25k-50k, 76.8% for AGIs $50k-75k, 84.2% for AGIs $75k-100k, 73.2% for AGIs $100k-200k)
Taxable interest for individuals: $877 (reported on 25.9% of returns)
This zip code:
$877
Pennsylvania:
$1,588
(% of AGI for various income ranges: 1.3% for AGIs below $25k, 0.6% for AGIs $25k-50k, 0.6% for AGIs $50k-75k, 0.2% for AGIs $75k-100k, 0.6% for AGIs $100k-200k)
Ordinary dividends: $2,229 (reported on 15.6% of returns)
Here:
$2,229
State:
$5,827
(% of AGI for various income ranges: 1.0% for AGIs below $25k, 0.5% for AGIs $25k-50k, 0.9% for AGIs $50k-75k, 0.7% for AGIs $75k-100k, 2.0% for AGIs $100k-200k)
Net capital gain/loss in AGI: +$267 (reported on 7.9% of returns)
Here:
+$267
State:
+$14,495
(% of AGI for various income ranges: 0.2% for AGIs $50k-75k)
Profit/loss from business: +$8,789 (reported on 7.4% of returns)
Here:
+$8,789
State:
+$16,268
(% of AGI for various income ranges: 4.5% for AGIs below $25k, 1.6% for AGIs $25k-50k, 0.6% for AGIs $50k-75k, 3.2% for AGIs $75k-100k)
Taxable individual retirement arrangement distribution: $8,573 (reported on 9.8% of returns)
17866:
$8,573
Pennsylvania:
$14,550
(% of AGI for various income ranges: 3.0% for AGIs below $25k, 2.1% for AGIs $25k-50k, 2.7% for AGIs $50k-75k, 1.9% for AGIs $75k-100k, 1.9% for AGIs $100k-200k)
Total itemized deductions: $16,415 (20% of AGI, reported on 8.7% of returns)
Here:
$16,415
State:
$23,538
Here:
19.6% of AGI
State:
18.4% of AGI
(% of AGI for various income ranges: 1.3% for AGIs below $25k, 2.7% for AGIs $25k-50k, 3.6% for AGIs $50k-75k, 5.1% for AGIs $75k-100k, 7.2% for AGIs $100k-200k)
Charity contributions: $2,568 (reported on 5.8% of returns)
Here:
$2,568
State:
$4,025
(% of AGI for various income ranges: 0.3% for AGIs $25k-50k, 0.4% for AGIs $50k-75k, 0.3% for AGIs $75k-100k, 1.0% for AGIs $100k-200k)
Taxes paid: $7,009 (reported on 8.7% of returns)
17866:
$7,009
State:
$9,982
(% of AGI for various income ranges: 2.4% for AGIs $25k-50k, 0.9% for AGIs $50k-75k, 1.5% for AGIs $75k-100k, 3.0% for AGIs $100k-200k)
Earned income credit: $1,920 (reported on 18.8% of returns)
Here:
$1,920
State:
$2,106
(% of AGI for various income ranges: 5.1% for AGIs below $25k, 1.0% for AGIs $25k-50k)
Percentage of individuals using paid preparers for their 2012 taxes: 54.5%
Here:
54%
State:
53%
(% for various income ranges: 49.4% for AGIs below $25k, 54.1% for AGIs $25k-50k, 61.5% for AGIs $50k-75k, 60.7% for AGIs $75k-100k, 76.5% for AGIs $100k-200k)
Averages for the 2004 tax year for zip code 17866, filed in 2005:
Average Adjusted Gross Income (AGI) in 2004: $29,876 (Individual Income Tax Returns)
Here:
$29,876
State:
$48,049
Salary/wage: $27,869 (reported on 85.1% of returns)
Here:
$27,869
State:
$42,646
(% of AGI for various income ranges: 82.1% for AGIs below $10k, 75.1% for AGIs $10k-25k, 81.4% for AGIs $25k-50k, 83.3% for AGIs $50k-75k, 86.8% for AGIs $75k-100k, 56.6% for AGIs over 100k)
Taxable interest for individuals: $1,197 (reported on 37.9% of returns)
This zip code:
$1,197
Pennsylvania:
$1,657
(% of AGI for various income ranges: 5.8% for AGIs below $10k, 2.1% for AGIs $10k-25k, 1.3% for AGIs $25k-50k, 1.5% for AGIs $50k-75k, 0.5% for AGIs $75k-100k, 1.3% for AGIs over 100k)
Taxable dividends: $1,505 (reported on 18.6% of returns)
Here:
$1,505
State:
$3,566
(% of AGI for various income ranges: 2.5% for AGIs below $10k, 1.2% for AGIs $10k-25k, 0.5% for AGIs $25k-50k, 0.6% for AGIs $50k-75k, 0.6% for AGIs $75k-100k, 2.9% for AGIs over 100k)
Net capital gain/loss: +$3,764 (reported on 12.0% of returns)
Here:
+$3,764
State:
+$9,716
(% of AGI for various income ranges: -1.5% for AGIs below $10k, 0.0% for AGIs $10k-25k, 0.4% for AGIs $25k-50k, 0.6% for AGIs $50k-75k, 0.2% for AGIs $75k-100k, 14.4% for AGIs over 100k)
Profit/loss from business: +$7,298 (reported on 8.0% of returns)
Here:
+$7,298
State:
+$14,267
(% of AGI for various income ranges: 4.5% for AGIs below $10k, 2.8% for AGIs $10k-25k, 1.6% for AGIs $25k-50k, 1.4% for AGIs $50k-75k, 1.0% for AGIs $75k-100k, 4.0% for AGIs over 100k)
IRA payment deduction: $2,696 (reported on 1.8% of returns)
17866:
$2,696
Pennsylvania:
$2,903
Total itemized deductions: $13,094 (20% of AGI, reported on 9.5% of returns)
Here:
$13,094
State:
$18,804
Here:
20.5% of AGI
State:
19.5% of AGI
(% of AGI for various income ranges: 1.6% for AGIs $10k-25k, 3.1% for AGIs $25k-50k, 5.4% for AGIs $50k-75k, 6.7% for AGIs $75k-100k, 7.6% for AGIs over 100k)
Charity contributions deductions: $1,803 (3% of AGI, reported on 7.9% of returns)
Here:
$1,803
State:
$3,337
Here:
2.7% of AGI
State:
3.3% of AGI
(% of AGI for various income ranges: 0.2% for AGIs $10k-25k, 0.3% for AGIs $25k-50k, 0.5% for AGIs $50k-75k, 0.8% for AGIs $75k-100k, 1.4% for AGIs over 100k)
Total tax: $3,367 (reported on 70.4% of returns)
17866:
$3,367
State:
$8,008
(% of AGI for various income ranges: 1.8% for AGIs below $10k, 4.0% for AGIs $10k-25k, 6.6% for AGIs $25k-50k, 8.8% for AGIs $50k-75k, 10.8% for AGIs $75k-100k, 16.6% for AGIs over 100k)
Earned income credit: $1,514 (reported on 16.2% of returns)
Here:
$1,514
State:
$1,643
Percentage of individuals using paid preparers for their 2004 taxes: 54.7%
Here:
55%
State:
56%
(% for various income ranges: 46.7% for AGIs below $10k, 55.1% for AGIs $10k-25k, 57.0% for AGIs $25k-50k, 58.9% for AGIs $50k-75k, 62.9% for AGIs $75k-100k, 71.6% for AGIs over 100k)
Likely homosexual households (counted as self-reported same-sex unmarried-partner households)
Lesbian couples: 0.2% of all households
Gay men: 0.0% of all households
Household received Food Stamps/SNAP in the past 12 months: 635 Household did not receive Food Stamps/SNAP in the past 12 months: 3,001
Women who had a birth in the past 12 months: 79 (9 now married, 60 unmarried) Women who did not have a birth in the past 12 months: 1,309 (644 now married, 660 unmarried)
Housing units in zip code 17866 with a mortgage: 1,282 (173 second mortgage, 161 both second mortgage and home equity loan) Houses without a mortgage: 60
Median monthly owner costs for units with a mortgage: $877 Median monthly owner costs for units without a mortgage: $437
Residents with income below the poverty level in 2022:
This zip code:
12.9%
Whole state:
11.8%
Residents with income below 50% of the poverty level in 2022:
This zip code:
8.9%
Whole state:
6.1%
Median number of rooms in houses and condos:
Here:
6.6
State:
6.8
Median number of rooms in apartments:
Here:
5.5
State:
4.3
Notable locations in this zip code not listed on our city pages
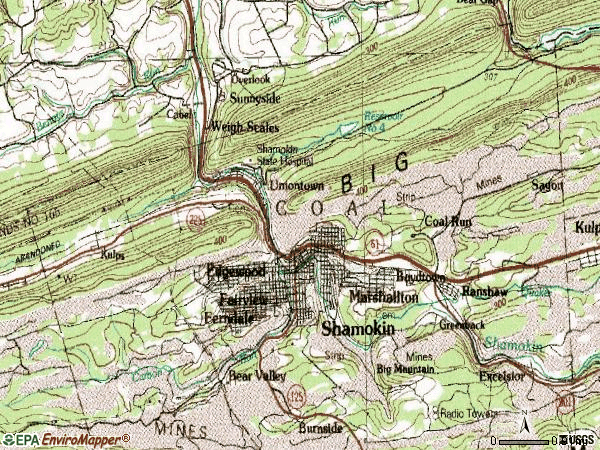
Notable locations in zip code 17866: Whaleback (A), Glen Burn Colliery Station (B), Hern Junction (C), Ranshaw Washery Station (D), Shamokin Filler Plant Station (E), Carbon Run Breaker Station (F), Big Mountain (G), Coal Township Fire Department - Fairview Fire Company and Emergency Medical Services Station 140 (H), Coal Township Fire Department - Brady Fire Association 5 Station 150 (I), Coal Township Fire Department - Uniontown Fire Company Station 130 (J), Coal Township Fire Department - Maine Fire Engine and Hose Company Station 190 (K), Coal Township Fire Department - Forest Hills Fire Company Station 160 (L), Coal Township Fire Department - East End Hose and Fire Company Station 120 (M). Display/hide their locations on the map
In group quarters: 2,703 (-1 institutionalized population)
Size of family households: 985 2-persons, 470 3-persons, 268 4-persons, 124 5-persons, 39 6-persons, 32 7-or-more-persons
Size of nonfamily households: 1,592 1-person, 112 2-persons, 9 3-persons
716 married couples with children.
259 single-parent households (66 men, 193 women).
96.1% of residents of 17866 zip code speak English at home.
2.5% of residents speak Spanish at home (59% very well, 38% well, 4% not well).
0.7% of residents speak other Indo-European language at home (100% very well).
0.2% of residents speak Asian or Pacific Island language at home (86% very well, 14% not well).
0.1% of residents speak other language at home (100% well).
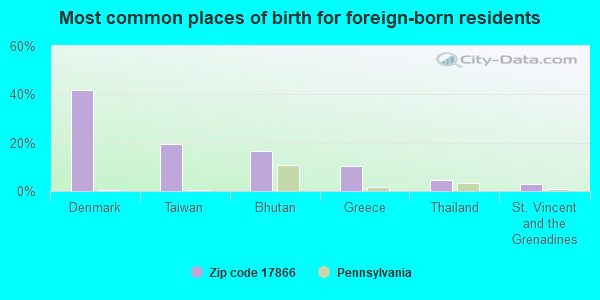
Foreign born population: 68 (0.7%) (98.5% of them are naturalized citizens)
This zip code:
0.7%
Whole state:
7.5%
42%Denmark
19%Taiwan
16%Bhutan
10%Greece
4%Thailand
3%St. Vincent and the Grenadines
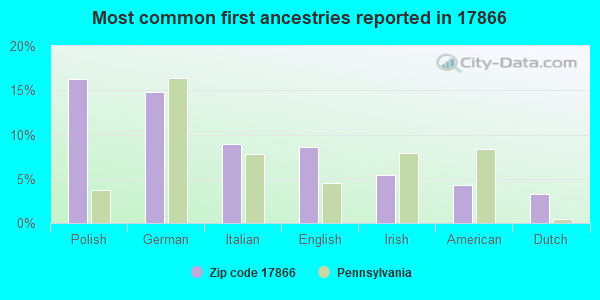
16%Polish
15%German
9%Italian
9%English
5%Irish
4%American
3%Dutch
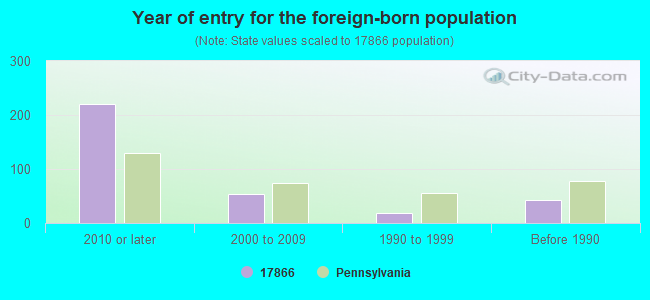
Year of entry for the foreign-born population
2212010 or later
532000 to 2009
191990 to 1999
43Before 1990
Facilities with environmental interests located in this zip code:
AQUA PENNSYLVANIA INC (OFF ROUTE 54 in COAL TWP, PA)
STATE MASTER (New Jersey environmental info) - NJEMS-PA007, LAB CERTIFICATION - COMMERCIAL ENVIRONMENTAL LAB National Pollutant Discharge Elimination System NON-MAJOR (Tracking pollutant discharge elimination systems) - permit Business SIC classification: WATER SUPPLY Alternative names: CONSUMERS PA WATER COMPANY, CONSUMERS PA WATER CO - ROARIN
Housing units lacking complete plumbing facilities: 4.0% Housing units lacking complete kitchen facilities: 3.7%
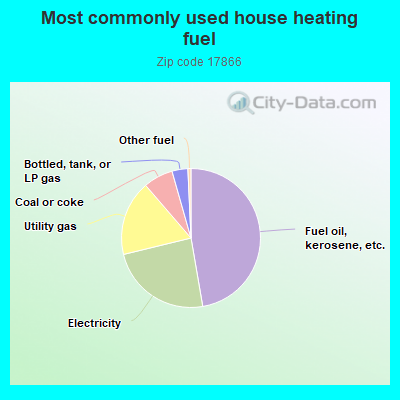
47.3%Fuel oil, kerosene, etc.
23.9%Electricity
17.5%Utility gas
6.9%Coal or coke
3.7%Bottled, tank, or LP gas
0.7%Other fuel
Population in 1990: 124. Population change in the 1990s: +10,442 (+8421.0%).
Place of birth for U.S.-born residents:
This state: 8,469
Northeast: 522
Midwest: 74
South: 389
West: 57
64% of the 17866 zip code residents lived in the same house 5 years ago. Out of people who lived in different houses, 52% lived in this county. Out of people who lived in different counties, 50% lived in Pennsylvania.
87% of the 17866 zip code residents lived in the same house 1 year ago. Out of people who lived in different houses, 39% moved from this county. Out of people who lived in different houses, 58% moved from different county within same state. Out of people who lived in different houses, 0% moved from different state.
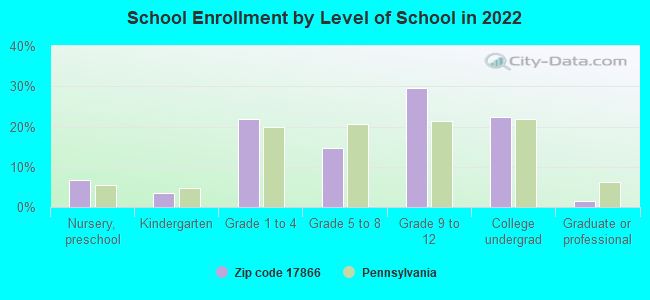
Private vs. public school enrollment:
Students in private schools in grades 1 to 8 (elementary and middle school): 138
Here:
34.3%
Pennsylvania:
15.7%
Students in private schools in grades 9 to 12 (high school): 96
Here:
29.7%
Pennsylvania:
13.4%
Students in private undergraduate colleges: 114
Here:
46.7%
Pennsylvania:
39.8%
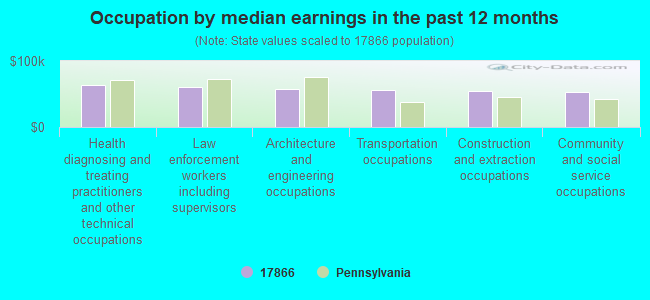
Occupation by median earnings in the past 12 months ($)
63,133Health diagnosing and treating practitioners and other technical occupations
60,982Law enforcement workers including supervisors
58,102Architecture and engineering occupations
55,632Transportation occupations
54,680Construction and extraction occupations
53,216Community and social service occupations
Companies with federal contracts located in this zip code:
ROBERT E MILBRAND INC (1301 W STATE ST in COAL TOWNSHIP, PA; small business) : $54,536 in 3 contractsfrom 2003 to 2005
$54,536 with Army for Construction of Structures and Facilities -- Miscellaneous Buildings. Signed on 2005-04-20. Completion date: 2005-03-21.
$6,700 with Army for Maintenance, Repair or Alteration of Real Property -- Other Administrative Facilities and Service Buildings. Signed on 2003-03-14. Completion date: 2003-04-08.
-$6,700, same as above.Signed on 2003-03-26. Completion date: 2003-04-08.
Daniel Moroz ( in COAL TOWNSHIP, PA; small business) : $45,656 in 7 contractsfrom 2001 to 2004
Contracts for Maintenance, Repair or Alteration of Real Property -- Restoration of real property by Office of Surface Mining, Reclamation and Enforcement Signed by year:2000: $0; 2001: $17,000; 2002: $5,799; 2003: $0; 2004: $22,857; 2005: $0; 2006: $0.
Biggest contracts:
$24,950 with Office of Surface Mining, Reclamation and Enforcement for Maintenance, Repair or Alteration of Real Property -- Restoration of real property. Signed on 2004-07-20. Effective on 2004-08-10. Completion date: 2004-08-10.
$8,025, same as above.Signed on 2002-10-15. Completion date: 2002-11-15.
$7,000, same as above.Signed on 2001-12-15. Completion date: 2001-12-15.
$7,000, same as above.Signed on 2001-01-15. Completion date: 2001-01-15.
Top industries in this zip code by the number of employees in 2005:
Health Care and Social Assistance: General Medical and Surgical Hospitals (250-499 employees: 1 establishment)
Administrative and Support and Waste Management and Remediation Services: Solid Waste Collection (50-99: 1, 5-9: 1, 1-4: 1)
Accommodation and Food Services: Limited-Service Restaurants (5-9: 2, 1-4: 2)
Other Services (except Public Administration): Religious Organizations (5-9: 2, 1-4: 2)
People in group quarters in 2010:
1,954 people in state prisons
218 people in correctional facilities intended for juveniles
206 people in nursing facilities/skilled-nursing facilities
10 people in other noninstitutional facilities
9 people in mental (psychiatric) hospitals and psychiatric units in other hospitals
People in group quarters in 2000:
1,662 people in state prisons
270 people in nursing homes
211 people in training schools for juvenile delinquents
30 people in other noninstitutional group quarters
17 people in short-term care, detention or diagnostic centers for delinquent children
9 people in religious group quarters
8 people in hospitals/wards and hospices for chronically ill
8 people in other hospitals or wards for chronically ill
4 people in other nonhousehold living situations
Fatal accident statistics in 2013:
Fatal accident count: 1
Vehicles involved in fatal accidents: 2
Fatal accidents caused by drunken drivers: 0
Fatalities: 1
Persons involved in fatal accidents: 4
Pedestrians involved in fatal accidents: 0
Fatal accident statistics in 2012:
Fatal accident count: 1
Vehicles involved in fatal accidents: 1
Fatal accidents caused by drunken drivers: 0
Fatalities: 1
Persons involved in fatal accidents: 2
Pedestrians involved in fatal accidents: 0
2004 - 2018 National Fire Incident Reporting System (NFIRS) incidents
According to the data from the years 2004 - 2018 the average number of fire incidents per year is 14. The highest number of reported fire incidents - 45 took place in 2018, and the least - 0 in 2011. The data has a growing trend.
When looking into fire subcategories, the most incidents belonged to: Structure Fires (51.2%), and Outside Fires (34.1%).
Fire incident types reported to NFIRS in Zip Code 17866
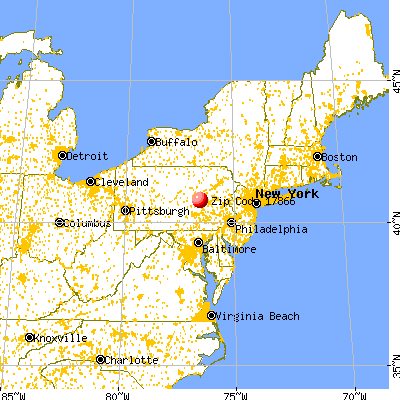


 Nearest zip codes: 17824, 17834, 17832, 17860, 17964, 17836.


 According to the data from the years 2004 - 2018 the average number of fire incidents per year is 14. The highest number of reported fire incidents - 45 took place in 2018, and the least - 0 in 2011. The data has a growing trend.
 When looking into fire subcategories, the most incidents belonged to: Structure Fires (51.2%), and Outside Fires (34.1%).