Estimated zip code population in 2022: 4,099 Zip code population in 2010: 5,029 Zip code population in 2000: 5,725
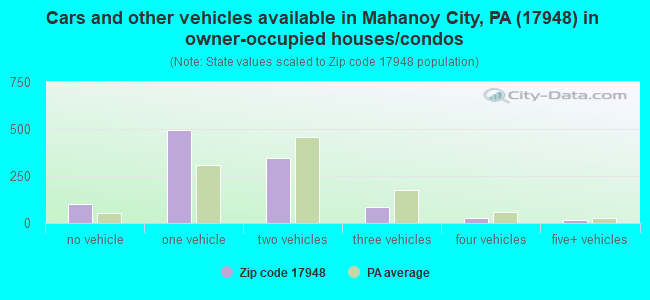
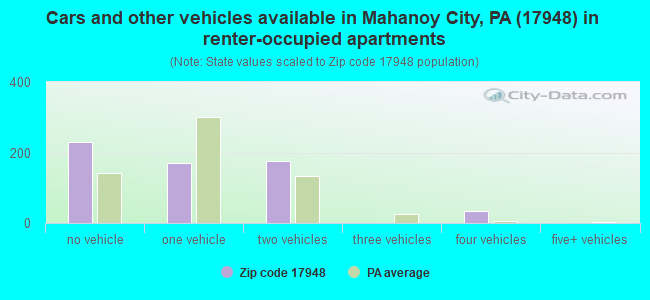
Houses and condos: 2,622 Renter-occupied apartments: 615
% of renters here:
37%
State:
31%
March 2022 cost of living index in zip code 17948: 82.1 (low, U.S. average is 100)
Land area: 25.6 sq. mi. Water area: 0.2 sq. mi.
Population density: 160 people per square mile
(very low).
OSM Map
General Map
Google Map
MSN Map
OSM Map
General Map
Google Map
MSN Map
OSM Map
General Map
Google Map
MSN Map
OSM Map
General Map
Google Map
MSN Map
Please wait while loading the map...
Real estate property taxes paid for housing units in 2022:
This zip code:
2.3% ($876)
Pennsylvania:
1.3% ($3,094)
Median real estate property taxes paid for housing units with mortgages in 2022: $900 (1.3%) Median real estate property taxes paid for housing units with no mortgage in 2022: $868 (2.5%)
Business Search- 14 Million verified businesses
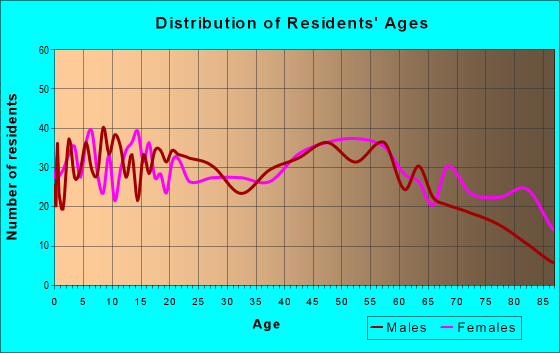
Males: 2,066
(50.4%)
Females: 2,033
(49.6%)
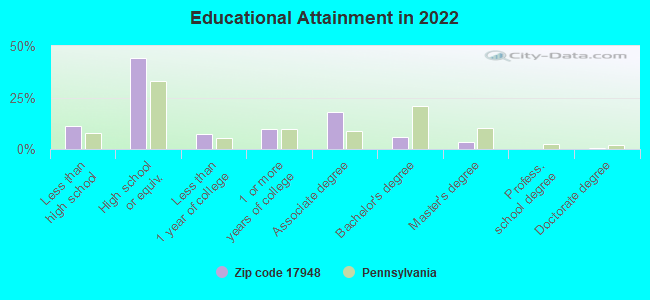
For population 25 years and over in 17948:
High school or higher: 87.3%
Bachelor's degree or higher: 9.5%
Graduate or professional degree: 3.6%
Unemployed: 11.1%
Mean travel time to work (commute): 23.0 minutes
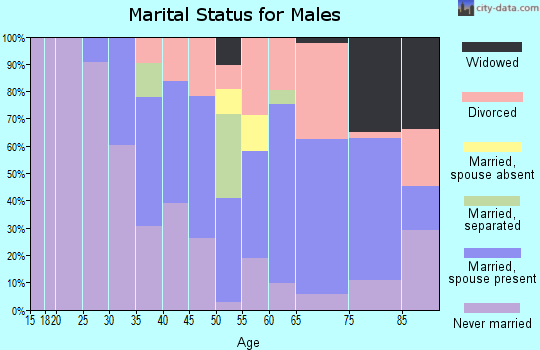
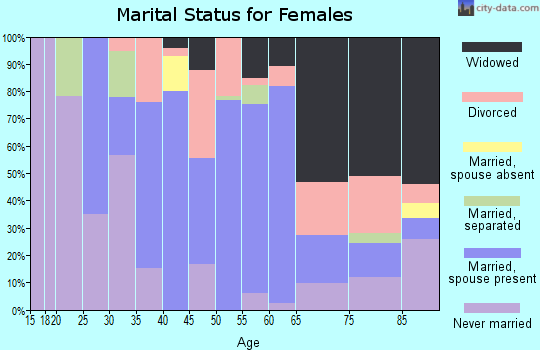
For population 15 years and over in 17948:
Never married: 42.4%
Now married: 32.9%
Separated: 1.7%
Widowed: 8.2%
Divorced: 14.9%
Zip code 17948 compared to state average:
Median household income below state average.
Median house value significantly below state average.
Unemployed percentage above state average.
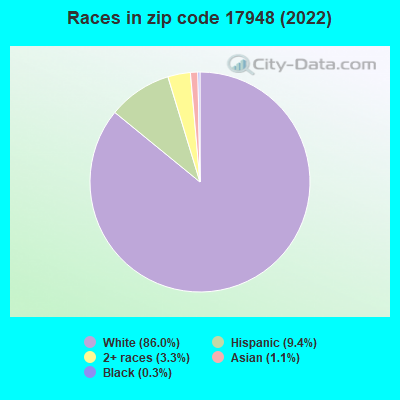
Black race population percentage significantly below state average.
Foreign-born population percentage below state average.
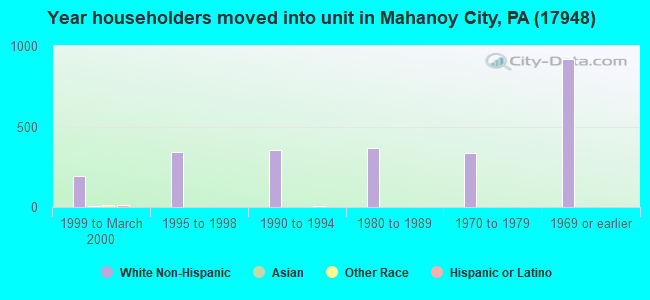
Length of stay since moving in significantly above state average.
House age above state average.
Number of college students below state average.
Percentage of population with a bachelor's degree or higher significantly below state average.
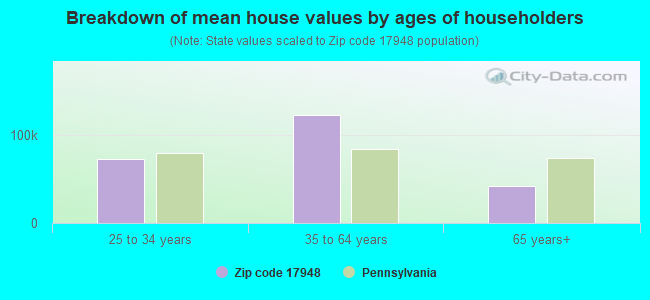
Estimated median house/condo value in 2022: $37,661
17948:
$37,661
Pennsylvania:
$245,500
According to our research of Pennsylvania and other state lists, there were 9 registered sex offenders living in 17948 zip code as of April 27, 2024. The ratio of all residents to sex offenders in zip code 17948 is 563 to 1. The ratio of registered sex offenders to all residents in this zip code is near the state average.
Median resident age:
This zip code:
39.9 years
Pennsylvania median age:
40.9 years
Average household size:
This zip code:
2.4 people
Pennsylvania:
2.4 people
Averages for the 2020 tax year for zip code 17948, filed in 2021:
Average Adjusted Gross Income (AGI) in 2020: $37,530 (Individual Income Tax Returns)
Here:
$37,530
State:
$75,707
Salary/wage: $34,097 (reported on 79.4% of returns)
Here:
$34,097
State:
$62,806
(% of AGI for various income ranges: 902.2% for AGIs below $25k, 3264.6% for AGIs $25k-50k, 5875.2% for AGIs $50k-75k, 8217.5% for AGIs $75k-100k, 14962.9% for AGIs $100k-200k)
Taxable interest for individuals: $467 (reported on 16.6% of returns)
This zip code:
$467
Pennsylvania:
$1,633
(% of AGI for various income ranges: 7.3% for AGIs below $25k, 5.2% for AGIs $25k-50k, 17.8% for AGIs $50k-75k, 32.5% for AGIs $75k-100k, 18.6% for AGIs $100k-200k)
Ordinary dividends: $2,161 (reported on 11.6% of returns)
Here:
$2,161
State:
$7,382
(% of AGI for various income ranges: 14.1% for AGIs below $25k, 31.9% for AGIs $25k-50k, 64.3% for AGIs $50k-75k, 125.7% for AGIs $100k-200k)
Net capital gain/loss in AGI: +$2,162 (reported on 6.5% of returns)
Here:
+$2,162
State:
+$23,522
(% of AGI for various income ranges: 7.4% for AGIs $25k-50k, 13.0% for AGIs $50k-75k, 263.8% for AGIs $75k-100k)
Profit/loss from business: +$6,079 (reported on 7.0% of returns)
Here:
+$6,079
State:
+$16,274
(% of AGI for various income ranges: 57.0% for AGIs below $25k, 62.0% for AGIs $25k-50k, 68.3% for AGIs $50k-75k)
Taxable individual retirement arrangement distribution: $9,000 (reported on 8.5% of returns)
17948:
$9,000
Pennsylvania:
$18,583
(% of AGI for various income ranges: 56.7% for AGIs below $25k, 72.8% for AGIs $25k-50k, 131.3% for AGIs $50k-75k, 597.5% for AGIs $75k-100k)
Earned income credit: $2,396 (reported on 24.6% of returns)
Here:
$2,396
State:
$2,100
(% of AGI for various income ranges: 112.1% for AGIs below $25k, 86.7% for AGIs $25k-50k)
Percentage of individuals using paid preparers for their 2020 taxes: 93.5%
Here:
93%
State:
92%
(% for various income ranges: 91.8% for AGIs below $25k, 93.8% for AGIs $25k-50k, 93.1% for AGIs $50k-75k, 100.0% for AGIs $75k-100k, 100.0% for AGIs $100k-200k)
Averages for the 2012 tax year for zip code 17948, filed in 2013:
Average Adjusted Gross Income (AGI) in 2012: $32,742 (Individual Income Tax Returns)
Here:
$32,742
State:
$61,346
Salary/wage: $30,436 (reported on 83.7% of returns)
Here:
$30,436
State:
$51,902
(% of AGI for various income ranges: 69.1% for AGIs below $25k, 82.4% for AGIs $25k-50k, 80.3% for AGIs $50k-75k, 80.3% for AGIs $75k-100k, 70.9% for AGIs $100k-200k)
Taxable interest for individuals: $866 (reported on 20.3% of returns)
This zip code:
$866
Pennsylvania:
$1,588
(% of AGI for various income ranges: 1.4% for AGIs below $25k, 0.3% for AGIs $25k-50k, 0.5% for AGIs $50k-75k, 0.2% for AGIs $75k-100k, 0.2% for AGIs $100k-200k)
Ordinary dividends: $1,663 (reported on 14.9% of returns)
Here:
$1,663
State:
$5,827
(% of AGI for various income ranges: 1.0% for AGIs below $25k, 0.7% for AGIs $25k-50k, 1.3% for AGIs $50k-75k, 0.5% for AGIs $75k-100k)
Net capital gain/loss in AGI: +$469 (reported on 6.4% of returns)
Here:
+$469
State:
+$14,495
(% of AGI for various income ranges: 0.2% for AGIs $50k-75k, 0.5% for AGIs $75k-100k)
Profit/loss from business: +$6,020 (reported on 7.4% of returns)
Here:
+$6,020
State:
+$16,268
(% of AGI for various income ranges: 5.0% for AGIs below $25k, 1.0% for AGIs $25k-50k, 0.6% for AGIs $50k-75k)
Taxable individual retirement arrangement distribution: $10,431 (reported on 7.9% of returns)
17948:
$10,431
Pennsylvania:
$14,550
(% of AGI for various income ranges: 2.7% for AGIs below $25k, 1.2% for AGIs $25k-50k, 1.7% for AGIs $50k-75k, 9.0% for AGIs $75k-100k)
Total itemized deductions: $18,142 (27% of AGI, reported on 5.9% of returns)
Here:
$18,142
State:
$23,538
Here:
27.5% of AGI
State:
18.4% of AGI
(% of AGI for various income ranges: 4.1% for AGIs $25k-50k, 5.1% for AGIs $50k-75k, 6.5% for AGIs $100k-200k)
Charity contributions: $1,975 (reported on 4.0% of returns)
Here:
$1,975
State:
$4,025
(% of AGI for various income ranges: 0.2% for AGIs $25k-50k, 0.3% for AGIs $50k-75k, 0.7% for AGIs $100k-200k)
Taxes paid: $3,883 (reported on 5.9% of returns)
17948:
$3,883
State:
$9,982
(% of AGI for various income ranges: 0.4% for AGIs $25k-50k, 1.2% for AGIs $50k-75k, 2.3% for AGIs $100k-200k)
Earned income credit: $2,186 (reported on 25.2% of returns)
Here:
$2,186
State:
$2,106
(% of AGI for various income ranges: 7.2% for AGIs below $25k, 1.1% for AGIs $25k-50k)
Percentage of individuals using paid preparers for their 2012 taxes: 44.6%
Here:
45%
State:
53%
(% for various income ranges: 41.4% for AGIs below $25k, 44.3% for AGIs $25k-50k, 50.0% for AGIs $50k-75k, 54.5% for AGIs $75k-100k, 57.1% for AGIs $100k-200k)
Averages for the 2004 tax year for zip code 17948, filed in 2005:
Average Adjusted Gross Income (AGI) in 2004: $28,755 (Individual Income Tax Returns)
Here:
$28,755
State:
$48,049
Salary/wage: $28,401 (reported on 82.5% of returns)
Here:
$28,401
State:
$42,646
(% of AGI for various income ranges: 72.2% for AGIs below $10k, 70.6% for AGIs $10k-25k, 84.5% for AGIs $25k-50k, 85.3% for AGIs $50k-75k, 86.2% for AGIs $75k-100k, 79.5% for AGIs over 100k)
Taxable interest for individuals: $1,702 (reported on 36.9% of returns)
This zip code:
$1,702
Pennsylvania:
$1,657
(% of AGI for various income ranges: 6.8% for AGIs below $10k, 4.5% for AGIs $10k-25k, 1.8% for AGIs $25k-50k, 1.5% for AGIs $50k-75k, 0.3% for AGIs $75k-100k, 0.9% for AGIs over 100k)
Taxable dividends: $1,800 (reported on 21.0% of returns)
Here:
$1,800
State:
$3,566
(% of AGI for various income ranges: 5.4% for AGIs below $10k, 1.5% for AGIs $10k-25k, 1.1% for AGIs $25k-50k, 1.6% for AGIs $50k-75k, 0.1% for AGIs $75k-100k, 0.5% for AGIs over 100k)
Net capital gain/loss: +$393 (reported on 10.8% of returns)
Here:
+$393
State:
+$9,716
(% of AGI for various income ranges: -0.8% for AGIs below $10k, 0.2% for AGIs $10k-25k, -0.1% for AGIs $25k-50k, 0.6% for AGIs $50k-75k, 0.1% for AGIs $75k-100k)
Profit/loss from business: +$4,862 (reported on 6.8% of returns)
Here:
+$4,862
State:
+$14,267
(% of AGI for various income ranges: 2.3% for AGIs below $10k, 2.7% for AGIs $10k-25k, 1.0% for AGIs $25k-50k, 0.4% for AGIs $50k-75k, 1.2% for AGIs $75k-100k)
IRA payment deduction: $1,904 (reported on 2.3% of returns)
17948:
$1,904
Pennsylvania:
$2,903
Total itemized deductions: $13,508 (22% of AGI, reported on 8.5% of returns)
Here:
$13,508
State:
$18,804
Here:
21.7% of AGI
State:
19.5% of AGI
(% of AGI for various income ranges: 1.9% for AGIs $10k-25k, 3.8% for AGIs $25k-50k, 4.9% for AGIs $50k-75k, 5.3% for AGIs $75k-100k, 7.2% for AGIs over 100k)
Charity contributions deductions: $1,916 (3% of AGI, reported on 7.5% of returns)
Here:
$1,916
State:
$3,337
Here:
3.0% of AGI
State:
3.3% of AGI
(% of AGI for various income ranges: 0.3% for AGIs $10k-25k, 0.6% for AGIs $25k-50k, 0.5% for AGIs $50k-75k, 0.7% for AGIs $75k-100k, 0.8% for AGIs over 100k)
Total tax: $3,392 (reported on 67.4% of returns)
17948:
$3,392
State:
$8,008
(% of AGI for various income ranges: 1.1% for AGIs below $10k, 4.1% for AGIs $10k-25k, 6.7% for AGIs $25k-50k, 8.5% for AGIs $50k-75k, 11.4% for AGIs $75k-100k, 20.7% for AGIs over 100k)
Earned income credit: $1,633 (reported on 18.9% of returns)
Here:
$1,633
State:
$1,643
Percentage of individuals using paid preparers for their 2004 taxes: 48.9%
Here:
49%
State:
56%
(% for various income ranges: 41.8% for AGIs below $10k, 48.3% for AGIs $10k-25k, 50.8% for AGIs $25k-50k, 56.6% for AGIs $50k-75k, 58.9% for AGIs $75k-100k, 57.7% for AGIs over 100k)
Likely homosexual households (counted as self-reported same-sex unmarried-partner households)
Lesbian couples: 3.7% of all households
Gay men: 0.0% of all households
Household received Food Stamps/SNAP in the past 12 months: 606 Household did not receive Food Stamps/SNAP in the past 12 months: 1,092
Women who had a birth in the past 12 months: 19 (20 now married, 0 unmarried) Women who did not have a birth in the past 12 months: 813 (177 now married, 641 unmarried)
Housing units in zip code 17948 with a mortgage: 290 (8 second mortgage, 8 both second mortgage and home equity loan) Houses without a mortgage: 3
Median monthly owner costs for units with a mortgage: $988 Median monthly owner costs for units without a mortgage: $440
Residents with income below the poverty level in 2022:
This zip code:
30.6%
Whole state:
11.8%
Residents with income below 50% of the poverty level in 2022:
This zip code:
21.3%
Whole state:
6.1%
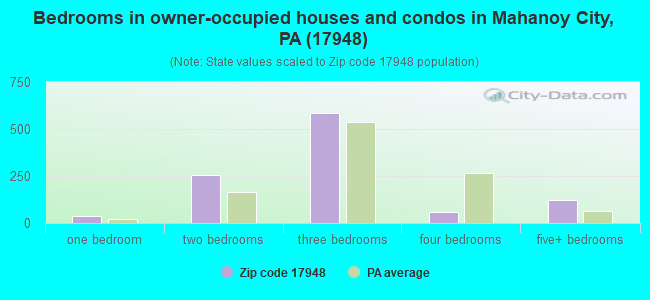
Median number of rooms in houses and condos:
Here:
6.9
State:
6.8
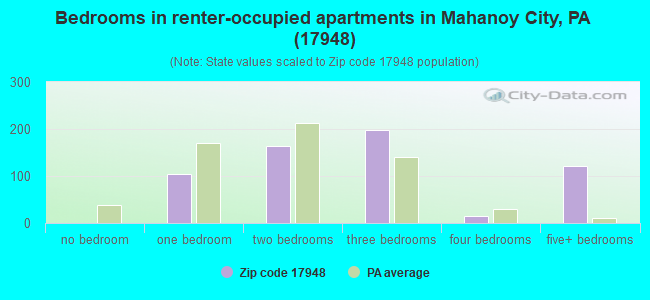
Median number of rooms in apartments:
Here:
5.9
State:
4.3
Notable locations in this zip code not listed on our city pages
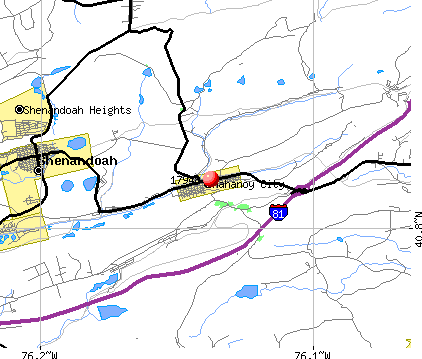
Notable locations in zip code 17948: Washington Hook and Ladder Company 1 (A), Humane Fire Company 1 (B), Good American Hose Company 3 (C), West End Fire and Rescue Company (D), Citizens Fire Company 2 / Mahanoy City Emergency Medical Services (E). Display/hide their locations on the map
Reservoirs: Shenandoah Reservoir (A), Waste House Run Reservoir (B), Waste House Run Reservoir Number Three (C), Park Place Lake (D), Reservoir Number Two (E), Mahanoy Reservoir Number Two (F), Reservoir Number 1 (G), Number Three Reservoir (H). Display/hide their locations on the map
304 married couples with children.
630 single-parent households (45 men, 585 women).
89.7% of residents of 17948 zip code speak English at home.
6.6% of residents speak Spanish at home (66% very well, 9% well, 7% not well, 17% not at all).
0.7% of residents speak other Indo-European language at home (59% very well, 41% not well).
0.9% of residents speak Asian or Pacific Island language at home (100% very well).
1.9% of residents speak other language at home (71% very well, 29% well).
Foreign born population: 177 (4.3%) (42.9% of them are naturalized citizens)
This zip code:
4.3%
Whole state:
7.5%
75%Dominica
9%Uruguay
7%Taiwan
2%United Kingdom, excluding England and Scotland
2%Sweden
1%Guyana
1%Malaysia
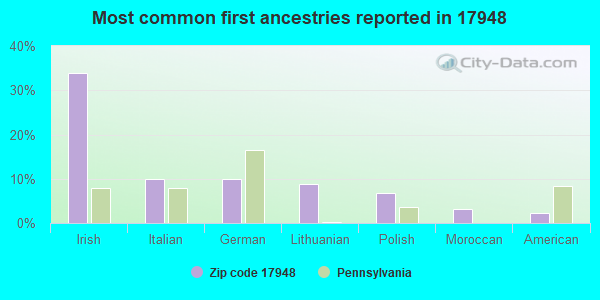
34%Irish
10%Italian
10%German
9%Lithuanian
7%Polish
3%Moroccan
2%American
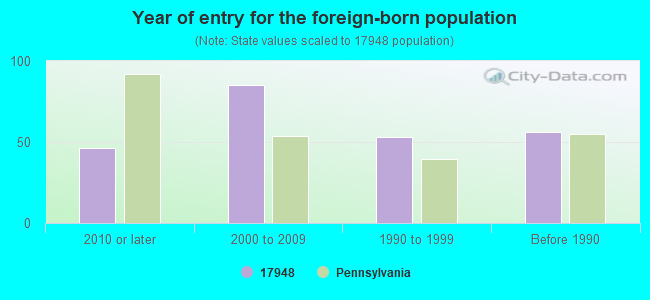
Year of entry for the foreign-born population
462010 or later
852000 to 2009
531990 to 1999
56Before 1990
Facilities with environmental interests located in this zip code:
BLASCHAK COAL MAHANOY (PO BOX 12 in MAHANOY CITY, PA)
AIR MINOR (AIRS/AFS) STATE MASTER (Pennsylvania database) - AFS-23-1631705-1, AIR PROGRAM Business SIC classification: BITUMINOUS COAL AND LIGNITE SURFACE MINING Organizations: BLASCHAK COAL CORPORATION (OWNER/OPERATOR)
Alternative names: BLASCHAK COAL CORP, BLASCHAK COAL CO/MAHANOY TWP
BEAUTY FOUNTAINS CO (PARK PLACE RD in MAHANOY CITY, PA)
COMPLIANCE ACTIVITY (Tracking inspections of insecticide, fungicide, and rodenticide, and toxic substances) (Resource Conservation and Recovery Act (tracking hazardous waste)) Organizations: OPERNAME (CONTACT/OPERATOR)
, BOLITSKY JOE (CONTACT/OWNER)
Housing units lacking complete plumbing facilities: 15.5% Housing units lacking complete kitchen facilities: 15.9%
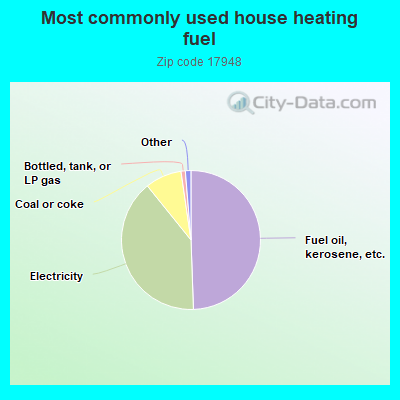
49.5%Fuel oil, kerosene, etc.
39.8%Electricity
8.5%Coal or coke
1.0%Bottled, tank, or LP gas
0.6%Utility gas
0.5%Other fuel
Population in 1990: 5,209. Population change in the 1990s: +516 (+9.9%).
Place of birth for U.S.-born residents:
This state: 3,161
Northeast: 500
Midwest: 14
South: 147
West: 9
76% of the 17948 zip code residents lived in the same house 5 years ago. Out of people who lived in different houses, 78% lived in this county. Out of people who lived in different counties, 50% lived in Pennsylvania.
91% of the 17948 zip code residents lived in the same house 1 year ago. Out of people who lived in different houses, 70% moved from this county. Out of people who lived in different houses, 24% moved from different county within same state. Out of people who lived in different houses, 4% moved from different state.
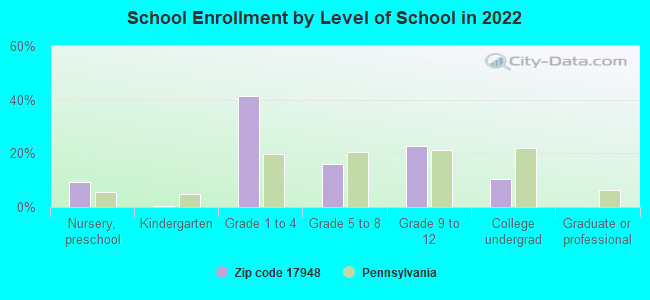
Private vs. public school enrollment:
Students in private schools in grades 1 to 8 (elementary and middle school): 66
Here:
11.3%
Pennsylvania:
15.7%
Students in private schools in grades 9 to 12 (high school): 4
Here:
2.1%
Pennsylvania:
13.4%
Students in private undergraduate colleges: 1
Here:
1.8%
Pennsylvania:
39.8%
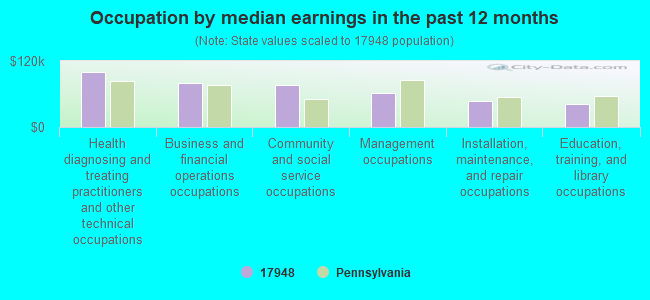
Occupation by median earnings in the past 12 months ($)
99,108Health diagnosing and treating practitioners and other technical occupations
79,327Business and financial operations occupations
75,987Community and social service occupations
62,395Management occupations
46,678Installation, maintenance, and repair occupations
42,348Education, training, and library occupations
Top industries in this zip code by the number of employees in 2005:
Information: Cable and Other Program Distribution (20-49: 1)
Other Services (except Public Administration): Religious Organizations (5-9: 3, 1-4: 2)
Real Estate and Rental and Leasing: Lessors of Residential Buildings and Dwellings (10-19: 1)
Health Care and Social Assistance: Homes for the Elderly (10-19: 1)
Educational Services: Elementary and Secondary Schools (10-19: 1)
Construction: New Single-Family Housing Construction (except Operative Builders) (10-19: 1)
Wholesale Trade: Recyclable Material Merchant Wholesalers (10-19: 1)
People in group quarters in 2010:
5 people in other noninstitutional facilities
People in group quarters in 2000:
25 people in nursing homes
8 people in religious group quarters
Fatal accident statistics in 2014:
Fatal accident count: 1
Vehicles involved in fatal accidents: 2
Fatal accidents caused by drunken drivers: 0
Fatalities: 1
Persons involved in fatal accidents: 2
Pedestrians involved in fatal accidents: 0
Fatal accident statistics in 2012:
Fatal accident count: 1
Vehicles involved in fatal accidents: 1
Fatal accidents caused by drunken drivers: 0
Fatalities: 1
Persons involved in fatal accidents: 1
Pedestrians involved in fatal accidents: 1
2002 - 2018 National Fire Incident Reporting System (NFIRS) incidents
Based on the data from the years 2002 - 2018 the average number of fire incidents per year is 20. The highest number of reported fire incidents - 51 took place in 2016, and the least - 0 in 2004. The data has a growing trend.
When looking into fire subcategories, the most reports belonged to: Structure Fires (71.2%), and Mobile Property/Vehicle Fires (11.3%).
Fire incident types reported to NFIRS in Zip Code 17948
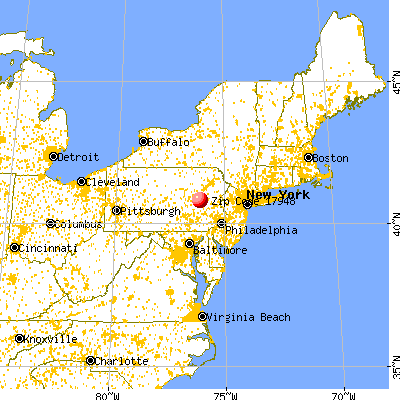


 Nearest zip codes: 18214, 18220, 18248, 18242, 18245, 17953.
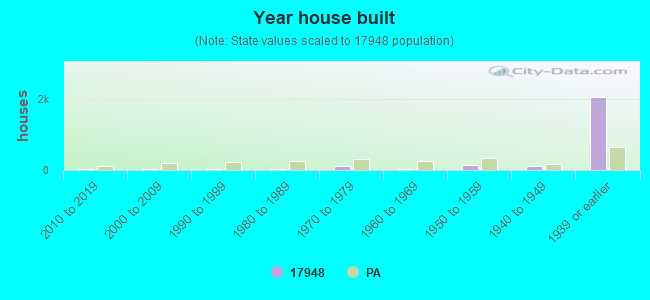


 Based on the data from the years 2002 - 2018 the average number of fire incidents per year is 20. The highest number of reported fire incidents - 51 took place in 2016, and the least - 0 in 2004. The data has a growing trend.
 When looking into fire subcategories, the most reports belonged to: Structure Fires (71.2%), and Mobile Property/Vehicle Fires (11.3%).