Estimated zip code population in 2022: 19,140
Zip code population in 2010: 17,852
Zip code population in 2000: 15,953
Houses and condos: 8,585
Renter-occupied apartments: 1,961
% of renters here:
25%State:
31%
March 2022 cost of living index in zip code 18067: 99.0
(near average, U.S. average is 100)
Land area: 24.9
sq. mi.
Water area: 0.5
sq. mi.
Population density: 768 people per square mile (low).
OSM Map
General Map
Google Map
MSN Map
OSM Map
General Map
Google Map
MSN Map
OSM Map
General Map
Google Map
MSN Map
OSM Map
General Map
Google Map
MSN Map
Please wait while loading the map...
Real estate property taxes paid for housing units in 2022:
This zip code:
1.5% ($3,957)Pennsylvania:
1.3% ($3,094)
Median real estate property taxes paid for housing units with mortgages in 2022: $4,007 (1.5%)
Median real estate property taxes paid for housing units with no mortgage in 2022: $3,874 (1.5%)
Profiles of local businesses
Business Search - 14 Million verified businesses
Males: 9,683 Females: 9,456
For population 25 years and over in 18067:
High school or higher: 94.1%Bachelor's degree or higher: 26.5%Graduate or professional degree: 9.9%Unemployed: 2.5%Mean travel time to work (commute): 26.7 minutes
For population 15 years and over in 18067:
Never married: 27.3%Now married: 53.0%Separated: 1.2%Widowed: 6.6%Divorced: 11.8%
Zip code 18067 compared to state average:
Unemployed percentage below state average. Black race population percentage significantly below state average. Median age above state average. 16,505 86.2% White 1,776 9.3% Hispanic or Latino 357 1.9% Two or more races 276 1.4% Asian 224 1.2% Black
Data:
Median household income ($)
Median household income (% change since 2000)
Household income diversity
Ratio of average income to average house value (%)
Ratio of average income to average rent
Median household income ($) - White
Median household income ($) - Black or African American
Median household income ($) - Asian
Median household income ($) - Hispanic or Latino
Median household income ($) - American Indian and Alaska Native
Median household income ($) - Multirace
Median household income ($) - Other Race
Median household income for houses/condos with a mortgage ($)
Median household income for apartments without a mortgage ($)
Races - White alone (%)
Races - White alone (% change since 2000)
Races - Black alone (%)
Races - Black alone (% change since 2000)
Races - American Indian alone (%)
Races - American Indian alone (% change since 2000)
Races - Asian alone (%)
Races - Asian alone (% change since 2000)
Races - Hispanic (%)
Races - Hispanic (% change since 2000)
Races - Native Hawaiian and Other Pacific Islander alone (%)
Races - Native Hawaiian and Other Pacific Islander alone (% change since 2000)
Races - Two or more races (%)
Races - Two or more races (% change since 2000)
Races - Other race alone (%)
Races - Other race alone (% change since 2000)
Racial diversity
Unemployment (%)
Unemployment (% change since 2000)
Unemployment (%) - White
Unemployment (%) - Black or African American
Unemployment (%) - Asian
Unemployment (%) - Hispanic or Latino
Unemployment (%) - American Indian and Alaska Native
Unemployment (%) - Multirace
Unemployment (%) - Other Race
Population density (people per square mile)
Population - Males (%)
Population - Females (%)
Population - Males (%) - White
Population - Males (%) - Black or African American
Population - Males (%) - Asian
Population - Males (%) - Hispanic or Latino
Population - Males (%) - American Indian and Alaska Native
Population - Males (%) - Multirace
Population - Males (%) - Other Race
Population - Females (%) - White
Population - Females (%) - Black or African American
Population - Females (%) - Asian
Population - Females (%) - Hispanic or Latino
Population - Females (%) - American Indian and Alaska Native
Population - Females (%) - Multirace
Population - Females (%) - Other Race
Coronavirus confirmed cases (Apr 27, 2024)
Deaths caused by coronavirus (Apr 27, 2024)
Coronavirus confirmed cases (per 100k population) (Apr 27, 2024)
Deaths caused by coronavirus (per 100k population) (Apr 27, 2024)
Daily increase in number of cases (Apr 27, 2024)
Weekly increase in number of cases (Apr 27, 2024)
Cases doubled (in days) (Apr 27, 2024)
Hospitalized patients (Apr 18, 2022)
Negative test results (Apr 18, 2022)
Total test results (Apr 18, 2022)
COVID Vaccine doses distributed (per 100k population) (Sep 19, 2023)
COVID Vaccine doses administered (per 100k population) (Sep 19, 2023)
COVID Vaccine doses distributed (Sep 19, 2023)
COVID Vaccine doses administered (Sep 19, 2023)
Likely homosexual households (%)
Likely homosexual households (% change since 2000)
Likely homosexual households - Lesbian couples (%)
Likely homosexual households - Lesbian couples (% change since 2000)
Likely homosexual households - Gay men (%)
Likely homosexual households - Gay men (% change since 2000)
Cost of living index
Median gross rent ($)
Median contract rent ($)
Median monthly housing costs ($)
Median house or condo value ($)
Median house or condo value ($ change since 2000)
Mean house or condo value by units in structure - 1, detached ($)
Mean house or condo value by units in structure - 1, attached ($)
Mean house or condo value by units in structure - 2 ($)
Mean house or condo value by units in structure by units in structure - 3 or 4 ($)
Mean house or condo value by units in structure - 5 or more ($)
Mean house or condo value by units in structure - Boat, RV, van, etc. ($)
Mean house or condo value by units in structure - Mobile home ($)
Median house or condo value ($) - White
Median house or condo value ($) - Black or African American
Median house or condo value ($) - Asian
Median house or condo value ($) - Hispanic or Latino
Median house or condo value ($) - American Indian and Alaska Native
Median house or condo value ($) - Multirace
Median house or condo value ($) - Other Race
Median resident age
Resident age diversity
Median resident age - Males
Median resident age - Females
Median resident age - White
Median resident age - Black or African American
Median resident age - Asian
Median resident age - Hispanic or Latino
Median resident age - American Indian and Alaska Native
Median resident age - Multirace
Median resident age - Other Race
Median resident age - Males - White
Median resident age - Males - Black or African American
Median resident age - Males - Asian
Median resident age - Males - Hispanic or Latino
Median resident age - Males - American Indian and Alaska Native
Median resident age - Males - Multirace
Median resident age - Males - Other Race
Median resident age - Females - White
Median resident age - Females - Black or African American
Median resident age - Females - Asian
Median resident age - Females - Hispanic or Latino
Median resident age - Females - American Indian and Alaska Native
Median resident age - Females - Multirace
Median resident age - Females - Other Race
Commute - mean travel time to work (minutes)
Travel time to work - Less than 5 minutes (%)
Travel time to work - Less than 5 minutes (% change since 2000)
Travel time to work - 5 to 9 minutes (%)
Travel time to work - 5 to 9 minutes (% change since 2000)
Travel time to work - 10 to 19 minutes (%)
Travel time to work - 10 to 19 minutes (% change since 2000)
Travel time to work - 20 to 29 minutes (%)
Travel time to work - 20 to 29 minutes (% change since 2000)
Travel time to work - 30 to 39 minutes (%)
Travel time to work - 30 to 39 minutes (% change since 2000)
Travel time to work - 40 to 59 minutes (%)
Travel time to work - 40 to 59 minutes (% change since 2000)
Travel time to work - 60 to 89 minutes (%)
Travel time to work - 60 to 89 minutes (% change since 2000)
Travel time to work - 90 or more minutes (%)
Travel time to work - 90 or more minutes (% change since 2000)
Marital status - Never married (%)
Marital status - Now married (%)
Marital status - Separated (%)
Marital status - Widowed (%)
Marital status - Divorced (%)
Median family income ($)
Median family income (% change since 2000)
Median non-family income ($)
Median non-family income (% change since 2000)
Median per capita income ($)
Median per capita income (% change since 2000)
Median family income ($) - White
Median family income ($) - Black or African American
Median family income ($) - Asian
Median family income ($) - Hispanic or Latino
Median family income ($) - American Indian and Alaska Native
Median family income ($) - Multirace
Median family income ($) - Other Race
Median year house/condo built
Median year apartment built
Year house built - Built 2005 or later (%)
Year house built - Built 2000 to 2004 (%)
Year house built - Built 1990 to 1999 (%)
Year house built - Built 1980 to 1989 (%)
Year house built - Built 1970 to 1979 (%)
Year house built - Built 1960 to 1969 (%)
Year house built - Built 1950 to 1959 (%)
Year house built - Built 1940 to 1949 (%)
Year house built - Built 1939 or earlier (%)
Average household size
Household density (households per square mile)
Average household size - White
Average household size - Black or African American
Average household size - Asian
Average household size - Hispanic or Latino
Average household size - American Indian and Alaska Native
Average household size - Multirace
Average household size - Other Race
Occupied housing units (%)
Vacant housing units (%)
Owner occupied housing units (%)
Renter occupied housing units (%)
Vacancy status - For rent (%)
Vacancy status - For sale only (%)
Vacancy status - Rented or sold, not occupied (%)
Vacancy status - For seasonal, recreational, or occasional use (%)
Vacancy status - For migrant workers (%)
Vacancy status - Other vacant (%)
Residents with income below the poverty level (%)
Residents with income below 50% of the poverty level (%)
Children below poverty level (%)
Poor families by family type - Married-couple family (%)
Poor families by family type - Male, no wife present (%)
Poor families by family type - Female, no husband present (%)
Poverty status for native-born residents (%)
Poverty status for foreign-born residents (%)
Poverty among high school graduates not in families (%)
Poverty among people who did not graduate high school not in families (%)
Residents with income below the poverty level (%) - White
Residents with income below the poverty level (%) - Black or African American
Residents with income below the poverty level (%) - Asian
Residents with income below the poverty level (%) - Hispanic or Latino
Residents with income below the poverty level (%) - American Indian and Alaska Native
Residents with income below the poverty level (%) - Multirace
Residents with income below the poverty level (%) - Other Race
Air pollution - Air Quality Index (AQI)
Air pollution - CO
Air pollution - NO2
Air pollution - SO2
Air pollution - Ozone
Air pollution - PM10
Air pollution - PM25
Air pollution - Pb
Crime - Murders per 100,000 population
Crime - Rapes per 100,000 population
Crime - Robberies per 100,000 population
Crime - Assaults per 100,000 population
Crime - Burglaries per 100,000 population
Crime - Thefts per 100,000 population
Crime - Auto thefts per 100,000 population
Crime - Arson per 100,000 population
Crime - City-data.com crime index
Crime - Violent crime index
Crime - Property crime index
Crime - Murders per 100,000 population (5 year average)
Crime - Rapes per 100,000 population (5 year average)
Crime - Robberies per 100,000 population (5 year average)
Crime - Assaults per 100,000 population (5 year average)
Crime - Burglaries per 100,000 population (5 year average)
Crime - Thefts per 100,000 population (5 year average)
Crime - Auto thefts per 100,000 population (5 year average)
Crime - Arson per 100,000 population (5 year average)
Crime - City-data.com crime index (5 year average)
Crime - Violent crime index (5 year average)
Crime - Property crime index (5 year average)
1996 Presidential Elections Results (%) - Democratic Party (Clinton)
1996 Presidential Elections Results (%) - Republican Party (Dole)
1996 Presidential Elections Results (%) - Other
2000 Presidential Elections Results (%) - Democratic Party (Gore)
2000 Presidential Elections Results (%) - Republican Party (Bush)
2000 Presidential Elections Results (%) - Other
2004 Presidential Elections Results (%) - Democratic Party (Kerry)
2004 Presidential Elections Results (%) - Republican Party (Bush)
2004 Presidential Elections Results (%) - Other
2008 Presidential Elections Results (%) - Democratic Party (Obama)
2008 Presidential Elections Results (%) - Republican Party (McCain)
2008 Presidential Elections Results (%) - Other
2012 Presidential Elections Results (%) - Democratic Party (Obama)
2012 Presidential Elections Results (%) - Republican Party (Romney)
2012 Presidential Elections Results (%) - Other
2016 Presidential Elections Results (%) - Democratic Party (Clinton)
2016 Presidential Elections Results (%) - Republican Party (Trump)
2016 Presidential Elections Results (%) - Other
2020 Presidential Elections Results (%) - Democratic Party (Biden)
2020 Presidential Elections Results (%) - Republican Party (Trump)
2020 Presidential Elections Results (%) - Other
Ancestries Reported - Arab (%)
Ancestries Reported - Czech (%)
Ancestries Reported - Danish (%)
Ancestries Reported - Dutch (%)
Ancestries Reported - English (%)
Ancestries Reported - French (%)
Ancestries Reported - French Canadian (%)
Ancestries Reported - German (%)
Ancestries Reported - Greek (%)
Ancestries Reported - Hungarian (%)
Ancestries Reported - Irish (%)
Ancestries Reported - Italian (%)
Ancestries Reported - Lithuanian (%)
Ancestries Reported - Norwegian (%)
Ancestries Reported - Polish (%)
Ancestries Reported - Portuguese (%)
Ancestries Reported - Russian (%)
Ancestries Reported - Scotch-Irish (%)
Ancestries Reported - Scottish (%)
Ancestries Reported - Slovak (%)
Ancestries Reported - Subsaharan African (%)
Ancestries Reported - Swedish (%)
Ancestries Reported - Swiss (%)
Ancestries Reported - Ukrainian (%)
Ancestries Reported - United States (%)
Ancestries Reported - Welsh (%)
Ancestries Reported - West Indian (%)
Ancestries Reported - Other (%)
Educational Attainment - No schooling completed (%)
Educational Attainment - Less than high school (%)
Educational Attainment - High school or equivalent (%)
Educational Attainment - Less than 1 year of college (%)
Educational Attainment - 1 or more years of college (%)
Educational Attainment - Associate degree (%)
Educational Attainment - Bachelor's degree (%)
Educational Attainment - Master's degree (%)
Educational Attainment - Professional school degree (%)
Educational Attainment - Doctorate degree (%)
School Enrollment - Nursery, preschool (%)
School Enrollment - Kindergarten (%)
School Enrollment - Grade 1 to 4 (%)
School Enrollment - Grade 5 to 8 (%)
School Enrollment - Grade 9 to 12 (%)
School Enrollment - College undergrad (%)
School Enrollment - Graduate or professional (%)
School Enrollment - Not enrolled in school (%)
School enrollment - Public schools (%)
School enrollment - Private schools (%)
School enrollment - Not enrolled (%)
Median number of rooms in houses and condos
Median number of rooms in apartments
Housing units lacking complete plumbing facilities (%)
Housing units lacking complete kitchen facilities (%)
Density of houses
Urban houses (%)
Rural houses (%)
Households with people 60 years and over (%)
Households with people 65 years and over (%)
Households with people 75 years and over (%)
Households with one or more nonrelatives (%)
Households with no nonrelatives (%)
Population in households (%)
Family households (%)
Nonfamily households (%)
Population in families (%)
Family households with own children (%)
Median number of bedrooms in owner occupied houses
Mean number of bedrooms in owner occupied houses
Median number of bedrooms in renter occupied houses
Mean number of bedrooms in renter occupied houses
Median number of vehichles in owner occupied houses
Mean number of vehichles in owner occupied houses
Median number of vehichles in renter occupied houses
Mean number of vehichles in renter occupied houses
Mortgage status - with mortgage (%)
Mortgage status - with second mortgage (%)
Mortgage status - with home equity loan (%)
Mortgage status - with both second mortgage and home equity loan (%)
Mortgage status - without a mortgage (%)
Average family size
Average family size - White
Average family size - Black or African American
Average family size - Asian
Average family size - Hispanic or Latino
Average family size - American Indian and Alaska Native
Average family size - Multirace
Average family size - Other Race
Geographical mobility - Same house 1 year ago (%)
Geographical mobility - Moved within same county (%)
Geographical mobility - Moved from different county within same state (%)
Geographical mobility - Moved from different state (%)
Geographical mobility - Moved from abroad (%)
Place of birth - Born in state of residence (%)
Place of birth - Born in other state (%)
Place of birth - Native, outside of US (%)
Place of birth - Foreign born (%)
Housing units in structures - 1, detached (%)
Housing units in structures - 1, attached (%)
Housing units in structures - 2 (%)
Housing units in structures - 3 or 4 (%)
Housing units in structures - 5 to 9 (%)
Housing units in structures - 10 to 19 (%)
Housing units in structures - 20 to 49 (%)
Housing units in structures - 50 or more (%)
Housing units in structures - Mobile home (%)
Housing units in structures - Boat, RV, van, etc. (%)
House/condo owner moved in on average (years ago)
Renter moved in on average (years ago)
Year householder moved into unit - Moved in 1999 to March 2000 (%)
Year householder moved into unit - Moved in 1995 to 1998 (%)
Year householder moved into unit - Moved in 1990 to 1994 (%)
Year householder moved into unit - Moved in 1980 to 1989 (%)
Year householder moved into unit - Moved in 1970 to 1979 (%)
Year householder moved into unit - Moved in 1969 or earlier (%)
Means of transportation to work - Drove car alone (%)
Means of transportation to work - Carpooled (%)
Means of transportation to work - Public transportation (%)
Means of transportation to work - Bus or trolley bus (%)
Means of transportation to work - Streetcar or trolley car (%)
Means of transportation to work - Subway or elevated (%)
Means of transportation to work - Railroad (%)
Means of transportation to work - Ferryboat (%)
Means of transportation to work - Taxicab (%)
Means of transportation to work - Motorcycle (%)
Means of transportation to work - Bicycle (%)
Means of transportation to work - Walked (%)
Means of transportation to work - Other means (%)
Working at home (%)
Industry diversity
Most Common Industries - Agriculture, forestry, fishing and hunting, and mining (%)
Most Common Industries - Agriculture, forestry, fishing and hunting (%)
Most Common Industries - Mining, quarrying, and oil and gas extraction (%)
Most Common Industries - Construction (%)
Most Common Industries - Manufacturing (%)
Most Common Industries - Wholesale trade (%)
Most Common Industries - Retail trade (%)
Most Common Industries - Transportation and warehousing, and utilities (%)
Most Common Industries - Transportation and warehousing (%)
Most Common Industries - Utilities (%)
Most Common Industries - Information (%)
Most Common Industries - Finance and insurance, and real estate and rental and leasing (%)
Most Common Industries - Finance and insurance (%)
Most Common Industries - Real estate and rental and leasing (%)
Most Common Industries - Professional, scientific, and management, and administrative and waste management services (%)
Most Common Industries - Professional, scientific, and technical services (%)
Most Common Industries - Management of companies and enterprises (%)
Most Common Industries - Administrative and support and waste management services (%)
Most Common Industries - Educational services, and health care and social assistance (%)
Most Common Industries - Educational services (%)
Most Common Industries - Health care and social assistance (%)
Most Common Industries - Arts, entertainment, and recreation, and accommodation and food services (%)
Most Common Industries - Arts, entertainment, and recreation (%)
Most Common Industries - Accommodation and food services (%)
Most Common Industries - Other services, except public administration (%)
Most Common Industries - Public administration (%)
Occupation diversity
Most Common Occupations - Management, business, science, and arts occupations (%)
Most Common Occupations - Management, business, and financial occupations (%)
Most Common Occupations - Management occupations (%)
Most Common Occupations - Business and financial operations occupations (%)
Most Common Occupations - Computer, engineering, and science occupations (%)
Most Common Occupations - Computer and mathematical occupations (%)
Most Common Occupations - Architecture and engineering occupations (%)
Most Common Occupations - Life, physical, and social science occupations (%)
Most Common Occupations - Education, legal, community service, arts, and media occupations (%)
Most Common Occupations - Community and social service occupations (%)
Most Common Occupations - Legal occupations (%)
Most Common Occupations - Education, training, and library occupations (%)
Most Common Occupations - Arts, design, entertainment, sports, and media occupations (%)
Most Common Occupations - Healthcare practitioners and technical occupations (%)
Most Common Occupations - Health diagnosing and treating practitioners and other technical occupations (%)
Most Common Occupations - Health technologists and technicians (%)
Most Common Occupations - Service occupations (%)
Most Common Occupations - Healthcare support occupations (%)
Most Common Occupations - Protective service occupations (%)
Most Common Occupations - Fire fighting and prevention, and other protective service workers including supervisors (%)
Most Common Occupations - Law enforcement workers including supervisors (%)
Most Common Occupations - Food preparation and serving related occupations (%)
Most Common Occupations - Building and grounds cleaning and maintenance occupations (%)
Most Common Occupations - Personal care and service occupations (%)
Most Common Occupations - Sales and office occupations (%)
Most Common Occupations - Sales and related occupations (%)
Most Common Occupations - Office and administrative support occupations (%)
Most Common Occupations - Natural resources, construction, and maintenance occupations (%)
Most Common Occupations - Farming, fishing, and forestry occupations (%)
Most Common Occupations - Construction and extraction occupations (%)
Most Common Occupations - Installation, maintenance, and repair occupations (%)
Most Common Occupations - Production, transportation, and material moving occupations (%)
Most Common Occupations - Production occupations (%)
Most Common Occupations - Transportation occupations (%)
Most Common Occupations - Material moving occupations (%)
People in Group quarters - Institutionalized population (%)
People in Group quarters - Correctional institutions (%)
People in Group quarters - Federal prisons and detention centers (%)
People in Group quarters - Halfway houses (%)
People in Group quarters - Local jails and other confinement facilities (including police lockups) (%)
People in Group quarters - Military disciplinary barracks (%)
People in Group quarters - State prisons (%)
People in Group quarters - Other types of correctional institutions (%)
People in Group quarters - Nursing homes (%)
People in Group quarters - Hospitals/wards, hospices, and schools for the handicapped (%)
People in Group quarters - Hospitals/wards and hospices for chronically ill (%)
People in Group quarters - Hospices or homes for chronically ill (%)
People in Group quarters - Military hospitals or wards for chronically ill (%)
People in Group quarters - Other hospitals or wards for chronically ill (%)
People in Group quarters - Hospitals or wards for drug/alcohol abuse (%)
People in Group quarters - Mental (Psychiatric) hospitals or wards (%)
People in Group quarters - Schools, hospitals, or wards for the mentally retarded (%)
People in Group quarters - Schools, hospitals, or wards for the physically handicapped (%)
People in Group quarters - Institutions for the deaf (%)
People in Group quarters - Institutions for the blind (%)
People in Group quarters - Orthopedic wards and institutions for the physically handicapped (%)
People in Group quarters - Wards in general hospitals for patients who have no usual home elsewhere (%)
People in Group quarters - Wards in military hospitals for patients who have no usual home elsewhere (%)
People in Group quarters - Juvenile institutions (%)
People in Group quarters - Long-term care (%)
People in Group quarters - Homes for abused, dependent, and neglected children (%)
People in Group quarters - Residential treatment centers for emotionally disturbed children (%)
People in Group quarters - Training schools for juvenile delinquents (%)
People in Group quarters - Short-term care, detention or diagnostic centers for delinquent children (%)
People in Group quarters - Type of juvenile institution unknown (%)
People in Group quarters - Noninstitutionalized population (%)
People in Group quarters - College dormitories (includes college quarters off campus) (%)
People in Group quarters - Military quarters (%)
People in Group quarters - On base (%)
People in Group quarters - Barracks, unaccompanied personnel housing (UPH), (Enlisted/Officer), ;and similar group living quarters for military personnel (%)
People in Group quarters - Transient quarters for temporary residents (%)
People in Group quarters - Military ships (%)
People in Group quarters - Group homes (%)
People in Group quarters - Homes or halfway houses for drug/alcohol abuse (%)
People in Group quarters - Homes for the mentally ill (%)
People in Group quarters - Homes for the mentally retarded (%)
People in Group quarters - Homes for the physically handicapped (%)
People in Group quarters - Other group homes (%)
People in Group quarters - Religious group quarters (%)
People in Group quarters - Dormitories (%)
People in Group quarters - Agriculture workers' dormitories on farms (%)
People in Group quarters - Job Corps and vocational training facilities (%)
People in Group quarters - Other workers' dormitories (%)
People in Group quarters - Crews of maritime vessels (%)
People in Group quarters - Other nonhousehold living situations (%)
People in Group quarters - Other noninstitutional group quarters (%)
Residents speaking English at home (%)
Residents speaking English at home - Born in the United States (%)
Residents speaking English at home - Native, born elsewhere (%)
Residents speaking English at home - Foreign born (%)
Residents speaking Spanish at home (%)
Residents speaking Spanish at home - Born in the United States (%)
Residents speaking Spanish at home - Native, born elsewhere (%)
Residents speaking Spanish at home - Foreign born (%)
Residents speaking other language at home (%)
Residents speaking other language at home - Born in the United States (%)
Residents speaking other language at home - Native, born elsewhere (%)
Residents speaking other language at home - Foreign born (%)
Class of Workers - Employee of private company (%)
Class of Workers - Self-employed in own incorporated business (%)
Class of Workers - Private not-for-profit wage and salary workers (%)
Class of Workers - Local government workers (%)
Class of Workers - State government workers (%)
Class of Workers - Federal government workers (%)
Class of Workers - Self-employed workers in own not incorporated business and Unpaid family workers (%)
House heating fuel used in houses and condos - Utility gas (%)
House heating fuel used in houses and condos - Bottled, tank, or LP gas (%)
House heating fuel used in houses and condos - Electricity (%)
House heating fuel used in houses and condos - Fuel oil, kerosene, etc. (%)
House heating fuel used in houses and condos - Coal or coke (%)
House heating fuel used in houses and condos - Wood (%)
House heating fuel used in houses and condos - Solar energy (%)
House heating fuel used in houses and condos - Other fuel (%)
House heating fuel used in houses and condos - No fuel used (%)
House heating fuel used in apartments - Utility gas (%)
House heating fuel used in apartments - Bottled, tank, or LP gas (%)
House heating fuel used in apartments - Electricity (%)
House heating fuel used in apartments - Fuel oil, kerosene, etc. (%)
House heating fuel used in apartments - Coal or coke (%)
House heating fuel used in apartments - Wood (%)
House heating fuel used in apartments - Solar energy (%)
House heating fuel used in apartments - Other fuel (%)
House heating fuel used in apartments - No fuel used (%)
Armed forces status - In Armed Forces (%)
Armed forces status - Civilian (%)
Armed forces status - Civilian - Veteran (%)
Armed forces status - Civilian - Nonveteran (%)
Fatal accidents locations in years 2005-2021
Fatal accidents locations in 2005
Fatal accidents locations in 2006
Fatal accidents locations in 2007
Fatal accidents locations in 2008
Fatal accidents locations in 2009
Fatal accidents locations in 2010
Fatal accidents locations in 2011
Fatal accidents locations in 2012
Fatal accidents locations in 2013
Fatal accidents locations in 2014
Fatal accidents locations in 2015
Fatal accidents locations in 2016
Fatal accidents locations in 2017
Fatal accidents locations in 2018
Fatal accidents locations in 2019
Fatal accidents locations in 2020
Fatal accidents locations in 2021
Alcohol use - People drinking some alcohol every month (%)
Alcohol use - People not drinking at all (%)
Alcohol use - Average days/month drinking alcohol
Alcohol use - Average drinks/week
Alcohol use - Average days/year people drink much
Audiometry - Average condition of hearing (%)
Audiometry - People that can hear a whisper from across a quiet room (%)
Audiometry - People that can hear normal voice from across a quiet room (%)
Audiometry - Ears ringing, roaring, buzzing (%)
Audiometry - Had a job exposure to loud noise (%)
Audiometry - Had off-work exposure to loud noise (%)
Blood Pressure & Cholesterol - Has high blood pressure (%)
Blood Pressure & Cholesterol - Checking blood pressure at home (%)
Blood Pressure & Cholesterol - Frequently checking blood cholesterol (%)
Blood Pressure & Cholesterol - Has high cholesterol level (%)
Consumer Behavior - Money monthly spent on food at supermarket/grocery store
Consumer Behavior - Money monthly spent on food at other stores
Consumer Behavior - Money monthly spent on eating out
Consumer Behavior - Money monthly spent on carryout/delivered foods
Consumer Behavior - Income spent on food at supermarket/grocery store (%)
Consumer Behavior - Income spent on food at other stores (%)
Consumer Behavior - Income spent on eating out (%)
Consumer Behavior - Income spent on carryout/delivered foods (%)
Current Health Status - General health condition (%)
Current Health Status - Blood donors (%)
Current Health Status - Has blood ever tested for HIV virus (%)
Current Health Status - Left-handed people (%)
Dermatology - People using sunscreen (%)
Diabetes - Diabetics (%)
Diabetes - Had a blood test for high blood sugar (%)
Diabetes - People taking insulin (%)
Diet Behavior & Nutrition - Diet health (%)
Diet Behavior & Nutrition - Milk product consumption (# of products/month)
Diet Behavior & Nutrition - Meals not home prepared (#/week)
Diet Behavior & Nutrition - Meals from fast food or pizza place (#/week)
Diet Behavior & Nutrition - Ready-to-eat foods (#/month)
Diet Behavior & Nutrition - Frozen meals/pizza (#/month)
Drug Use - People that ever used marijuana or hashish (%)
Drug Use - Ever used hard drugs (%)
Drug Use - Ever used any form of cocaine (%)
Drug Use - Ever used heroin (%)
Drug Use - Ever used methamphetamine (%)
Health Insurance - People covered by health insurance (%)
Kidney Conditions-Urology - Avg. # of times urinating at night
Medical Conditions - People with asthma (%)
Medical Conditions - People with anemia (%)
Medical Conditions - People with psoriasis (%)
Medical Conditions - People with overweight (%)
Medical Conditions - Elderly people having difficulties in thinking or remembering (%)
Medical Conditions - People who ever received blood transfusion (%)
Medical Conditions - People having trouble seeing even with glass/contacts (%)
Medical Conditions - People with arthritis (%)
Medical Conditions - People with gout (%)
Medical Conditions - People with congestive heart failure (%)
Medical Conditions - People with coronary heart disease (%)
Medical Conditions - People with angina pectoris (%)
Medical Conditions - People who ever had heart attack (%)
Medical Conditions - People who ever had stroke (%)
Medical Conditions - People with emphysema (%)
Medical Conditions - People with thyroid problem (%)
Medical Conditions - People with chronic bronchitis (%)
Medical Conditions - People with any liver condition (%)
Medical Conditions - People who ever had cancer or malignancy (%)
Mental Health - People who have little interest in doing things (%)
Mental Health - People feeling down, depressed, or hopeless (%)
Mental Health - People who have trouble sleeping or sleeping too much (%)
Mental Health - People feeling tired or having little energy (%)
Mental Health - People with poor appetite or overeating (%)
Mental Health - People feeling bad about themself (%)
Mental Health - People who have trouble concentrating on things (%)
Mental Health - People moving or speaking slowly or too fast (%)
Mental Health - People having thoughts they would be better off dead (%)
Oral Health - Average years since last visit a dentist
Oral Health - People embarrassed because of mouth (%)
Oral Health - People with gum disease (%)
Oral Health - General health of teeth and gums (%)
Oral Health - Average days a week using dental floss/device
Oral Health - Average days a week using mouthwash for dental problem
Oral Health - Average number of teeth
Pesticide Use - Households using pesticides to control insects (%)
Pesticide Use - Households using pesticides to kill weeds (%)
Physical Activity - People doing vigorous-intensity work activities (%)
Physical Activity - People doing moderate-intensity work activities (%)
Physical Activity - People walking or bicycling (%)
Physical Activity - People doing vigorous-intensity recreational activities (%)
Physical Activity - People doing moderate-intensity recreational activities (%)
Physical Activity - Average hours a day doing sedentary activities
Physical Activity - Average hours a day watching TV or videos
Physical Activity - Average hours a day using computer
Physical Functioning - People having limitations keeping them from working (%)
Physical Functioning - People limited in amount of work they can do (%)
Physical Functioning - People that need special equipment to walk (%)
Physical Functioning - People experiencing confusion/memory problems (%)
Physical Functioning - People requiring special healthcare equipment (%)
Prescription Medications - Average number of prescription medicines taking
Preventive Aspirin Use - Adults 40+ taking low-dose aspirin (%)
Reproductive Health - Vaginal deliveries (%)
Reproductive Health - Cesarean deliveries (%)
Reproductive Health - Deliveries resulted in a live birth (%)
Reproductive Health - Pregnancies resulted in a delivery (%)
Reproductive Health - Women breastfeeding newborns (%)
Reproductive Health - Women that had a hysterectomy (%)
Reproductive Health - Women that had both ovaries removed (%)
Reproductive Health - Women that have ever taken birth control pills (%)
Reproductive Health - Women taking birth control pills (%)
Reproductive Health - Women that have ever used Depo-Provera or injectables (%)
Reproductive Health - Women that have ever used female hormones (%)
Sexual Behavior - People 18+ that ever had sex (vaginal, anal, or oral) (%)
Sexual Behavior - Males 18+ that ever had vaginal sex with a woman (%)
Sexual Behavior - Males 18+ that ever performed oral sex on a woman (%)
Sexual Behavior - Males 18+ that ever had anal sex with a woman (%)
Sexual Behavior - Males 18+ that ever had any sex with a man (%)
Sexual Behavior - Females 18+ that ever had vaginal sex with a man (%)
Sexual Behavior - Females 18+ that ever performed oral sex on a man (%)
Sexual Behavior - Females 18+ that ever had anal sex with a man (%)
Sexual Behavior - Females 18+ that ever had any kind of sex with a woman (%)
Sexual Behavior - Average age people first had sex
Sexual Behavior - Average number of female sex partners in lifetime (males 18+)
Sexual Behavior - Average number of female vaginal sex partners in lifetime (males 18+)
Sexual Behavior - Average age people first performed oral sex on a woman (18+)
Sexual Behavior - Average number of woman performed oral sex on in lifetime (18+)
Sexual Behavior - Average number of male sex partners in lifetime (males 18+)
Sexual Behavior - Average number of male anal sex partners in lifetime (males 18+)
Sexual Behavior - Average age people first performed oral sex on a man (18+)
Sexual Behavior - Average number of male oral sex partners in lifetime (18+)
Sexual Behavior - People using protection when performing oral sex (%)
Sexual Behavior - Average number of times people have vaginal or anal sex a year
Sexual Behavior - People having sex without condom (%)
Sexual Behavior - Average number of male sex partners in lifetime (females 18+)
Sexual Behavior - Average number of male vaginal sex partners in lifetime (females 18+)
Sexual Behavior - Average number of female sex partners in lifetime (females 18+)
Sexual Behavior - Circumcised males 18+ (%)
Sleep Disorders - Average hours sleeping at night
Sleep Disorders - People that has trouble sleeping (%)
Smoking-Cigarette Use - People smoking cigarettes (%)
Taste & Smell - People 40+ having problems with smell (%)
Taste & Smell - People 40+ having problems with taste (%)
Taste & Smell - People 40+ that ever had wisdom teeth removed (%)
Taste & Smell - People 40+ that ever had tonsils teeth removed (%)
Taste & Smell - People 40+ that ever had a loss of consciousness because of a head injury (%)
Taste & Smell - People 40+ that ever had a broken nose or other serious injury to face or skull (%)
Taste & Smell - People 40+ that ever had two or more sinus infections (%)
Weight - Average height (inches)
Weight - Average weight (pounds)
Weight - Average BMI
Weight - People that are obese (%)
Weight - People that ever were obese (%)
Weight - People trying to lose weight (%)
Urban population: 15,036
Rural population: 4,103
Estimated median house/condo value in 2022: $262,974
18067:
$262,974Pennsylvania:
$245,500
According to our research of Pennsylvania and other state lists, there were 17 registered sex offenders living in 18067 zip code as of April 27, 2024 . The ratio of all residents to sex offenders in zip code 18067 is 1,099 to 1.The ratio of registered sex offenders to all residents in this zip code is lower than the state average.
Median resident age: This zip code:
45.2 yearsPennsylvania median age:
40.9 years
Average household size: This zip code:
2.4 peoplePennsylvania:
2.4 people
Averages for the 2020 tax year for zip code 18067, filed in 2021:
Average Adjusted Gross Income (AGI) in 2020: $64,837 (Individual Income Tax Returns) Here:
$64,837State:
$75,707
Salary/wage: $56,792 (reported on 80.7% of returns )Here:
$56,792State:
$62,806
(% of AGI for various income ranges: 1027.5% for AGIs below $25k , 3339.3% for AGIs $25k-50k , 6184.1% for AGIs $50k-75k , 8673.5% for AGIs $75k-100k , 16129.8% for AGIs $100k-200k , 71401.2% for AGIs over 200k ) Taxable interest for individuals: $1,008 (reported on 32.7% of returns )This zip code:
$1,008Pennsylvania:
$1,633
(% of AGI for various income ranges: 18.2% for AGIs below $25k , 24.5% for AGIs $25k-50k , 39.7% for AGIs $50k-75k , 55.8% for AGIs $75k-100k , 63.3% for AGIs $100k-200k , 1133.8% for AGIs over 200k ) Ordinary dividends: $3,998 (reported on 22.5% of returns )(% of AGI for various income ranges: 38.6% for AGIs below $25k , 45.3% for AGIs $25k-50k , 79.6% for AGIs $50k-75k , 121.1% for AGIs $75k-100k , 223.0% for AGIs $100k-200k , 4056.2% for AGIs over 200k ) Net capital gain/loss in AGI: +$9,788 (reported on 17.7% of returns )Here:
+$9,788State:
+$23,522
(% of AGI for various income ranges: 6.4% for AGIs below $25k , 28.5% for AGIs $25k-50k , 69.7% for AGIs $50k-75k , 102.0% for AGIs $75k-100k , 252.7% for AGIs $100k-200k , 16328.8% for AGIs over 200k ) Profit/loss from business: +$12,188 (reported on 9.8% of returns )Here:
+$12,188State:
+$16,274
(% of AGI for various income ranges: 65.2% for AGIs below $25k , 74.5% for AGIs $25k-50k , 114.0% for AGIs $50k-75k , 137.8% for AGIs $75k-100k , 276.4% for AGIs $100k-200k , 5082.5% for AGIs over 200k ) Taxable individual retirement arrangement distribution: $16,789 (reported on 12.2% of returns )18067:
$16,789Pennsylvania:
$18,583
(% of AGI for various income ranges: 95.0% for AGIs below $25k , 122.9% for AGIs $25k-50k , 213.6% for AGIs $50k-75k , 372.6% for AGIs $75k-100k , 692.1% for AGIs $100k-200k , 4152.5% for AGIs over 200k ) Self-employed (Keogh) retirement plans: $9,667 (reported on 0.3% of returns )18067:
$9,667Pennsylvania:
$25,407
(% of AGI for various income ranges: 21.2% for AGIs $50k-75k ) Total itemized deductions: $26,773 (reported on 6.2% of returns )Here:
$26,773State:
$34,850
(% of AGI for various income ranges: 55.5% for AGIs below $25k , 75.9% for AGIs $25k-50k , 266.8% for AGIs $50k-75k , 332.0% for AGIs $75k-100k , 403.9% for AGIs $100k-200k , 4736.2% for AGIs over 200k ) Charity contributions: $5,489 (reported on 4.4% of returns )(% of AGI for various income ranges: 3.1% for AGIs below $25k , 7.5% for AGIs $25k-50k , 27.4% for AGIs $50k-75k , 40.4% for AGIs $75k-100k , 77.2% for AGIs $100k-200k , 938.7% for AGIs over 200k ) Taxes paid: $7,368 (reported on 6.2% of returns )(% of AGI for various income ranges: 8.4% for AGIs below $25k , 17.9% for AGIs $25k-50k , 78.9% for AGIs $50k-75k , 121.5% for AGIs $75k-100k , 136.6% for AGIs $100k-200k , 750.0% for AGIs over 200k ) Earned income credit: $1,990 (reported on 10.0% of returns )(% of AGI for various income ranges: 58.5% for AGIs below $25k , 47.8% for AGIs $25k-50k , 0.7% for AGIs $50k-75k ) Percentage of individuals using paid preparers for their 2020 taxes: 90.3%(% for various income ranges: 88.1% for AGIs below $25k , 91.5% for AGIs $25k-50k , 90.7% for AGIs $50k-75k , 91.2% for AGIs $75k-100k , 91.4% for AGIs $100k-200k , 89.3% for AGIs over 200k )
Averages for the 2012 tax year for zip code 18067, filed in 2013:
Average Adjusted Gross Income (AGI) in 2012: $53,681 (Individual Income Tax Returns) Here:
$53,681State:
$61,346
Salary/wage: $49,161 (reported on 82.8% of returns )Here:
$49,161State:
$51,902
(% of AGI for various income ranges: 63.9% for AGIs below $25k , 78.2% for AGIs $25k-50k , 77.8% for AGIs $50k-75k , 80.1% for AGIs $75k-100k , 81.4% for AGIs $100k-200k , 51.3% for AGIs over 200k ) Taxable interest for individuals: $839 (reported on 40.3% of returns )This zip code:
$839Pennsylvania:
$1,588
(% of AGI for various income ranges: 1.8% for AGIs below $25k , 0.7% for AGIs $25k-50k , 0.5% for AGIs $50k-75k , 0.4% for AGIs $75k-100k , 0.4% for AGIs $100k-200k , 1.0% for AGIs over 200k ) Ordinary dividends: $2,891 (reported on 25.8% of returns )(% of AGI for various income ranges: 2.4% for AGIs below $25k , 1.3% for AGIs $25k-50k , 1.2% for AGIs $50k-75k , 0.7% for AGIs $75k-100k , 1.4% for AGIs $100k-200k , 2.7% for AGIs over 200k ) Net capital gain/loss in AGI: +$3,055 (reported on 15.9% of returns )Here:
+$3,055State:
+$14,495
(% of AGI for various income ranges: 0.2% for AGIs $50k-75k , 0.4% for AGIs $75k-100k , 0.6% for AGIs $100k-200k , 7.1% for AGIs over 200k ) Profit/loss from business: +$12,382 (reported on 9.9% of returns )Here:
+$12,382State:
+$16,268
(% of AGI for various income ranges: 4.1% for AGIs below $25k , 2.0% for AGIs $25k-50k , 1.5% for AGIs $50k-75k , 1.5% for AGIs $75k-100k , 2.3% for AGIs $100k-200k , 4.7% for AGIs over 200k ) Taxable individual retirement arrangement distribution: $10,836 (reported on 13.6% of returns )18067:
$10,836Pennsylvania:
$14,550
(% of AGI for various income ranges: 5.4% for AGIs below $25k , 2.8% for AGIs $25k-50k , 2.7% for AGIs $50k-75k , 2.4% for AGIs $75k-100k , 2.6% for AGIs $100k-200k , 1.9% for AGIs over 200k ) Self-employment retirement plans: $14,667 (reported on 0.3% of returns )18067:
$14,667Pennsylvania:
$20,922
Total itemized deductions: $18,783 (21% of AGI, reported on 37.0% of returns )Here:
$18,783State:
$23,538
Here:
21.1% of AGIState:
18.4% of AGI
(% of AGI for various income ranges: 11.1% for AGIs below $25k , 11.0% for AGIs $25k-50k , 13.1% for AGIs $50k-75k , 13.5% for AGIs $75k-100k , 14.5% for AGIs $100k-200k , 11.5% for AGIs over 200k ) Charity contributions: $1,989 (reported on 29.2% of returns )(% of AGI for various income ranges: 0.7% for AGIs below $25k , 0.8% for AGIs $25k-50k , 1.0% for AGIs $50k-75k , 1.0% for AGIs $75k-100k , 1.3% for AGIs $100k-200k , 1.4% for AGIs over 200k ) Taxes paid: $7,915 (reported on 36.8% of returns )(% of AGI for various income ranges: 2.7% for AGIs below $25k , 4.1% for AGIs $25k-50k , 5.1% for AGIs $50k-75k , 5.9% for AGIs $75k-100k , 6.7% for AGIs $100k-200k , 5.6% for AGIs over 200k ) Earned income credit: $1,833 (reported on 10.9% of returns )(% of AGI for various income ranges: 3.5% for AGIs below $25k , 0.7% for AGIs $25k-50k ) Percentage of individuals using paid preparers for their 2012 taxes: 52.8%(% for various income ranges: 47.9% for AGIs below $25k , 50.4% for AGIs $25k-50k , 56.7% for AGIs $50k-75k , 56.6% for AGIs $75k-100k , 60.7% for AGIs $100k-200k , 69.2% for AGIs over 200k )
Averages for the 2004 tax year for zip code 18067, filed in 2005:
Average Adjusted Gross Income (AGI) in 2004: $44,356 (Individual Income Tax Returns) Here:
$44,356State:
$48,049
Salary/wage: $41,946 (reported on 84.9% of returns )Here:
$41,946State:
$42,646
(% of AGI for various income ranges: 86.4% for AGIs below $10k , 66.6% for AGIs $10k-25k , 83.5% for AGIs $25k-50k , 85.4% for AGIs $50k-75k , 88.0% for AGIs $75k-100k , 68.8% for AGIs over 100k ) Taxable interest for individuals: $1,152 (reported on 55.0% of returns )This zip code:
$1,152Pennsylvania:
$1,657
(% of AGI for various income ranges: 5.2% for AGIs below $10k , 3.7% for AGIs $10k-25k , 1.4% for AGIs $25k-50k , 1.1% for AGIs $50k-75k , 0.8% for AGIs $75k-100k , 1.3% for AGIs over 100k ) Taxable dividends: $1,759 (reported on 29.9% of returns )(% of AGI for various income ranges: 6.0% for AGIs below $10k , 2.3% for AGIs $10k-25k , 0.8% for AGIs $25k-50k , 0.7% for AGIs $50k-75k , 0.7% for AGIs $75k-100k , 1.8% for AGIs over 100k ) Net capital gain/loss: +$3,486 (reported on 20.6% of returns )Here:
+$3,486State:
+$9,716
(% of AGI for various income ranges: -2.6% for AGIs below $10k , -0.2% for AGIs $10k-25k , 0.5% for AGIs $25k-50k , 0.6% for AGIs $50k-75k , 0.7% for AGIs $75k-100k , 5.6% for AGIs over 100k ) Profit/loss from business: +$9,117 (reported on 10.9% of returns )Here:
+$9,117State:
+$14,267
(% of AGI for various income ranges: 1.7% for AGIs below $10k , 3.7% for AGIs $10k-25k , 2.0% for AGIs $25k-50k , 2.0% for AGIs $50k-75k , 2.2% for AGIs $75k-100k , 2.4% for AGIs over 100k ) IRA payment deduction: $2,904 (reported on 3.1% of returns )18067:
$2,904Pennsylvania:
$2,903
(% of AGI for various income ranges: 0.5% for AGIs below $10k , 0.3% for AGIs $10k-25k , 0.3% for AGIs $25k-50k , 0.2% for AGIs $50k-75k , 0.1% for AGIs $75k-100k , 0.1% for AGIs over 100k ) Self-employed pension: $10,636 (reported on 0.5% of returns )Here:
$10,636Pennsylvania:
$14,674
(% of AGI for various income ranges: 0.1% for AGIs $10k-25k , 0.1% for AGIs $75k-100k , 0.4% for AGIs over 100k ) Total itemized deductions: $15,209 (21% of AGI, reported on 37.2% of returns )Here:
$15,209State:
$18,804
Here:
20.8% of AGIState:
19.5% of AGI
(% of AGI for various income ranges: 10.8% for AGIs below $10k , 8.5% for AGIs $10k-25k , 10.9% for AGIs $25k-50k , 14.0% for AGIs $50k-75k , 15.3% for AGIs $75k-100k , 12.6% for AGIs over 100k ) Charity contributions deductions: $1,773 (2% of AGI, reported on 32.9% of returns )Here:
2.3% of AGIState:
3.3% of AGI
(% of AGI for various income ranges: 0.6% for AGIs below $10k , 0.7% for AGIs $10k-25k , 0.9% for AGIs $25k-50k , 1.2% for AGIs $50k-75k , 1.5% for AGIs $75k-100k , 2.0% for AGIs over 100k ) Total tax: $5,757 (reported on 79.0% of returns )(% of AGI for various income ranges: 2.8% for AGIs below $10k , 4.2% for AGIs $10k-25k , 7.5% for AGIs $25k-50k , 8.6% for AGIs $50k-75k , 10.2% for AGIs $75k-100k , 17.5% for AGIs over 100k ) Earned income credit: $1,369 (reported on 8.2% of returns )Percentage of individuals using paid preparers for their 2004 taxes: 55.9%(% for various income ranges: 50.9% for AGIs below $10k , 58.8% for AGIs $10k-25k , 55.3% for AGIs $25k-50k , 54.2% for AGIs $50k-75k , 59.8% for AGIs $75k-100k , 62.8% for AGIs over 100k )
Estimated median household income in 2022: This zip code:
$83,345Pennsylvania:
$71,798
Nearest zip codes: 18032 ,
18052 ,
18059 ,
18035 ,
18086 ,
18037 .
Cherryville Zip Code Map
Percentage of family households: This zip code:
43.4%Pennsylvania:
42.6%
Percentage of households with unmarried partners: This zip code:
7.0%Pennsylvania:
46.5%
Likely homosexual households (counted as self-reported same-sex unmarried-partner households)
Lesbian couples: 0.0% of all households Gay men: 0.3% of all households
Household received Food Stamps/SNAP in the past 12 months: 568Household did not receive Food Stamps/SNAP in the past 12 months: 7,345
Women who had a birth in the past 12 months: 177 (177 now married , 9 unmarried) Women who did not have a birth in the past 12 months: 3,693 (1,715 now married , 1,969 unmarried)
Housing units in zip code 18067 with a mortgage: 3,699 (443
second mortgage , 350
both second mortgage and home equity loan )
Houses without a mortgage: 174
Median monthly owner costs for units with a mortgage: $1,636
Median monthly owner costs for units without a mortgage: $674
Residents with income below the poverty level in 2022:
This zip code:
6.6%Whole state:
11.8%
Residents with income below 50% of the poverty level in 2022:
This zip code:
3.2%Whole state:
6.1%
Median number of rooms in houses and condos: Median number of rooms in apartments: Notable locations in this zip code not listed on our city pages
Click to draw/clear zip code borders Notable locations in zip code 18067: (A) , Allen Township Fire Company 1 Station 45 (B) , Northampton Fire Department Station 42 (C) , East Allen Township Fire Department Station 46 (D) . Display/hide their locations on the map
Churches in zip code 18067 include: (A) , Saint Michaels Church (B) , Saint Pauls Church (C) , Zion Church (D) , Blessed Virgin Church (E) . Display/hide their locations on the map
Cemeteries: (1) , Blessed Virgin Cemetery (2) . Display/hide their locations on the map
Lakes and reservoirs: (A) , Spring Pond (B) , Miller Slate Pond (C) , Cheesebrough Pond (D) . Display/hide their locations on the map
Streams, rivers, and creeks: (A) , Dry Run (B) , Hokendauqua Creek (C) . Display/hide their locations on the map
Parks in zip code 18067 include: (1) , Bicentennial Park (2) , Indian Trail Park (3) , Weaversville County Park (4) . Display/hide their locations on the map
Year house built (houses)
20 2020 or later755 2010 to 20191,103 2000 to 2009654 1990 to 1999780 1980 to 1989905 1970 to 1979588 1960 to 1969665 1950 to 1959213 1940 to 19492,928 1939 or earlier
Zip code 18067 household income distribution in 2022 219 Less than $10,000307 $10,000 to $14,999133 $15,000 to $19,99997 $20,000 to $24,999395 $25,000 to $29,999221 $30,000 to $34,999163 $35,000 to $39,999437 $40,000 to $44,999292 $45,000 to $49,999523 $50,000 to $59,999652 $60,000 to $74,9991,256 $75,000 to $99,9991,233 $100,000 to $124,999663 $125,000 to $149,999775 $150,000 to $199,999519 $200,000 or moreEstimate of home value of owner-occupied houses/condos in 2022 in zip code 18067 107 Less than $10,00036 $10,000 to $14,99957 $15,000 to $19,99951 $20,000 to $24,99912 $25,000 to $29,99982 $30,000 to $34,9999 $35,000 to $39,99910 $40,000 to $49,9994 $50,000 to $59,99912 $60,000 to $69,99919 $70,000 to $79,99985 $80,000 to $89,99943 $90,000 to $99,999104 $100,000 to $124,999157 $125,000 to $149,999652 $150,000 to $174,999482 $175,000 to $199,9991,021 $200,000 to $249,999999 $250,000 to $299,9991,264 $300,000 to $399,999638 $400,000 to $499,99956 $500,000 to $749,99959 $750,000 to $999,99951 $1,500,000 to $1,999,999Rent paid by renters in 2022 in zip code 18067 46 $150 to $19914 $250 to $29915 $300 to $34947 $450 to $49918 $500 to $5499 $550 to $59985 $600 to $64969 $650 to $69932 $700 to $74986 $750 to $799131 $800 to $899292 $900 to $999164 $1,000 to $1,249333 $1,250 to $1,499326 $1,500 to $1,99967 $2,000 to $2,49919 $2,500 to $2,999207 No cash rent
Median gross rent in 2022: $1,243.
Median price asked for vacant for-sale houses and condos in 2022: $198,166.
Estimated median house (or condo) value in 2022 for: White Non-Hispanic householders: $265,890American Indian or Alaska Native householders: $230,891Asian householders: $355,573Some other race householders: $334,185Two or more races householders: $260,300Hispanic or Latino householders: $234,051Estimated median house or condo value in 2022: $262,974
18067:
$262,974Pennsylvania:
$245,500
Lower value quartile - upper value quartile: $192,162 - $354,578
Mean price in 2022: Detached houses: $359,072Here:
$359,072State:
$317,202
Townhouses or other attached units: $256,188Here:
$256,188State:
$254,369
In 2-unit structures: $161,608Here:
$161,608State:
$249,182
In 3-to-4-unit structures: $306,181Here:
$306,181State:
$297,446
In 5-or-more-unit structures: $194,372Here:
$194,372State:
$320,068
Mobile homes: $86,040Here:
$86,040State:
$92,414
Occupied boats, RVs, vans, etc.: $150,724Here:
$150,724State:
$563,750
Housing units in structures:
One, detached: 4,393One, attached: 2,634Two: 3023 or 4: 1975 to 9: 26610 to 19: 19220 to 49: 17950 or more: 121Mobile homes: 263Unemployment : 2.5%
Means of transportation to work in zip code 18067 77.2% 7,431 Drove a car alone4.8% 465 Carpooled1.0% 94 Bus or trolley bus0.7% 66 Ferryboat2.4% 232 Walked1.5% 149 Other means12.2% 1,177 Worked at homeTravel time to work (commute) in zip code 18067 357 Less than 5 minutes605 5 to 9 minutes587 10 to 14 minutes769 15 to 19 minutes1,586 20 to 24 minutes1,182 25 to 29 minutes1,491 30 to 34 minutes258 35 to 39 minutes542 40 to 44 minutes477 45 to 59 minutes246 60 to 89 minutes264 90 or more minutes
Percentage of zip code residents living and working in this county: 53.0%
Household type by relationship:
Households: 19,140
Male householders: 3,790 (842 living alone ), Female householders: 4,162 (1,108 living alone )4,055 spouses (3,996 opposite-sex spouses ), 688 unmarried partners , (666 opposite-sex unmarried partners ), 4,724 children (4,520 natural , 7 adopted , 200 stepchildren ), 229 grandchildren , 281 brothers or sisters , 174 parents , 0 foster children , 234 other relatives , 734 non-relatives In group quarters: 38 (-1 institutionalized population )
Size of family households: 2,770 2-persons , 1,068 3-persons , 888 4-persons , 394 5-persons , 98 6-persons , 25 7-or-more-persons
Size of nonfamily households: 1,950 1-person , 567 2-persons , 19 3-persons , 67 4-persons , 106 5-persons
2,242 married couples with children. single-parent households (269 men , 448 women ).
91.6% of residents of 18067 zip code speak English at home. of residents speak Spanish at home (63% very well, 24% well, 13% not well ).of residents speak other Indo-European language at home (67% very well, 31% well, 2% not well ).of residents speak Asian or Pacific Island language at home (38% very well, 25% well, 37% not well ).of residents speak other language at home (26% very well, 37% well, 37% not well ).
Foreign born population: 990 (5.2%)
(78.8%
of them are naturalized citizens )
This zip code:
5.2%Whole state:
7.5%
13% Guyana 12% Dominica 8% Sri Lanka 8% Czechoslovakia (includes Czech Republic and Slovakia) 7% Saudi Arabia 5% Hong Kong 4% Uruguay 28% German 8% American 6% Irish 6% English 5% Pennsylvania German 5% Italian 3% Ukrainian
Year of entry for the foreign-born population
194 2010 or later 231 2000 to 2009 420 1990 to 1999 541 Before 1990
Facilities with environmental interests located in this zip code:
BETHLEHEM AREA VOCATIONAL TECHNICAL SCHOOL (1600 LAUBACH AVENUE in NORTHAMPTON, PA)
Small Quantity Generators, between 100 kg and 1000 kg of hazardous waste/month (Resource Conservation and Recovery Act (tracking hazardous waste)) - notification Organizations: OPERNAME (CONTACT/OPERATOR)
, CITY OF BETHLEHEM (CONTACT/OWNER)
Alternative names: BETHLEHEM AREA VO-TECH
BETHLEHEM CITY WTP (355 GRANGER RD in NORTHAMPTON, PA)
National Pollutant Discharge Elimination System NON-MAJOR (Tracking pollutant discharge elimination systems) - permit Business SIC classification: SEWERAGE SYSTEMS
500 FASHION GROUP (39 W 21ST ST in NORTHAMPTON, PA)
Small Quantity Generators, between 100 kg and 1000 kg of hazardous waste/month (Resource Conservation and Recovery Act (tracking hazardous waste)) - notification Organizations: RAPID AMERICAN CORP (CONTACT/OWNER)
Housing units lacking complete plumbing facilities: 0.7%
Housing units lacking complete kitchen facilities: 1.8%
35.6% Electricity 27.9% Fuel oil, kerosene, etc. 27.1% Utility gas 5.0% Bottled, tank, or LP gas 1.9% Coal or coke 1.3% Other fuel 0.8% Wood 0.6% No fuel used
Population in 1990: 13,792. Population change in the 1990s: +2,161 (+15.7%).
Place of birth for U.S.-born residents:
This state: 14,538Northeast: 1,958Midwest: 261South: 457West: 409
71% of the 18067 zip code residents lived in the same house 5 years ago.
Out of people who lived in different houses, 48% lived in this county.
Out of people who lived in different counties, 50% lived in Pennsylvania.
91% of the 18067 zip code residents lived in the same house 1 year ago.
Out of people who lived in different houses, 35% moved from this county.
Out of people who lived in different houses, 46% moved from different county within same state.
Out of people who lived in different houses, 18% moved from different state.
Out of people who lived in different houses, 2% moved from abroad.
Private vs. public school enrollment:
Students in private schools in grades 1 to 8 (elementary and middle school): 120
Here:
6.0%Pennsylvania:
15.7%
Students in private schools in grades 9 to 12 (high school): 12
Here:
1.6%Pennsylvania:
13.4%
Students in private undergraduate colleges: 174
Here:
29.7%Pennsylvania:
39.8%
Occupation by median earnings in the past 12 months ($)
94,187 Architecture and engineering occupations 81,393 Health diagnosing and treating practitioners and other technical occupations 72,699 Law enforcement workers including supervisors 71,793 Computer and mathematical occupations 71,131 Management occupations 68,838 Installation, maintenance, and repair occupations
Top industries in this zip code by the number of employees in 2005:
Administrative and Support and Waste Management and Remediation Services: Office Administrative Services (250-499 employees: 1 establishment, 1-4 employees: 1 establishment)Health Care and Social Assistance: Continuing Care Retirement Communities (100-249: 1, 1-4: 1)Administrative and Support and Waste Management and Remediation Services: All Other Support Services (100-249: 1)Other Services (except Public Administration): Automotive Body, Paint, and Interior Repair and Maintenance (50-99: 1, 10-19: 1, 5-9: 1)Accommodation and Food Services: Full-Service Restaurants (20-49: 1, 10-19: 2, 5-9: 1, 1-4: 4)
People in group quarters in 2010:
6 people in group homes intended for adults
People in group quarters in 2000:
80 people in other nonhousehold living situations
56 people in other noninstitutional group quarters
28 people in college dormitories (includes college quarters off campus)
8 people in religious group quarters
Fatal accident statistics in 2014:
Fatal accident count: 1Vehicles involved in fatal accidents: 2Fatal accidents caused by drunken drivers: 0Fatalities: 1Persons involved in fatal accidents: 2Pedestrians involved in fatal accidents: 0
Fatal accident statistics in 2012:
Fatal accident count: 2Vehicles involved in fatal accidents: 3Fatal accidents caused by drunken drivers: 0Fatalities: 2Persons involved in fatal accidents: 3Pedestrians involved in fatal accidents: 1
Home Mortgage Disclosure Act Aggregated Statistics For Year 2009(Based on 4 full and 8 partial tracts) A) FHA, FSA/RHS & VA B) Conventional C) Refinancings D) Home Improvement Loans E) Loans on Dwellings For 5+ Families F) Non-occupant Loans on G) Loans On Manufactured Number Average Value Number Average Value Number Average Value Number Average Value Number Average Value Number Average Value Number Average Value
LOANS ORIGINATED 231 $174,816 155 $143,225 917 $162,817 108 $56,064 4 $1,776,500 37 $109,707 15 $69,679 APPLICATIONS APPROVED, NOT ACCEPTED 1 $144,820 23 $150,694 87 $157,493 13 $36,805 2 $193,885 6 $148,633 10 $45,756 APPLICATIONS DENIED 35 $175,449 31 $115,236 327 $172,344 41 $54,244 0 $0 6 $122,367 13 $52,245 APPLICATIONS WITHDRAWN 27 $153,229 11 $188,545 202 $175,952 16 $112,059 0 $0 1 $234,170 0 $0 FILES CLOSED FOR INCOMPLETENESS 5 $135,058 2 $66,180 52 $179,912 3 $50,503 0 $0 0 $0 1 $80,340
Aggregated Statistics For Year 2008(Based on 4 full and 8 partial tracts) A) FHA, FSA/RHS & VA B) Conventional C) Refinancings D) Home Improvement Loans E) Loans on Dwellings For 5+ Families F) Non-occupant Loans on G) Loans On Manufactured Number Average Value Number Average Value Number Average Value Number Average Value Number Average Value Number Average Value Number Average Value
LOANS ORIGINATED 146 $179,739 322 $161,076 717 $141,407 197 $47,149 2 $273,380 36 $154,178 11 $93,882 APPLICATIONS APPROVED, NOT ACCEPTED 2 $139,565 35 $159,472 107 $135,691 26 $49,695 0 $0 11 $140,769 7 $52,294 APPLICATIONS DENIED 12 $186,547 37 $128,532 397 $173,922 105 $46,579 0 $0 23 $109,485 15 $74,801 APPLICATIONS WITHDRAWN 9 $208,982 25 $118,648 144 $179,726 16 $98,819 0 $0 4 $127,572 2 $84,475 FILES CLOSED FOR INCOMPLETENESS 2 $177,895 6 $148,963 26 $200,730 1 $51,060 0 $0 0 $0 0 $0
Aggregated Statistics For Year 2007(Based on 4 full and 8 partial tracts) A) FHA, FSA/RHS & VA B) Conventional C) Refinancings D) Home Improvement Loans E) Loans on Dwellings For 5+ Families F) Non-occupant Loans on G) Loans On Manufactured Number Average Value Number Average Value Number Average Value Number Average Value Number Average Value Number Average Value Number Average Value
LOANS ORIGINATED 66 $165,422 596 $144,764 776 $123,386 344 $47,573 0 $0 88 $125,225 39 $50,871 APPLICATIONS APPROVED, NOT ACCEPTED 0 $0 64 $145,514 138 $130,488 41 $61,263 2 $325,070 14 $86,145 4 $69,278 APPLICATIONS DENIED 10 $140,849 79 $134,274 489 $154,603 140 $94,021 0 $0 14 $122,535 35 $48,657 APPLICATIONS WITHDRAWN 6 $134,405 81 $144,760 197 $167,218 26 $106,824 0 $0 20 $129,468 1 $68,920 FILES CLOSED FOR INCOMPLETENESS 2 $172,065 28 $128,038 84 $206,064 6 $136,545 0 $0 4 $165,690 0 $0
Aggregated Statistics For Year 2006(Based on 4 full and 8 partial tracts) A) FHA, FSA/RHS & VA B) Conventional C) Refinancings D) Home Improvement Loans E) Loans on Dwellings For 5+ Families F) Non-occupant Loans on G) Loans On Manufactured Number Average Value Number Average Value Number Average Value Number Average Value Number Average Value Number Average Value Number Average Value
LOANS ORIGINATED 48 $182,229 778 $137,203 971 $108,753 426 $36,360 4 $408,290 106 $108,657 41 $63,134 APPLICATIONS APPROVED, NOT ACCEPTED 0 $0 104 $128,597 186 $115,553 42 $51,847 1 $162,530 17 $117,488 16 $44,754 APPLICATIONS DENIED 0 $0 105 $141,002 546 $126,672 140 $51,307 0 $0 30 $146,746 19 $72,899 APPLICATIONS WITHDRAWN 4 $209,248 63 $139,170 350 $143,375 30 $71,476 2 $24,730 14 $105,894 1 $15,450 FILES CLOSED FOR INCOMPLETENESS 0 $0 14 $125,798 82 $153,643 7 $79,679 0 $0 0 $0 2 $23,860
Aggregated Statistics For Year 2005(Based on 4 full and 8 partial tracts) A) FHA, FSA/RHS & VA B) Conventional C) Refinancings D) Home Improvement Loans E) Loans on Dwellings For 5+ Families F) Non-occupant Loans on G) Loans On Manufactured Number Average Value Number Average Value Number Average Value Number Average Value Number Average Value Number Average Value Number Average Value
LOANS ORIGINATED 78 $151,605 1,007 $145,703 1,136 $111,445 379 $41,013 4 $1,984,335 96 $123,277 32 $51,560 APPLICATIONS APPROVED, NOT ACCEPTED 0 $0 108 $138,870 201 $105,674 32 $39,845 0 $0 11 $116,115 16 $41,150 APPLICATIONS DENIED 4 $132,868 167 $124,023 559 $123,637 169 $44,367 4 $122,438 22 $105,263 34 $48,644 APPLICATIONS WITHDRAWN 4 $103,195 70 $149,970 366 $133,067 58 $112,867 0 $0 8 $183,881 3 $102,673 FILES CLOSED FOR INCOMPLETENESS 0 $0 29 $144,446 120 $147,410 3 $55,510 0 $0 2 $12,290 1 $103,130
Aggregated Statistics For Year 2004(Based on 4 full and 8 partial tracts) A) FHA, FSA/RHS & VA B) Conventional C) Refinancings D) Home Improvement Loans E) Loans on Dwellings For 5+ Families F) Non-occupant Loans on G) Loans On Manufactured Number Average Value Number Average Value Number Average Value Number Average Value Number Average Value Number Average Value Number Average Value
LOANS ORIGINATED 92 $138,667 771 $133,898 1,116 $102,069 294 $38,028 5 $139,688 73 $86,779 11 $56,722 APPLICATIONS APPROVED, NOT ACCEPTED 2 $145,410 76 $152,667 174 $104,314 44 $34,090 0 $0 8 $107,646 5 $52,750 APPLICATIONS DENIED 4 $106,898 74 $125,482 468 $110,357 100 $38,062 1 $70,040 15 $120,052 15 $63,268 APPLICATIONS WITHDRAWN 4 $182,760 49 $144,025 382 $119,139 40 $60,671 0 $0 3 $84,503 2 $110,130 FILES CLOSED FOR INCOMPLETENESS 0 $0 21 $159,077 92 $127,744 15 $38,469 0 $0 0 $0 2 $40,700
Aggregated Statistics For Year 2003(Based on 4 full and 8 partial tracts) A) FHA, FSA/RHS & VA B) Conventional C) Refinancings D) Home Improvement Loans E) Loans on Dwellings For 5+ Families F) Non-occupant Loans on Number Average Value Number Average Value Number Average Value Number Average Value Number Average Value Number Average Value
LOANS ORIGINATED 133 $111,687 615 $115,141 1,947 $98,158 172 $36,702 4 $351,690 79 $89,255 APPLICATIONS APPROVED, NOT ACCEPTED 4 $102,102 63 $112,838 281 $93,991 32 $26,903 0 $0 8 $86,279 APPLICATIONS DENIED 13 $107,136 72 $95,740 484 $102,898 64 $31,037 0 $0 19 $102,603 APPLICATIONS WITHDRAWN 4 $103,635 50 $140,142 407 $115,383 8 $52,020 0 $0 14 $81,439 FILES CLOSED FOR INCOMPLETENESS 2 $69,960 8 $97,548 63 $111,911 8 $72,628 0 $0 2 $94,540
Aggregated Statistics For Year 2002(Based on 4 full and 8 partial tracts) A) FHA, FSA/RHS & VA B) Conventional C) Refinancings D) Home Improvement Loans E) Loans on Dwellings For 5+ Families F) Non-occupant Loans on Number Average Value Number Average Value Number Average Value Number Average Value Number Average Value Number Average Value
LOANS ORIGINATED 124 $299,432 526 $109,776 1,155 $112,928 133 $27,470 2 $136,140 57 $78,490 APPLICATIONS APPROVED, NOT ACCEPTED 4 $91,148 59 $64,055 174 $82,280 29 $24,376 0 $0 1 $12,360 APPLICATIONS DENIED 3 $75,717 88 $61,144 362 $85,589 57 $17,602 0 $0 11 $73,441 APPLICATIONS WITHDRAWN 10 $98,930 39 $106,181 238 $97,745 5 $32,334 0 $0 7 $73,674 FILES CLOSED FOR INCOMPLETENESS 2 $69,015 22 $92,862 54 $95,029 7 $39,504 0 $0 0 $0
Aggregated Statistics For Year 2001(Based on 4 full and 8 partial tracts) A) FHA, FSA/RHS & VA B) Conventional C) Refinancings D) Home Improvement Loans E) Loans on Dwellings For 5+ Families F) Non-occupant Loans on Number Average Value Number Average Value Number Average Value Number Average Value Number Average Value Number Average Value
LOANS ORIGINATED 167 $97,864 398 $103,208 873 $86,896 202 $21,505 8 $688,695 46 $88,559 APPLICATIONS APPROVED, NOT ACCEPTED 0 $0 49 $57,179 125 $81,326 31 $32,266 0 $0 9 $77,460 APPLICATIONS DENIED 3 $129,457 88 $62,568 351 $74,175 69 $20,461 0 $0 9 $101,672 APPLICATIONS WITHDRAWN 8 $100,412 22 $98,502 185 $91,969 27 $31,371 0 $0 5 $52,432 FILES CLOSED FOR INCOMPLETENESS 0 $0 0 $0 42 $90,392 1 $52,910 0 $0 2 $171,070
Aggregated Statistics For Year 2000(Based on 4 full and 8 partial tracts) A) FHA, FSA/RHS & VA B) Conventional C) Refinancings D) Home Improvement Loans E) Loans on Dwellings For 5+ Families F) Non-occupant Loans on Number Average Value Number Average Value Number Average Value Number Average Value Number Average Value Number Average Value
LOANS ORIGINATED 76 $86,334 309 $100,715 410 $59,204 150 $25,705 4 $178,955 24 $69,949 APPLICATIONS APPROVED, NOT ACCEPTED 3 $49,120 41 $56,039 108 $56,425 21 $30,392 0 $0 3 $97,120 APPLICATIONS DENIED 10 $63,794 91 $54,128 225 $57,724 70 $28,218 2 $85,085 8 $81,039 APPLICATIONS WITHDRAWN 10 $90,914 24 $122,204 111 $75,224 28 $49,596 0 $0 4 $82,062 FILES CLOSED FOR INCOMPLETENESS 0 $0 4 $162,002 108 $81,862 0 $0 0 $0 2 $88,870
Aggregated Statistics For Year 1999(Based on 2 full and 4 partial tracts) A) FHA, FSA/RHS & VA B) Conventional C) Refinancings D) Home Improvement Loans F) Non-occupant Loans on Number Average Value Number Average Value Number Average Value Number Average Value Number Average Value
LOANS ORIGINATED 44 $89,798 138 $104,049 314 $66,815 78 $28,449 12 $62,691 APPLICATIONS APPROVED, NOT ACCEPTED 0 $0 16 $101,894 77 $64,109 14 $28,189 2 $61,790 APPLICATIONS DENIED 1 $168,790 42 $61,738 143 $65,923 33 $20,580 8 $54,841 APPLICATIONS WITHDRAWN 0 $0 8 $81,626 64 $64,745 23 $49,188 0 $0 FILES CLOSED FOR INCOMPLETENESS 1 $55,530 2 $117,775 34 $82,144 0 $0 0 $0
Private Mortgage Insurance Companies Aggregated Statistics For Year 2009(Based on 4 full and 8 partial tracts) A) Conventional B) Refinancings Number Average Value Number Average Value
LOANS ORIGINATED 29 $170,078 20 $233,011 APPLICATIONS APPROVED, NOT ACCEPTED 14 $185,803 14 $216,921 APPLICATIONS DENIED 9 $204,120 12 $308,168 APPLICATIONS WITHDRAWN 4 $243,470 2 $231,950 FILES CLOSED FOR INCOMPLETENESS 0 $0 1 $203,320
Aggregated Statistics For Year 2008(Based on 4 full and 8 partial tracts) A) Conventional B) Refinancings C) Non-occupant Loans on D) Loans On Manufactured Number Average Value Number Average Value Number Average Value Number Average Value
LOANS ORIGINATED 93 $176,464 55 $194,003 3 $184,157 1 $90,850 APPLICATIONS APPROVED, NOT ACCEPTED 31 $176,588 22 $197,435 3 $94,720 0 $0 APPLICATIONS DENIED 9 $180,248 4 $186,768 2 $234,770 0 $0 APPLICATIONS WITHDRAWN 0 $0 0 $0 0 $0 0 $0 FILES CLOSED FOR INCOMPLETENESS 0 $0 0 $0 0 $0 0 $0
Aggregated Statistics For Year 2007(Based on 4 full and 8 partial tracts) A) Conventional B) Refinancings C) Non-occupant Loans on D) Loans On Manufactured Number Average Value Number Average Value Number Average Value Number Average Value
LOANS ORIGINATED 141 $176,719 47 $192,794 6 $96,443 1 $123,600 APPLICATIONS APPROVED, NOT ACCEPTED 13 $148,472 8 $196,769 0 $0 0 $0 APPLICATIONS DENIED 2 $367,815 2 $289,835 0 $0 0 $0 APPLICATIONS WITHDRAWN 2 $353,900 2 $141,810 0 $0 0 $0 FILES CLOSED FOR INCOMPLETENESS 2 $155,990 0 $0 0 $0 0 $0
Aggregated Statistics For Year 2006(Based on 4 full and 8 partial tracts) A) Conventional B) Refinancings C) Non-occupant Loans on D) Loans On Manufactured Number Average Value Number Average Value Number Average Value Number Average Value
LOANS ORIGINATED 137 $172,330 29 $184,455 6 $138,503 1 $105,680 APPLICATIONS APPROVED, NOT ACCEPTED 36 $185,765 12 $152,456 0 $0 0 $0 APPLICATIONS DENIED 0 $0 0 $0 0 $0 0 $0 APPLICATIONS WITHDRAWN 5 $170,654 0 $0 0 $0 0 $0 FILES CLOSED FOR INCOMPLETENESS 0 $0 0 $0 0 $0 0 $0
Aggregated Statistics For Year 2005(Based on 4 full and 8 partial tracts) A) Conventional B) Refinancings C) Non-occupant Loans on D) Loans On Manufactured Number Average Value Number Average Value Number Average Value Number Average Value
LOANS ORIGINATED 184 $169,974 49 $162,829 8 $145,851 1 $92,700 APPLICATIONS APPROVED, NOT ACCEPTED 32 $167,535 15 $146,657 0 $0 1 $92,700 APPLICATIONS DENIED 10 $297,225 0 $0 3 $255,567 1 $183,550 APPLICATIONS WITHDRAWN 7 $222,840 2 $91,705 1 $50,060 0 $0 FILES CLOSED FOR INCOMPLETENESS 0 $0 2 $98,320 0 $0 0 $0
Aggregated Statistics For Year 2004(Based on 4 full and 8 partial tracts) A) Conventional B) Refinancings C) Non-occupant Loans on Number Average Value Number Average Value Number Average Value
LOANS ORIGINATED 186 $138,294 38 $131,592 4 $84,868 APPLICATIONS APPROVED, NOT ACCEPTED 16 $167,772 22 $127,479 0 $0 APPLICATIONS DENIED 0 $0 2 $104,855 0 $0 APPLICATIONS WITHDRAWN 7 $149,151 6 $125,018 0 $0 FILES CLOSED FOR INCOMPLETENESS 1 $113,710 0 $0 0 $0
Aggregated Statistics For Year 2003(Based on 4 full and 8 partial tracts) A) Conventional B) Refinancings C) Non-occupant Loans on Number Average Value Number Average Value Number Average Value
LOANS ORIGINATED 207 $129,919 173 $125,106 10 $94,182 APPLICATIONS APPROVED, NOT ACCEPTED 29 $147,362 50 $136,867 0 $0 APPLICATIONS DENIED 3 $132,700 2 $183,990 0 $0 APPLICATIONS WITHDRAWN 6 $105,612 12 $120,312 0 $0 FILES CLOSED FOR INCOMPLETENESS 0 $0 2 $81,305 0 $0
Aggregated Statistics For Year 2002(Based on 4 full and 8 partial tracts) A) Conventional B) Refinancings C) Non-occupant Loans on Number Average Value Number Average Value Number Average Value
LOANS ORIGINATED 217 $124,056 126 $127,055 12 $87,245 APPLICATIONS APPROVED, NOT ACCEPTED 23 $124,833 21 $107,644 0 $0 APPLICATIONS DENIED 0 $0 1 $188,490 1 $121,130 APPLICATIONS WITHDRAWN 4 $114,815 10 $131,889 0 $0 FILES CLOSED FOR INCOMPLETENESS 0 $0 0 $0 0 $0
Aggregated Statistics For Year 2001(Based on 4 full and 8 partial tracts) A) Conventional B) Refinancings C) Non-occupant Loans on Number Average Value Number Average Value Number Average Value
LOANS ORIGINATED 162 $115,752 89 $123,397 5 $76,766 APPLICATIONS APPROVED, NOT ACCEPTED 19 $151,997 6 $112,367 0 $0 APPLICATIONS DENIED 0 $0 0 $0 0 $0 APPLICATIONS WITHDRAWN 2 $132,355 2 $148,120 0 $0 FILES CLOSED FOR INCOMPLETENESS 0 $0 1 $68,600 0 $0
Aggregated Statistics For Year 2000(Based on 4 full and 8 partial tracts) A) Conventional B) Refinancings C) Non-occupant Loans on Number Average Value Number Average Value Number Average Value
LOANS ORIGINATED 109 $111,541 24 $107,195 2 $55,780 APPLICATIONS APPROVED, NOT ACCEPTED 9 $136,994 3 $103,103 0 $0 APPLICATIONS DENIED 0 $0 3 $149,010 0 $0 APPLICATIONS WITHDRAWN 1 $210,740 2 $70,235 0 $0 FILES CLOSED FOR INCOMPLETENESS 1 $110,000 0 $0 0 $0
Aggregated Statistics For Year 1999(Based on 2 full and 4 partial tracts) A) Conventional B) Refinancings C) Non-occupant Loans on Number Average Value Number Average Value Number Average Value
LOANS ORIGINATED 54 $108,336 31 $104,919 0 $0 APPLICATIONS APPROVED, NOT ACCEPTED 9 $141,809 3 $133,217 1 $67,560 APPLICATIONS DENIED 2 $90,315 0 $0 0 $0 APPLICATIONS WITHDRAWN 2 $80,900 3 $99,397 0 $0 FILES CLOSED FOR INCOMPLETENESS 1 $180,670 1 $82,370 0 $0
2003 - 2018 National Fire Incident Reporting System (NFIRS) incidents See full 2006 National Fire Incident Reporting System statistics for zip code 18067, Pennsylvania
Most common first names in zip code 18067 among deceased individuals Name Count Lived (average)
John 218 74.7 years Mary 200 80.9 years Anna 160 80.5 years Joseph 137 75.3 years Frank 104 76.9 years Helen 86 76.6 years William 84 74.2 years Stephen 67 74.2 years George 67 74.6 years Robert 55 66.6 years
Most common last names in zip code 18067 among deceased individuals Last name Count Lived (average)
Miller 78 74.9 years Smith 27 73.6 years Koehler 20 68.3 years Snyder 18 73.9 years Newhard 18 77.2 years Marakovits 18 70.5 years Kern 18 74.2 years Lerch 18 77.1 years Wagner 18 76.3 years Marth 17 76.5 years
Businesses in zip code 18067
Name Count Name Count
Ace Hardware 1 Quiznos 1 CVS 1 Rite Aid 1 Dunkin Donuts 1 Subway 2 Kroger 1 UPS 1
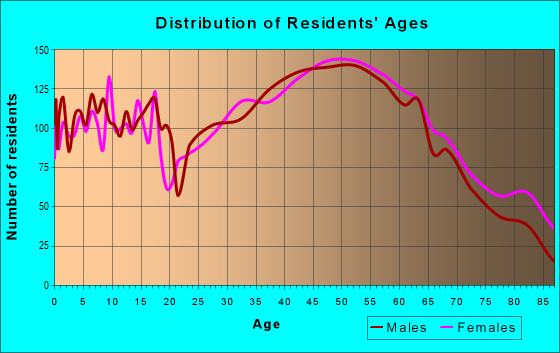
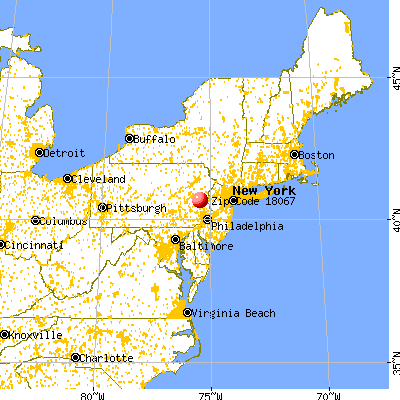


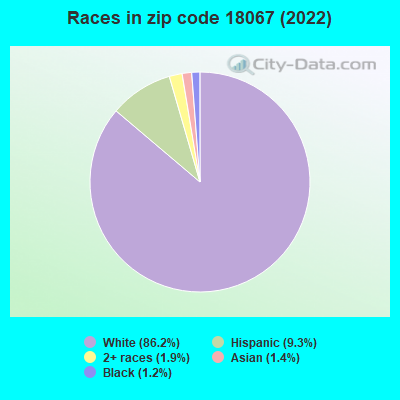


 Nearest zip codes: 18032, 18052, 18059, 18035, 18086, 18037.
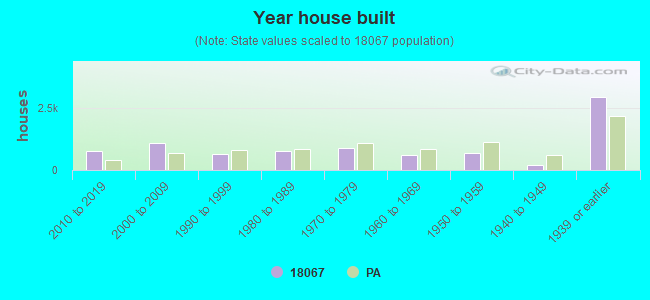
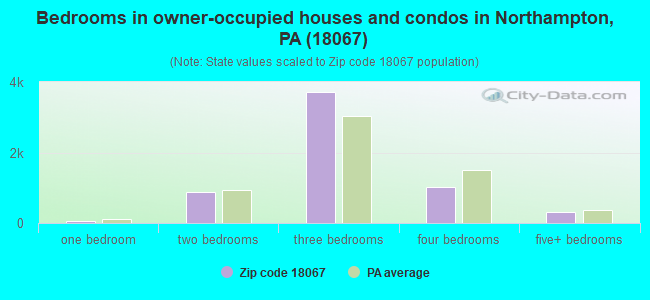
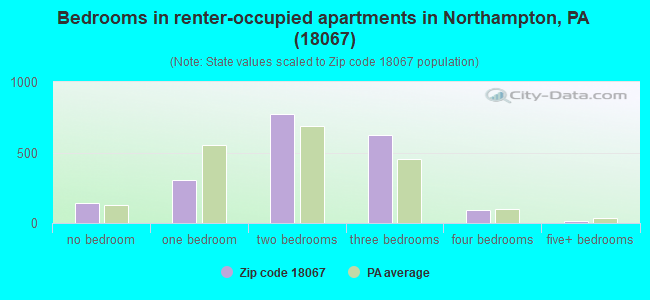
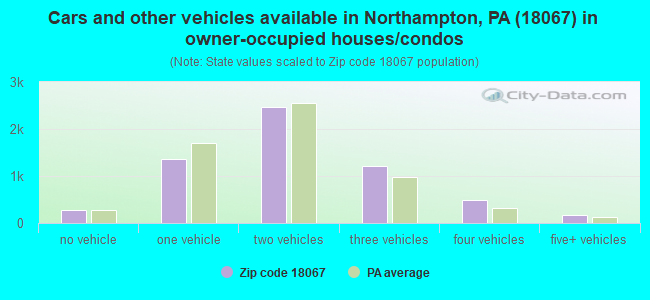
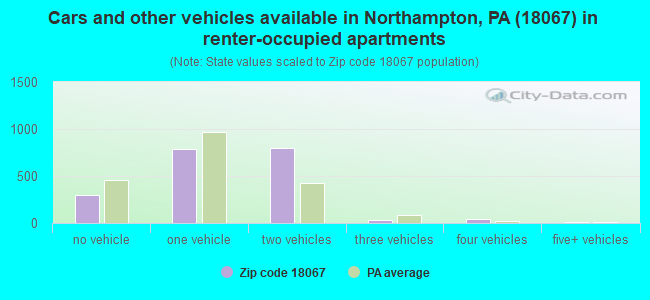


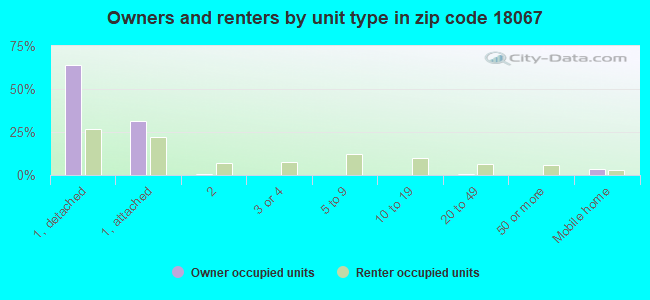


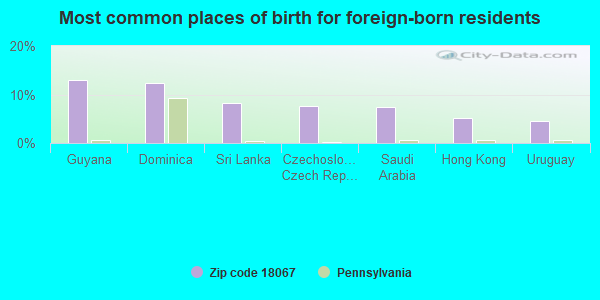
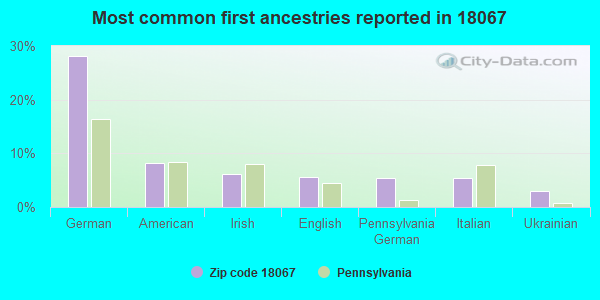
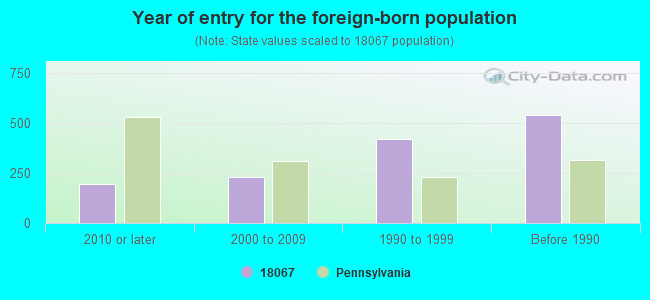
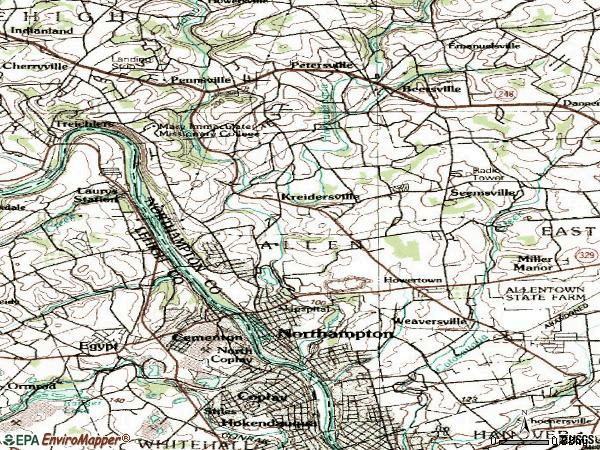


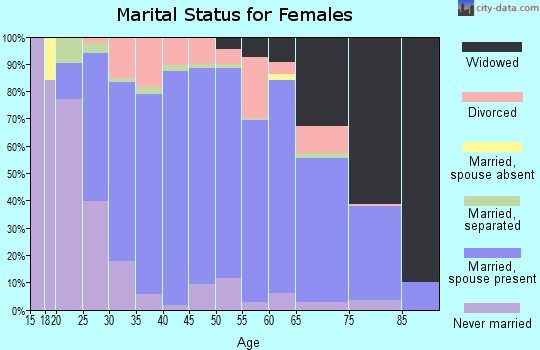
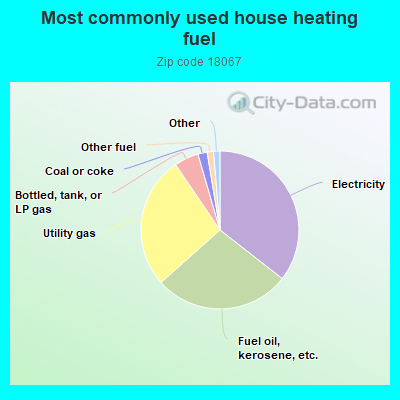
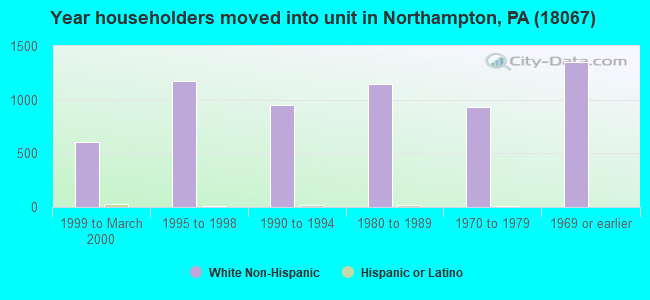
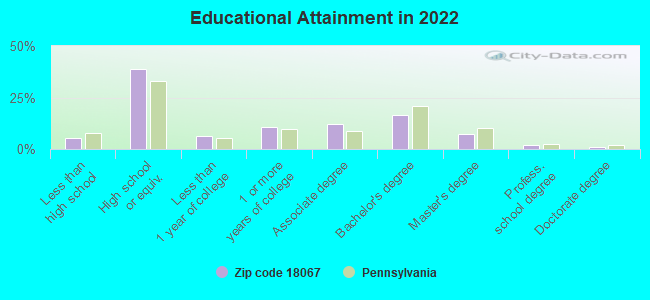
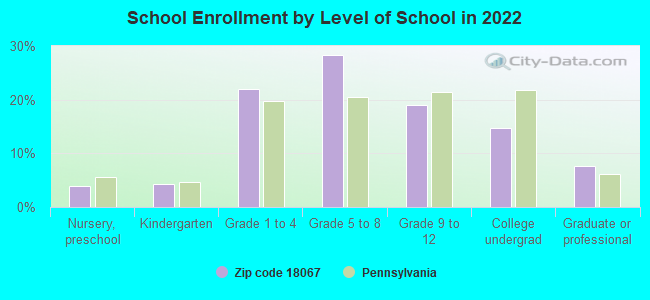
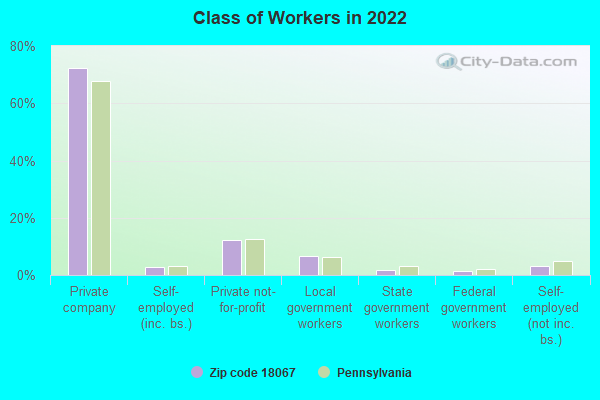
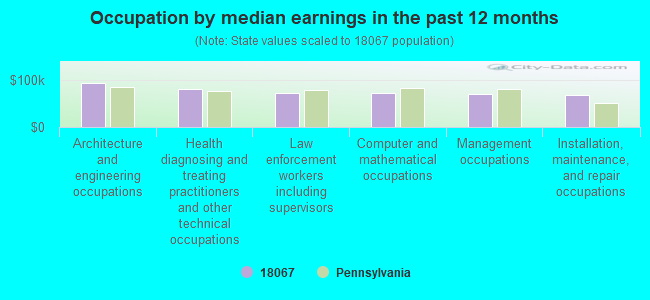
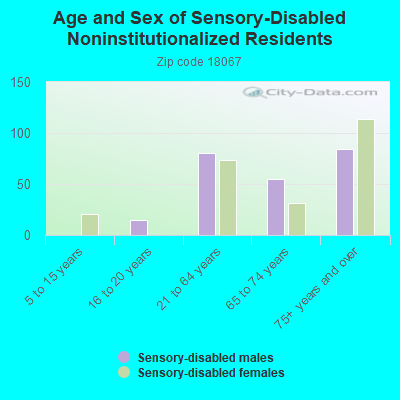
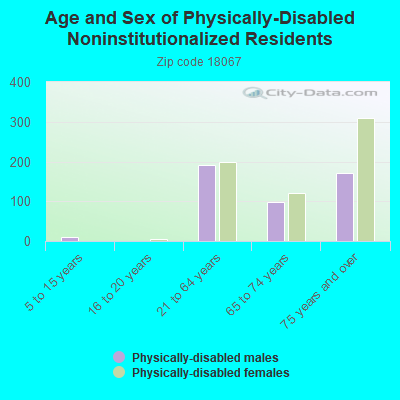
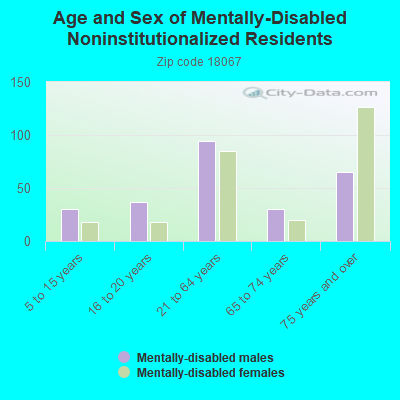
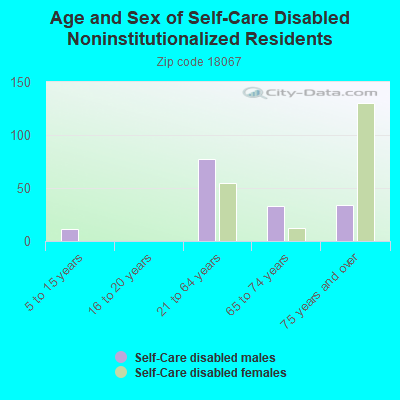
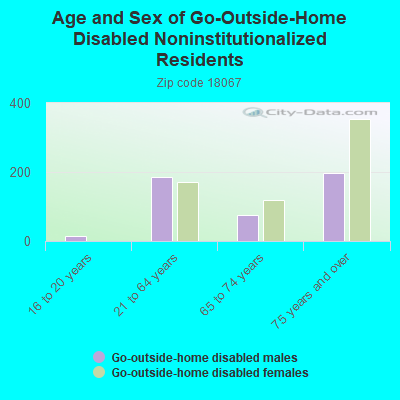
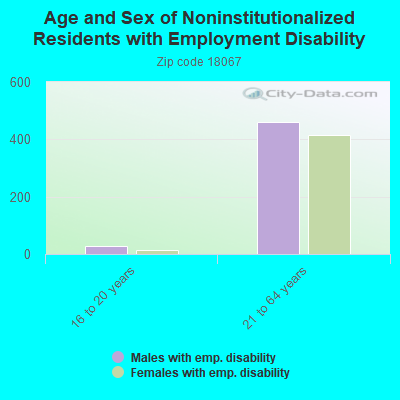
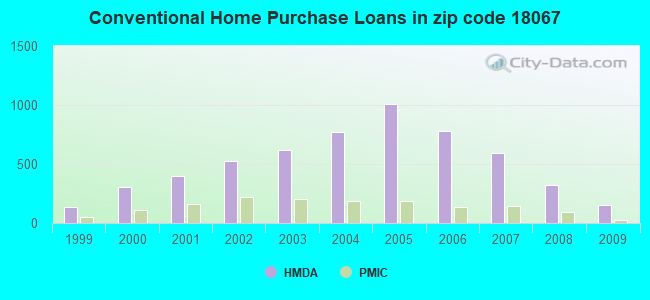
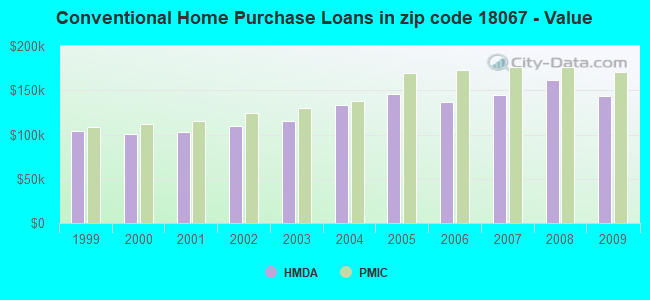
 According to the data from the years 2003 - 2018 the average number of fires per year is 44. The highest number of fire incidents - 125 took place in 2016, and the least - 0 in 2008. The data has an increasing trend.
 When looking into fire subcategories, the most incidents belonged to: Structure Fires (73.6%), and Outside Fires (15.5%).