Estimated zip code population in 2022: 1,343 Zip code population in 2010: 1,067 Zip code population in 2000: 1,330
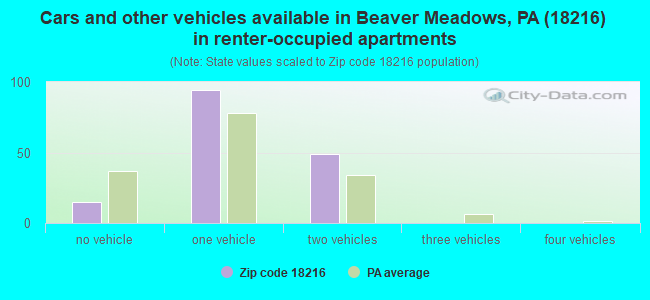
Houses and condos: 598 Renter-occupied apartments: 157
% of renters here:
29%
State:
31%
March 2022 cost of living index in zip code 18216: 97.7 (near average, U.S. average is 100)
Land area: 5.2 sq. mi. Water area: 0.0 sq. mi.
Population density: 260 people per square mile
(very low).
OSM Map
General Map
Google Map
MSN Map
OSM Map
General Map
Google Map
MSN Map
OSM Map
General Map
Google Map
MSN Map
OSM Map
General Map
Google Map
MSN Map
Please wait while loading the map...
Real estate property taxes paid for housing units in 2022:
This zip code:
1.0% ($1,279)
Pennsylvania:
1.3% ($3,094)
Median real estate property taxes paid for housing units with mortgages in 2022: $1,543 (1.1%) Median real estate property taxes paid for housing units with no mortgage in 2022: $939 (1.0%)
Business Search- 14 Million verified businesses
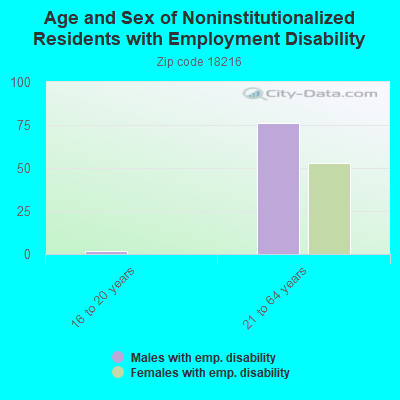
Males: 609
(45.4%)
Females: 733
(54.6%)
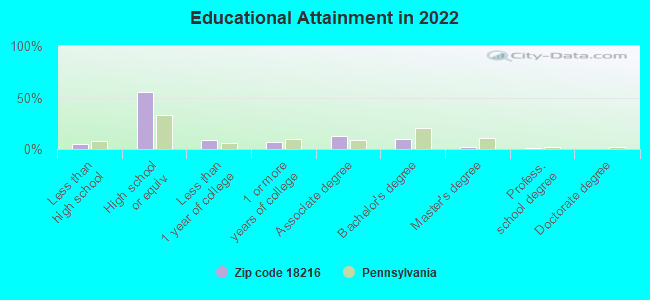
For population 25 years and over in 18216:
High school or higher: 93.2%
Bachelor's degree or higher: 11.9%
Graduate or professional degree: 2.8%
Unemployed: 6.6%
Mean travel time to work (commute): 22.8 minutes
For population 15 years and over in 18216:
Never married: 31.1%
Now married: 49.7%
Separated: 0.4%
Widowed: 8.8%
Divorced: 9.9%
Zip code 18216 compared to state average:
Median house value below state average.
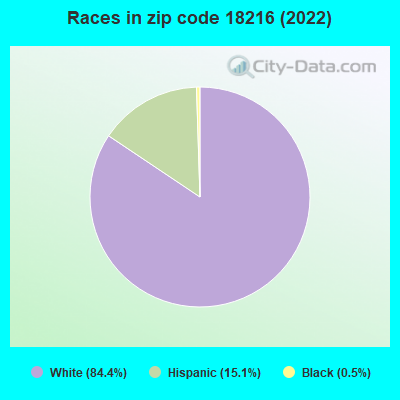
Black race population percentage significantly below state average.
Hispanic race population percentage above state average.
Length of stay since moving in significantly above state average.
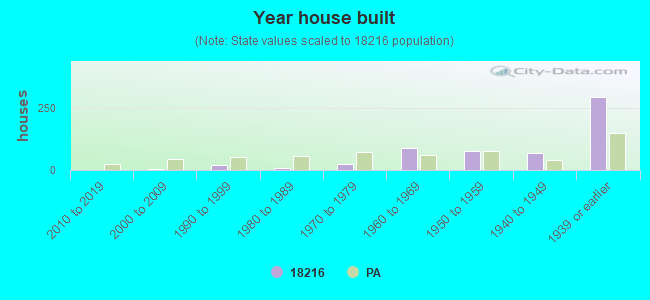
House age above state average.
Percentage of population with a bachelor's degree or higher significantly below state average.
Estimated median house/condo value in 2022: $125,897
18216:
$125,897
Pennsylvania:
$245,500
According to our research of Pennsylvania and other state lists, there was 1 registered sex offender living in 18216 zip code as of April 27, 2024. The ratio of all residents to sex offenders in zip code 18216 is 959 to 1. The ratio of registered sex offenders to all residents in this zip code is lower than the state average.
Median resident age:
This zip code:
40.4 years
Pennsylvania median age:
40.9 years
Average household size:
This zip code:
2.5 people
Pennsylvania:
2.4 people
Averages for the 2020 tax year for zip code 18216, filed in 2021:
Average Adjusted Gross Income (AGI) in 2020: $42,075 (Individual Income Tax Returns)
Here:
$42,075
State:
$75,707
Salary/wage: $39,436 (reported on 79.5% of returns)
Here:
$39,436
State:
$62,806
(% of AGI for various income ranges: 926.8% for AGIs below $25k, 3293.7% for AGIs $25k-50k, 5936.2% for AGIs $50k-75k, 10010.0% for AGIs $75k-100k, 12750.0% for AGIs $100k-200k)
Taxable interest for individuals: $614 (reported on 19.2% of returns)
This zip code:
$614
Pennsylvania:
$1,633
(% of AGI for various income ranges: 9.5% for AGIs below $25k, 12.1% for AGIs $25k-50k, 30.0% for AGIs $50k-75k, 52.5% for AGIs $100k-200k)
Ordinary dividends: $2,691 (reported on 15.1% of returns)
Here:
$2,691
State:
$7,382
(% of AGI for various income ranges: 30.5% for AGIs below $25k, 62.5% for AGIs $50k-75k, 376.0% for AGIs $75k-100k)
Net capital gain/loss in AGI: +$1,856 (reported on 12.3% of returns)
Here:
+$1,856
State:
+$23,522
(% of AGI for various income ranges: 15.8% for AGIs below $25k, 28.4% for AGIs $25k-50k, 166.0% for AGIs $75k-100k)
Profit/loss from business: +$3,671 (reported on 9.6% of returns)
Here:
+$3,671
State:
+$16,274
(% of AGI for various income ranges: 97.9% for AGIs below $25k, 88.8% for AGIs $50k-75k)
Taxable individual retirement arrangement distribution: $9,786 (reported on 9.6% of returns)
18216:
$9,786
Pennsylvania:
$18,583
(% of AGI for various income ranges: 137.9% for AGIs below $25k, 528.8% for AGIs $50k-75k)
Earned income credit: $2,138 (reported on 17.8% of returns)
Here:
$2,138
State:
$2,100
(% of AGI for various income ranges: 71.1% for AGIs below $25k, 75.3% for AGIs $25k-50k)
Percentage of individuals using paid preparers for their 2020 taxes: 91.8%
Here:
92%
State:
92%
(% for various income ranges: 88.9% for AGIs below $25k, 91.3% for AGIs $25k-50k, 90.9% for AGIs $50k-75k, 100.0% for AGIs $75k-100k, 100.0% for AGIs $100k-200k)
Averages for the 2012 tax year for zip code 18216, filed in 2013:
Average Adjusted Gross Income (AGI) in 2012: $38,171 (Individual Income Tax Returns)
Here:
$38,171
State:
$61,346
Salary/wage: $37,113 (reported on 82.5% of returns)
Here:
$37,113
State:
$51,902
(% of AGI for various income ranges: 64.2% for AGIs below $25k, 83.5% for AGIs $25k-50k, 81.9% for AGIs $50k-75k, 86.4% for AGIs $75k-100k, 80.2% for AGIs $100k-200k)
Taxable interest for individuals: $591 (reported on 34.9% of returns)
This zip code:
$591
Pennsylvania:
$1,588
(% of AGI for various income ranges: 1.9% for AGIs below $25k, 0.4% for AGIs $25k-50k, 0.4% for AGIs $50k-75k, 0.3% for AGIs $75k-100k)
Ordinary dividends: $1,442 (reported on 19.0% of returns)
Here:
$1,442
State:
$5,827
(% of AGI for various income ranges: 1.6% for AGIs below $25k, 0.6% for AGIs $25k-50k, 0.8% for AGIs $50k-75k, 0.6% for AGIs $75k-100k)
Profit/loss from business: +$5,280 (reported on 7.9% of returns)
Here:
+$5,280
State:
+$16,268
Taxable individual retirement arrangement distribution: $8,386 (reported on 11.1% of returns)
18216:
$8,386
Pennsylvania:
$14,550
Total itemized deductions: $15,078 (21% of AGI, reported on 14.3% of returns)
Here:
$15,078
State:
$23,538
Here:
20.9% of AGI
State:
18.4% of AGI
(% of AGI for various income ranges: 5.2% for AGIs $25k-50k, 7.3% for AGIs $50k-75k, 13.5% for AGIs $75k-100k)
Charity contributions: $1,183 (reported on 9.5% of returns)
Here:
$1,183
State:
$4,025
(% of AGI for various income ranges: 0.6% for AGIs below $25k, 0.4% for AGIs $50k-75k, 0.7% for AGIs $75k-100k)
Taxes paid: $4,633 (reported on 14.3% of returns)
18216:
$4,633
State:
$9,982
(% of AGI for various income ranges: 1.3% for AGIs $25k-50k, 1.6% for AGIs $50k-75k, 5.8% for AGIs $75k-100k)
Earned income credit: $2,142 (reported on 19.0% of returns)
Here:
$2,142
State:
$2,106
(% of AGI for various income ranges: 5.6% for AGIs below $25k, 0.9% for AGIs $25k-50k)
Percentage of individuals using paid preparers for their 2012 taxes: 58.7%
Here:
59%
State:
53%
(% for various income ranges: 57.1% for AGIs below $25k, 55.6% for AGIs $25k-50k, 54.5% for AGIs $50k-75k, 125.0% for AGIs $75k-100k)
Averages for the 2004 tax year for zip code 18216, filed in 2005:
Average Adjusted Gross Income (AGI) in 2004: $31,115 (Individual Income Tax Returns)
Here:
$31,115
State:
$48,049
Salary/wage: $29,021 (reported on 84.3% of returns)
Here:
$29,021
State:
$42,646
(% of AGI for various income ranges: 80.1% for AGIs below $10k, 72.8% for AGIs $10k-25k, 83.6% for AGIs $25k-50k, 78.2% for AGIs $50k-75k, 74.2% for AGIs $75k-100k)
Taxable interest for individuals: $1,396 (reported on 48.1% of returns)
This zip code:
$1,396
Pennsylvania:
$1,657
(% of AGI for various income ranges: 5.5% for AGIs below $10k, 3.8% for AGIs $10k-25k, 1.5% for AGIs $25k-50k, 2.6% for AGIs $50k-75k, 0.8% for AGIs $75k-100k)
Taxable dividends: $1,017 (reported on 25.9% of returns)
Here:
$1,017
State:
$3,566
(% of AGI for various income ranges: 3.0% for AGIs below $10k, 1.2% for AGIs $10k-25k, 0.5% for AGIs $25k-50k, 1.0% for AGIs $50k-75k, 0.6% for AGIs $75k-100k)
Net capital gain/loss: +$71 (reported on 14.7% of returns)
Here:
+$71
State:
+$9,716
(% of AGI for various income ranges: -3.0% for AGIs below $10k, 0.5% for AGIs $10k-25k, -0.3% for AGIs $25k-50k, 0.9% for AGIs $50k-75k, -0.4% for AGIs $75k-100k)
Profit/loss from business: +$5,797 (reported on 8.8% of returns)
Here:
+$5,797
State:
+$14,267
(% of AGI for various income ranges: 0.9% for AGIs below $10k, -0.2% for AGIs $10k-25k, 4.2% for AGIs $25k-50k, 0.7% for AGIs $50k-75k)
IRA payment deduction: $2,450 (reported on 3.0% of returns)
18216:
$2,450
Pennsylvania:
$2,903
Total itemized deductions: $14,284 (23% of AGI, reported on 13.2% of returns)
Here:
$14,284
State:
$18,804
Here:
22.7% of AGI
State:
19.5% of AGI
Charity contributions deductions: $1,282 (2% of AGI, reported on 10.6% of returns)
Here:
$1,282
State:
$3,337
Here:
2.1% of AGI
State:
3.3% of AGI
Total tax: $3,527 (reported on 72.9% of returns)
18216:
$3,527
State:
$8,008
(% of AGI for various income ranges: 2.0% for AGIs below $10k, 3.8% for AGIs $10k-25k, 7.6% for AGIs $25k-50k, 9.1% for AGIs $50k-75k, 13.1% for AGIs $75k-100k)
Earned income credit: $1,550 (reported on 15.0% of returns)
Here:
$1,550
State:
$1,643
Percentage of individuals using paid preparers for their 2004 taxes: 62.8%
Here:
63%
State:
56%
(% for various income ranges: 57.6% for AGIs below $10k, 64.2% for AGIs $10k-25k, 65.2% for AGIs $25k-50k, 61.1% for AGIs $50k-75k, 70.3% for AGIs $75k-100k)
Household received Food Stamps/SNAP in the past 12 months: 75 Household did not receive Food Stamps/SNAP in the past 12 months: 461
Women who had a birth in the past 12 months: 11 (0 now married, 9 unmarried) Women who did not have a birth in the past 12 months: 276 (125 now married, 150 unmarried)
Housing units in zip code 18216 with a mortgage: 201 (5 second mortgage, 4 both second mortgage and home equity loan) Houses without a mortgage: 1
Median monthly owner costs for units with a mortgage: $1,120 Median monthly owner costs for units without a mortgage: $400
Residents with income below the poverty level in 2022:
This zip code:
13.1%
Whole state:
11.8%
Residents with income below 50% of the poverty level in 2022:
This zip code:
8.0%
Whole state:
6.1%
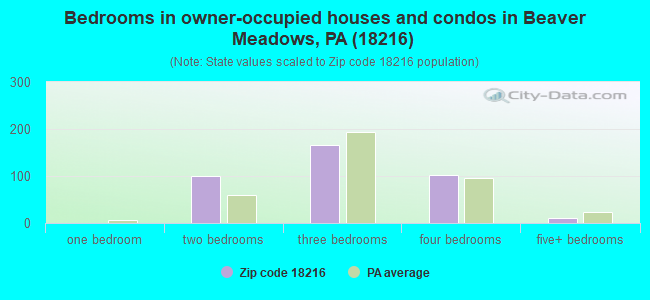
Median number of rooms in houses and condos:
Here:
6.3
State:
6.8
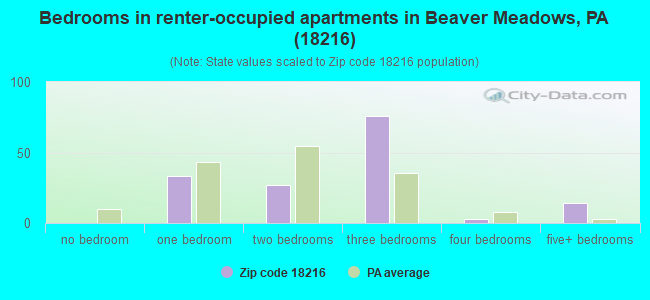
Median number of rooms in apartments:
Here:
6.1
State:
4.3
Notable locations in this zip code not listed on our city pages
Notable locations in zip code 18216: Centtown (A), Beaver Meadows Volunteer Fire Company 1 (B), Beaver Meadow Colliery (C). Display/hide their locations on the map
Size of family households: 176 2-persons, 89 3-persons, 51 4-persons, 47 5-persons, 8 6-persons, 6 7-or-more-persons
Size of nonfamily households: 134 1-person, 22 2-persons
164 married couples with children.
76 single-parent households (60 men, 16 women).
87.4% of residents of 18216 zip code speak English at home.
9.9% of residents speak Spanish at home (27% very well, 19% well, 34% not well, 20% not at all).
2.8% of residents speak other Indo-European language at home (86% very well, 14% well).
0.2% of residents speak other language at home (100% very well).
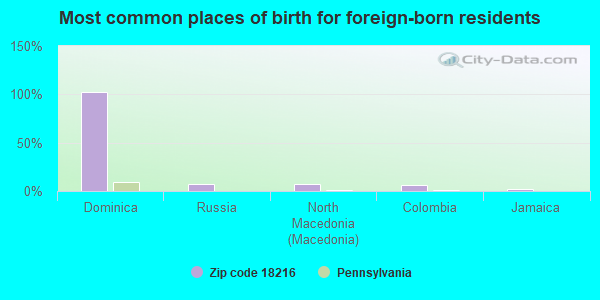
Foreign born population: 122 (9.2%) (43.0% of them are naturalized citizens)
This zip code:
9.2%
Whole state:
7.5%
102%Dominica
7%Russia
7%North Macedonia (Macedonia)
6%Colombia
2%Jamaica
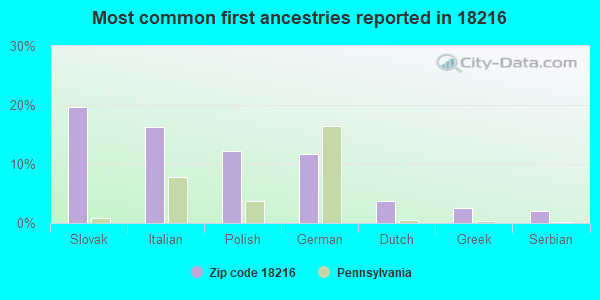
20%Slovak
16%Italian
12%Polish
12%German
4%Dutch
3%Greek
2%Serbian
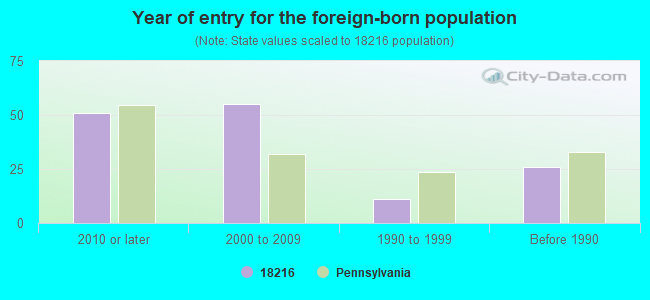
Year of entry for the foreign-born population
512010 or later
552000 to 2009
111990 to 1999
26Before 1990
Facilities with environmental interests located in this zip code:
BEAVER MEADOWS MUNI WATER AUTH (2000 FEET EAST OF STATE RTE 93 in BEAVER MEADOWS, PA)
STATE MASTER (Pennsylvania database) - PWSID-3130002, DRINKING WATER PROGRAM National Pollutant Discharge Elimination System NON-MAJOR (Tracking pollutant discharge elimination systems) - permit COMMUNITY WATER SYSTEM (SDWIS) Business SIC classification: WATER SUPPLY; SEWERAGE SYSTEMS Alternative names: BEAVER MEADOWS BORO, BEAVER MEADOWS MUN AUTH, BEAVER MEADOWS MUNICIPAL AUTHO
Housing units lacking complete plumbing facilities: 1.0% Housing units lacking complete kitchen facilities: 1.8%
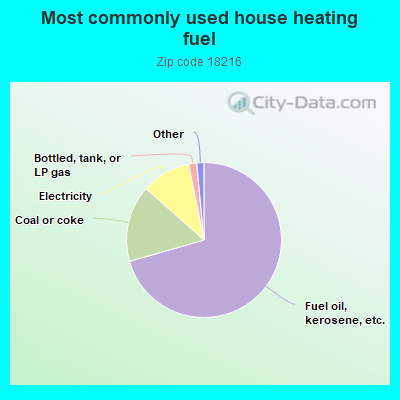
70.7%Fuel oil, kerosene, etc.
16.0%Coal or coke
10.3%Electricity
1.7%Bottled, tank, or LP gas
1.0%Utility gas
0.6%Other fuel
Population in 1990: 2,470.
Place of birth for U.S.-born residents:
This state: 1,040
Northeast: 146
Midwest: 5
West: 1
81% of the 18216 zip code residents lived in the same house 5 years ago. Out of people who lived in different houses, 41% lived in this county. Out of people who lived in different counties, 50% lived in Pennsylvania.
90% of the 18216 zip code residents lived in the same house 1 year ago. Out of people who lived in different houses, 7% moved from this county. Out of people who lived in different houses, 49% moved from different county within same state. Out of people who lived in different houses, 43% moved from different state.
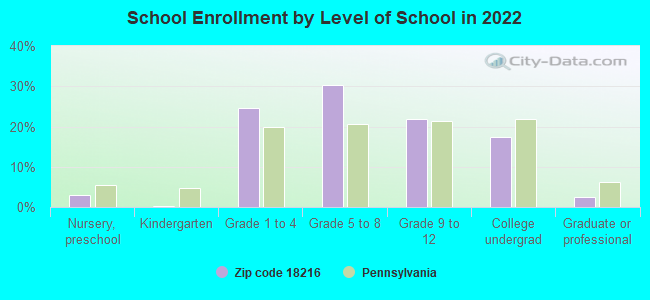
Private vs. public school enrollment:
Students in private schools in grades 1 to 8 (elementary and middle school):
Here:
0.0%
Pennsylvania:
15.7%
Students in private schools in grades 9 to 12 (high school): 21
Here:
33.6%
Pennsylvania:
13.4%
Students in private undergraduate colleges: 4
Here:
9.5%
Pennsylvania:
39.8%
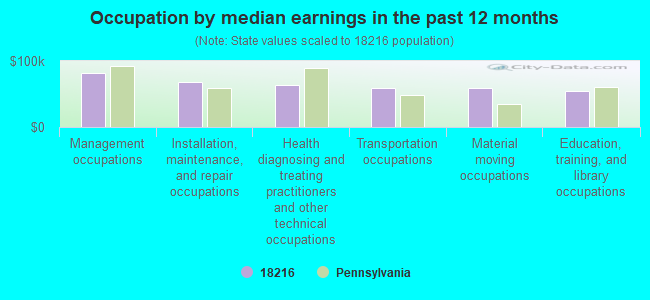
Occupation by median earnings in the past 12 months ($)
81,689Management occupations
68,086Installation, maintenance, and repair occupations
63,666Health diagnosing and treating practitioners and other technical occupations
59,175Transportation occupations
58,341Material moving occupations
54,727Education, training, and library occupations
Top industries in this zip code by the number of employees in 2005:
Health Care and Social Assistance: Vocational Rehabilitation Services (50-99 employees: 1 establishment)
Construction: New Single-Family Housing Construction (except Operative Builders) (5-9: 1, 1-4: 1)
Other Services (except Public Administration): Religious Organizations (1-4: 2)
Other Services (except Public Administration): General Automotive Repair (1-4: 2)
Other Services (except Public Administration): Commercial and Industrial Machinery and Equipment (except Automotive and Electronic) Repair and Maintenance (1-4: 1)
Administrative and Support and Waste Management and Remediation Services: All Other Support Services (1-4: 1)
Construction: Tile and Terrazzo Contractors (1-4: 1)
Fatal accident statistics in 2010:
Fatal accident count: 1
Vehicles involved in fatal accidents: 3
Fatal accidents caused by drunken drivers: 1
Fatalities: 1
Persons involved in fatal accidents: 1
Pedestrians involved in fatal accidents: 0
Home Mortgage Disclosure Act Aggregated Statistics For Year 2009 (Based on 4 partial tracts)
A) FHA, FSA/RHS & VA Home Purchase Loans
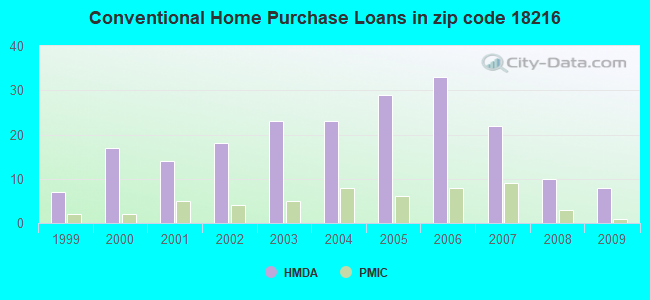
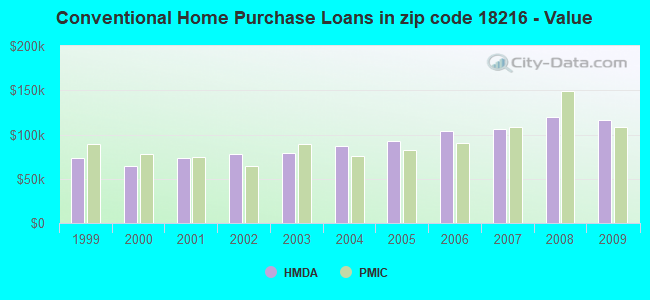
B) Conventional Home Purchase Loans
C) Refinancings
D) Home Improvement Loans
F) Non-occupant Loans on < 5 Family Dwellings (A B C & D)
G) Loans On Manufactured Home Dwelling (A B C & D)
Number
Average Value
Number
Average Value
Number
Average Value
Number
Average Value
Number
Average Value
Number
Average Value
LOANS ORIGINATED
6
$117,782
8
$115,985
30
$120,990
6
$35,693
5
$133,798
0
$0
APPLICATIONS APPROVED, NOT ACCEPTED
0
$0
1
$37,020
2
$67,145
1
$39,810
1
$25,950
0
$0
APPLICATIONS DENIED
1
$80,680
3
$124,580
18
$122,296
3
$47,270
2
$118,100
1
$60,780
APPLICATIONS WITHDRAWN
1
$127,940
0
$0
10
$122,354
1
$76,370
1
$104,110
0
$0
FILES CLOSED FOR INCOMPLETENESS
0
$0
0
$0
2
$117,000
0
$0
0
$0
0
$0
Aggregated Statistics For Year 2008 (Based on 4 partial tracts)
A) FHA, FSA/RHS & VA Home Purchase Loans
B) Conventional Home Purchase Loans
C) Refinancings
D) Home Improvement Loans
F) Non-occupant Loans on < 5 Family Dwellings (A B C & D)
Number
Average Value
Number
Average Value
Number
Average Value
Number
Average Value
Number
Average Value
LOANS ORIGINATED
3
$103,270
10
$119,982
25
$91,722
9
$27,787
5
$111,098
APPLICATIONS APPROVED, NOT ACCEPTED
0
$0
1
$115,590
4
$117,718
3
$14,650
1
$34,320
APPLICATIONS DENIED
0
$0
3
$109,543
28
$118,564
7
$41,783
2
$122,010
APPLICATIONS WITHDRAWN
1
$87,530
1
$86,860
6
$133,402
3
$61,017
0
$0
FILES CLOSED FOR INCOMPLETENESS
0
$0
1
$92,450
2
$127,230
0
$0
0
$0
Aggregated Statistics For Year 2007 (Based on 4 partial tracts)
A) FHA, FSA/RHS & VA Home Purchase Loans
B) Conventional Home Purchase Loans
C) Refinancings
D) Home Improvement Loans
F) Non-occupant Loans on < 5 Family Dwellings (A B C & D)
G) Loans On Manufactured Home Dwelling (A B C & D)
Number
Average Value
Number
Average Value
Number
Average Value
Number
Average Value
Number
Average Value
Number
Average Value
LOANS ORIGINATED
1
$177,440
22
$106,062
37
$85,739
15
$32,500
7
$80,197
1
$35,750
APPLICATIONS APPROVED, NOT ACCEPTED
0
$0
2
$89,080
5
$87,234
5
$48,474
0
$0
0
$0
APPLICATIONS DENIED
0
$0
10
$137,329
38
$99,073
9
$50,789
3
$103,900
1
$35,740
APPLICATIONS WITHDRAWN
0
$0
2
$105,955
12
$104,008
1
$73,630
1
$129,210
0
$0
FILES CLOSED FOR INCOMPLETENESS
0
$0
2
$68,345
5
$140,148
1
$60,010
0
$0
0
$0
Aggregated Statistics For Year 2006 (Based on 4 partial tracts)
A) FHA, FSA/RHS & VA Home Purchase Loans
B) Conventional Home Purchase Loans
C) Refinancings
D) Home Improvement Loans
F) Non-occupant Loans on < 5 Family Dwellings (A B C & D)
G) Loans On Manufactured Home Dwelling (A B C & D)
Number
Average Value
Number
Average Value
Number
Average Value
Number
Average Value
Number
Average Value
Number
Average Value
LOANS ORIGINATED
1
$119,160
33
$103,694
44
$74,659
20
$35,766
9
$87,436
0
$0
APPLICATIONS APPROVED, NOT ACCEPTED
0
$0
3
$98,163
9
$84,988
2
$21,300
1
$52,640
0
$0
APPLICATIONS DENIED
0
$0
6
$93,045
41
$91,822
19
$39,565
4
$95,678
1
$41,370
APPLICATIONS WITHDRAWN
0
$0
2
$111,770
19
$105,313
2
$111,400
0
$0
0
$0
FILES CLOSED FOR INCOMPLETENESS
0
$0
2
$129,570
5
$99,462
1
$37,290
0
$0
0
$0
Aggregated Statistics For Year 2005 (Based on 4 partial tracts)
A) FHA, FSA/RHS & VA Home Purchase Loans
B) Conventional Home Purchase Loans
C) Refinancings
D) Home Improvement Loans
F) Non-occupant Loans on < 5 Family Dwellings (A B C & D)
G) Loans On Manufactured Home Dwelling (A B C & D)
Number
Average Value
Number
Average Value
Number
Average Value
Number
Average Value
Number
Average Value
Number
Average Value
LOANS ORIGINATED
2
$82,695
29
$92,120
41
$79,311
12
$29,569
6
$111,242
0
$0
APPLICATIONS APPROVED, NOT ACCEPTED
0
$0
3
$74,173
8
$82,034
2
$24,940
0
$0
0
$0
APPLICATIONS DENIED
0
$0
9
$59,762
47
$87,807
13
$41,336
4
$79,805
1
$66,030
APPLICATIONS WITHDRAWN
0
$0
4
$133,580
21
$96,771
3
$170,987
1
$190,790
0
$0
FILES CLOSED FOR INCOMPLETENESS
0
$0
1
$63,110
1
$130,100
0
$0
0
$0
0
$0
Aggregated Statistics For Year 2004 (Based on 4 partial tracts)
A) FHA, FSA/RHS & VA Home Purchase Loans
B) Conventional Home Purchase Loans
C) Refinancings
D) Home Improvement Loans
F) Non-occupant Loans on < 5 Family Dwellings (A B C & D)
G) Loans On Manufactured Home Dwelling (A B C & D)
Number
Average Value
Number
Average Value
Number
Average Value
Number
Average Value
Number
Average Value
Number
Average Value
LOANS ORIGINATED
1
$59,160
23
$87,503
42
$76,434
14
$33,684
4
$78,998
0
$0
APPLICATIONS APPROVED, NOT ACCEPTED
0
$0
3
$75,810
7
$63,346
2
$42,760
0
$0
1
$22,950
APPLICATIONS DENIED
0
$0
5
$86,794
38
$87,511
12
$27,322
3
$53,877
0
$0
APPLICATIONS WITHDRAWN
0
$0
1
$113,750
24
$94,027
1
$51,680
0
$0
0
$0
FILES CLOSED FOR INCOMPLETENESS
0
$0
0
$0
2
$68,215
1
$30,240
0
$0
0
$0
Aggregated Statistics For Year 2003 (Based on 4 partial tracts)
A) FHA, FSA/RHS & VA Home Purchase Loans
B) Conventional Home Purchase Loans
C) Refinancings
D) Home Improvement Loans
F) Non-occupant Loans on < 5 Family Dwellings (A B C & D)
Number
Average Value
Number
Average Value
Number
Average Value
Number
Average Value
Number
Average Value
LOANS ORIGINATED
2
$62,665
23
$78,912
76
$75,481
11
$37,765
5
$76,504
APPLICATIONS APPROVED, NOT ACCEPTED
0
$0
1
$119,020
15
$79,937
3
$26,967
1
$52,220
APPLICATIONS DENIED
0
$0
3
$51,220
41
$81,833
8
$37,814
1
$50,110
APPLICATIONS WITHDRAWN
0
$0
3
$106,497
22
$87,850
2
$13,600
1
$82,720
FILES CLOSED FOR INCOMPLETENESS
0
$0
0
$0
2
$91,065
1
$31,050
0
$0
Aggregated Statistics For Year 2002 (Based on 4 partial tracts)
A) FHA, FSA/RHS & VA Home Purchase Loans
B) Conventional Home Purchase Loans
C) Refinancings
D) Home Improvement Loans
F) Non-occupant Loans on < 5 Family Dwellings (A B C & D)
Number
Average Value
Number
Average Value
Number
Average Value
Number
Average Value
Number
Average Value
LOANS ORIGINATED
3
$75,480
18
$78,107
50
$65,479
11
$21,696
3
$56,693
APPLICATIONS APPROVED, NOT ACCEPTED
0
$0
2
$86,130
13
$57,683
3
$37,570
0
$0
APPLICATIONS DENIED
0
$0
4
$64,060
32
$66,308
6
$22,783
1
$68,690
APPLICATIONS WITHDRAWN
0
$0
2
$104,500
19
$75,332
0
$0
0
$0
FILES CLOSED FOR INCOMPLETENESS
0
$0
0
$0
3
$80,800
0
$0
0
$0
Aggregated Statistics For Year 2001 (Based on 4 partial tracts)
A) FHA, FSA/RHS & VA Home Purchase Loans
B) Conventional Home Purchase Loans
C) Refinancings
D) Home Improvement Loans
F) Non-occupant Loans on < 5 Family Dwellings (A B C & D)
Number
Average Value
Number
Average Value
Number
Average Value
Number
Average Value
Number
Average Value
LOANS ORIGINATED
3
$90,780
14
$73,334
27
$64,269
11
$31,967
3
$72,013
APPLICATIONS APPROVED, NOT ACCEPTED
0
$0
3
$47,320
9
$68,498
2
$26,075
0
$0
APPLICATIONS DENIED
0
$0
5
$50,144
30
$61,136
8
$20,332
2
$37,810
APPLICATIONS WITHDRAWN
0
$0
2
$62,510
16
$75,650
2
$25,315
1
$47,910
FILES CLOSED FOR INCOMPLETENESS
0
$0
0
$0
1
$40,870
0
$0
0
$0
Aggregated Statistics For Year 2000 (Based on 4 partial tracts)
A) FHA, FSA/RHS & VA Home Purchase Loans
B) Conventional Home Purchase Loans
C) Refinancings
D) Home Improvement Loans
F) Non-occupant Loans on < 5 Family Dwellings (A B C & D)
Number
Average Value
Number
Average Value
Number
Average Value
Number
Average Value
Number
Average Value
LOANS ORIGINATED
3
$75,050
17
$63,872
23
$59,221
12
$14,702
3
$46,520
APPLICATIONS APPROVED, NOT ACCEPTED
0
$0
2
$66,635
10
$46,222
2
$36,705
1
$28,960
APPLICATIONS DENIED
0
$0
3
$76,613
21
$59,986
6
$11,742
1
$39,190
APPLICATIONS WITHDRAWN
1
$36,380
2
$81,325
15
$69,833
1
$18,300
0
$0
FILES CLOSED FOR INCOMPLETENESS
0
$0
0
$0
5
$69,186
0
$0
0
$0
Aggregated Statistics For Year 1999 (Based on 2 partial tracts)
A) FHA, FSA/RHS & VA Home Purchase Loans
B) Conventional Home Purchase Loans
C) Refinancings
D) Home Improvement Loans
F) Non-occupant Loans on < 5 Family Dwellings (A B C & D)

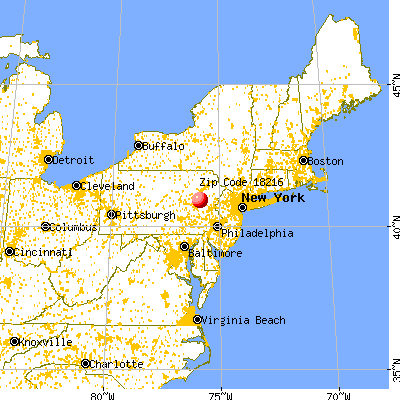


 Nearest zip codes: 18230, 18255, 18201, 18221, 18223, 18254.