Estimated zip code population in 2022: 5,110 Zip code population in 2010: 5,104 Zip code population in 2000: 5,322
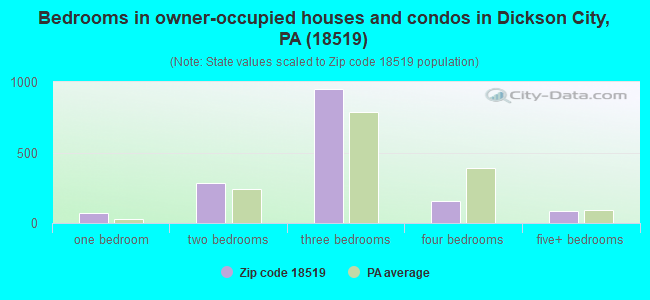
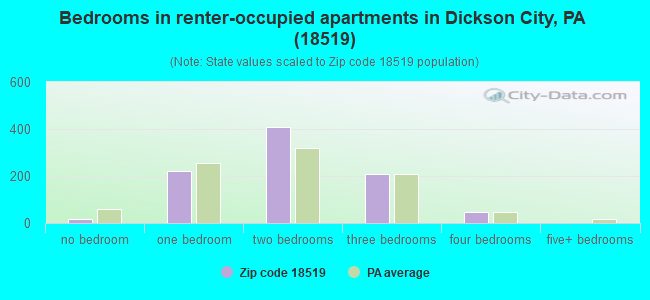
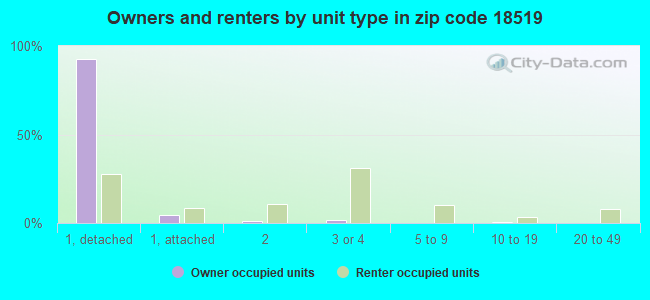
Houses and condos: 2,733 Renter-occupied apartments: 905
% of renters here:
37%
State:
31%
March 2022 cost of living index in zip code 18519: 93.6 (less than average, U.S. average is 100)
Land area: 2.4 sq. mi. Water area: 0.0 sq. mi.
Population density: 2,122 people per square mile
(low).
OSM Map
General Map
Google Map
MSN Map
OSM Map
General Map
Google Map
MSN Map
OSM Map
General Map
Google Map
MSN Map
OSM Map
General Map
Google Map
MSN Map
Please wait while loading the map...
Real estate property taxes paid for housing units in 2022:
This zip code:
1.1% ($1,827)
Pennsylvania:
1.3% ($3,094)
Median real estate property taxes paid for housing units with mortgages in 2022: $1,866 (1.1%) Median real estate property taxes paid for housing units with no mortgage in 2022: $1,812 (1.1%)
Business Search- 14 Million verified businesses
Males: 2,286
(44.7%)
Females: 2,824
(55.3%)
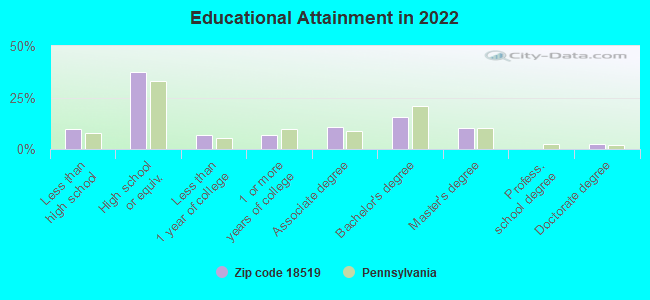
For population 25 years and over in 18519:
High school or higher: 90.2%
Bachelor's degree or higher: 28.3%
Graduate or professional degree: 12.6%
Unemployed: 6.5%
Mean travel time to work (commute): 26.7 minutes
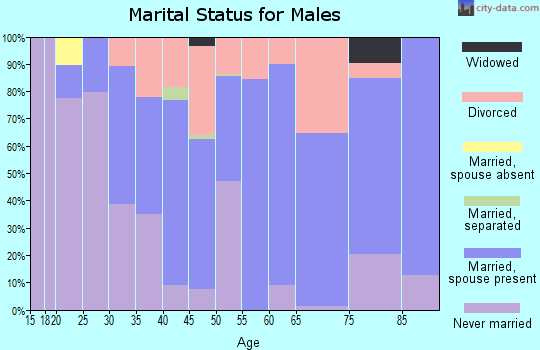
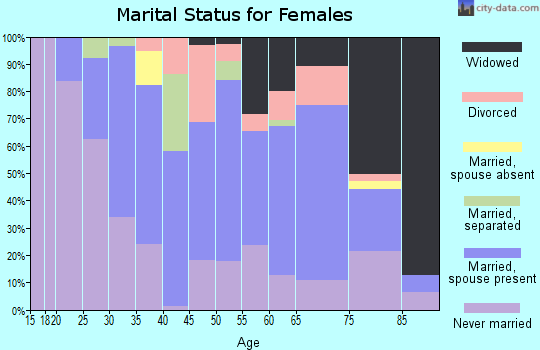
For population 15 years and over in 18519:
Never married: 30.0%
Now married: 48.6%
Separated: 3.1%
Widowed: 7.5%
Divorced: 10.9%
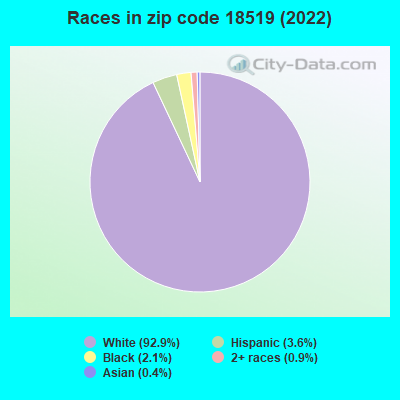
Zip code 18519 compared to state average:
Black race population percentage significantly below state average.
Hispanic race population percentage below state average.
Median age above state average.
Foreign-born population percentage significantly below state average.
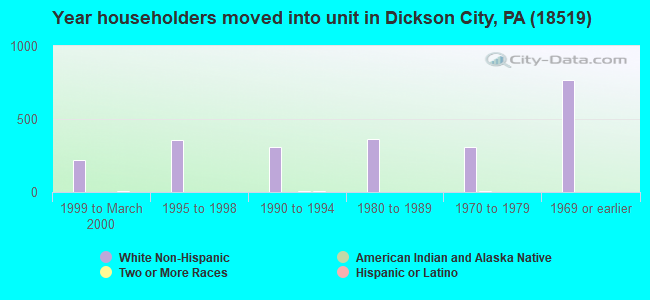
Length of stay since moving in significantly above state average.
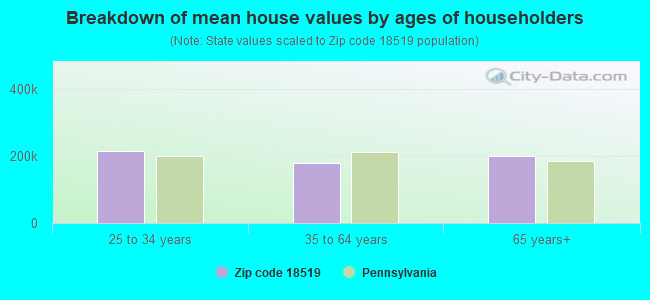
Estimated median house/condo value in 2022: $166,380
18519:
$166,380
Pennsylvania:
$245,500
According to our research of Pennsylvania and other state lists, there were 4 registered sex offenders living in 18519 zip code as of April 27, 2024. The ratio of all residents to sex offenders in zip code 18519 is 1,176 to 1. The ratio of registered sex offenders to all residents in this zip code is lower than the state average.
Median resident age:
This zip code:
45.1 years
Pennsylvania median age:
40.9 years
Average household size:
This zip code:
2.1 people
Pennsylvania:
2.4 people
Averages for the 2020 tax year for zip code 18519, filed in 2021:
Average Adjusted Gross Income (AGI) in 2020: $48,841 (Individual Income Tax Returns)
Here:
$48,841
State:
$75,707
Salary/wage: $43,548 (reported on 83.6% of returns)
Here:
$43,548
State:
$62,806
(% of AGI for various income ranges: 1118.7% for AGIs below $25k, 3511.6% for AGIs $25k-50k, 6277.4% for AGIs $50k-75k, 8571.4% for AGIs $75k-100k, 13305.9% for AGIs $100k-200k)
Taxable interest for individuals: $916 (reported on 25.5% of returns)
This zip code:
$916
Pennsylvania:
$1,633
(% of AGI for various income ranges: 20.8% for AGIs below $25k, 16.2% for AGIs $25k-50k, 26.3% for AGIs $50k-75k, 42.9% for AGIs $75k-100k, 99.4% for AGIs $100k-200k)
Ordinary dividends: $2,374 (reported on 17.1% of returns)
Here:
$2,374
State:
$7,382
(% of AGI for various income ranges: 23.0% for AGIs below $25k, 24.8% for AGIs $25k-50k, 44.6% for AGIs $50k-75k, 112.4% for AGIs $75k-100k, 144.7% for AGIs $100k-200k)
Net capital gain/loss in AGI: +$4,068 (reported on 11.3% of returns)
Here:
+$4,068
State:
+$23,522
(% of AGI for various income ranges: 8.4% for AGIs below $25k, 17.8% for AGIs $25k-50k, 31.1% for AGIs $50k-75k, 79.0% for AGIs $75k-100k, 232.9% for AGIs $100k-200k)
Profit/loss from business: +$10,779 (reported on 10.2% of returns)
Here:
+$10,779
State:
+$16,274
(% of AGI for various income ranges: 48.7% for AGIs below $25k, 83.3% for AGIs $25k-50k, 159.1% for AGIs $50k-75k, 190.5% for AGIs $75k-100k, 693.5% for AGIs $100k-200k)
Taxable individual retirement arrangement distribution: $10,713 (reported on 8.4% of returns)
18519:
$10,713
Pennsylvania:
$18,583
(% of AGI for various income ranges: 77.9% for AGIs below $25k, 58.7% for AGIs $25k-50k, 124.9% for AGIs $50k-75k, 196.2% for AGIs $75k-100k, 422.9% for AGIs $100k-200k)
Total itemized deductions: $22,120 (reported on 1.8% of returns)
Here:
$22,120
State:
$34,850
(% of AGI for various income ranges: 54.8% for AGIs $25k-50k, 346.7% for AGIs $75k-100k)
Charity contributions: $3,633 (reported on 1.1% of returns)
Here:
$3,633
State:
$12,392
(% of AGI for various income ranges: 51.9% for AGIs $75k-100k)
Taxes paid: $6,600 (reported on 1.8% of returns)
18519:
$6,600
State:
$8,200
(% of AGI for various income ranges: 13.0% for AGIs $25k-50k, 114.3% for AGIs $75k-100k)
Earned income credit: $2,148 (reported on 14.5% of returns)
Here:
$2,148
State:
$2,100
(% of AGI for various income ranges: 73.7% for AGIs below $25k, 57.2% for AGIs $25k-50k)
Percentage of individuals using paid preparers for their 2020 taxes: 93.5%
Here:
93%
State:
92%
(% for various income ranges: 92.4% for AGIs below $25k, 95.2% for AGIs $25k-50k, 93.3% for AGIs $50k-75k, 96.3% for AGIs $75k-100k, 91.3% for AGIs $100k-200k, 75.0% for AGIs over 200k)
Averages for the 2012 tax year for zip code 18519, filed in 2013:
Average Adjusted Gross Income (AGI) in 2012: $39,535 (Individual Income Tax Returns)
Here:
$39,535
State:
$61,346
Salary/wage: $35,017 (reported on 85.4% of returns)
Here:
$35,017
State:
$51,902
(% of AGI for various income ranges: 73.3% for AGIs below $25k, 81.7% for AGIs $25k-50k, 82.2% for AGIs $50k-75k, 80.4% for AGIs $75k-100k, 61.0% for AGIs $100k-200k)
Taxable interest for individuals: $941 (reported on 32.1% of returns)
This zip code:
$941
Pennsylvania:
$1,588
(% of AGI for various income ranges: 2.0% for AGIs below $25k, 0.7% for AGIs $25k-50k, 0.8% for AGIs $50k-75k, 0.6% for AGIs $75k-100k, 0.2% for AGIs $100k-200k)
Ordinary dividends: $1,950 (reported on 21.2% of returns)
Here:
$1,950
State:
$5,827
(% of AGI for various income ranges: 1.4% for AGIs below $25k, 0.8% for AGIs $25k-50k, 1.0% for AGIs $50k-75k, 0.5% for AGIs $75k-100k, 1.6% for AGIs $100k-200k)
Net capital gain/loss in AGI: +$683 (reported on 10.9% of returns)
Here:
+$683
State:
+$14,495
(% of AGI for various income ranges: 0.2% for AGIs $25k-50k, 0.5% for AGIs $75k-100k, 0.4% for AGIs $100k-200k)
Profit/loss from business: +$8,123 (reported on 9.5% of returns)
Here:
+$8,123
State:
+$16,268
(% of AGI for various income ranges: 3.4% for AGIs below $25k, 2.0% for AGIs $25k-50k, 1.6% for AGIs $50k-75k, 2.7% for AGIs $75k-100k, 0.9% for AGIs $100k-200k)
Taxable individual retirement arrangement distribution: $9,546 (reported on 9.5% of returns)
18519:
$9,546
Pennsylvania:
$14,550
(% of AGI for various income ranges: 3.5% for AGIs below $25k, 1.9% for AGIs $25k-50k, 1.0% for AGIs $50k-75k, 2.2% for AGIs $75k-100k, 3.4% for AGIs $100k-200k)
Total itemized deductions: $16,585 (19% of AGI, reported on 14.2% of returns)
Here:
$16,585
State:
$23,538
Here:
19.0% of AGI
State:
18.4% of AGI
(% of AGI for various income ranges: 2.7% for AGIs below $25k, 3.4% for AGIs $25k-50k, 5.6% for AGIs $50k-75k, 7.1% for AGIs $75k-100k, 10.3% for AGIs $100k-200k)
Charity contributions: $1,669 (reported on 10.6% of returns)
Here:
$1,669
State:
$4,025
(% of AGI for various income ranges: 0.1% for AGIs below $25k, 0.3% for AGIs $25k-50k, 0.4% for AGIs $50k-75k, 0.6% for AGIs $75k-100k, 0.8% for AGIs $100k-200k)
Taxes paid: $5,813 (reported on 14.2% of returns)
18519:
$5,813
State:
$9,982
(% of AGI for various income ranges: 0.6% for AGIs below $25k, 0.9% for AGIs $25k-50k, 1.8% for AGIs $50k-75k, 2.3% for AGIs $75k-100k, 4.4% for AGIs $100k-200k)
Earned income credit: $2,004 (reported on 16.4% of returns)
Here:
$2,004
State:
$2,106
(% of AGI for various income ranges: 4.6% for AGIs below $25k, 0.9% for AGIs $25k-50k)
Percentage of individuals using paid preparers for their 2012 taxes: 51.8%
Here:
52%
State:
53%
(% for various income ranges: 45.5% for AGIs below $25k, 51.3% for AGIs $25k-50k, 60.0% for AGIs $50k-75k, 63.2% for AGIs $75k-100k, 68.8% for AGIs $100k-200k)
Averages for the 2004 tax year for zip code 18519, filed in 2005:
Average Adjusted Gross Income (AGI) in 2004: $32,860 (Individual Income Tax Returns)
Here:
$32,860
State:
$48,049
Salary/wage: $31,492 (reported on 84.4% of returns)
Here:
$31,492
State:
$42,646
(% of AGI for various income ranges: 82.8% for AGIs below $10k, 74.8% for AGIs $10k-25k, 83.3% for AGIs $25k-50k, 85.2% for AGIs $50k-75k, 85.1% for AGIs $75k-100k, 68.5% for AGIs over 100k)
Taxable interest for individuals: $1,754 (reported on 51.8% of returns)
This zip code:
$1,754
Pennsylvania:
$1,657
(% of AGI for various income ranges: 9.1% for AGIs below $10k, 4.4% for AGIs $10k-25k, 2.5% for AGIs $25k-50k, 2.0% for AGIs $50k-75k, 3.3% for AGIs $75k-100k, 1.0% for AGIs over 100k)
Taxable dividends: $1,394 (reported on 25.3% of returns)
Here:
$1,394
State:
$3,566
(% of AGI for various income ranges: 2.7% for AGIs below $10k, 0.9% for AGIs $10k-25k, 0.9% for AGIs $25k-50k, 0.5% for AGIs $50k-75k, 1.0% for AGIs $75k-100k, 2.5% for AGIs over 100k)
Net capital gain/loss: +$1,749 (reported on 14.4% of returns)
Here:
+$1,749
State:
+$9,716
(% of AGI for various income ranges: -0.8% for AGIs below $10k, 0.3% for AGIs $10k-25k, 0.5% for AGIs $25k-50k, 1.1% for AGIs $50k-75k, 1.1% for AGIs $75k-100k, 1.1% for AGIs over 100k)
Profit/loss from business: +$9,833 (reported on 9.3% of returns)
Here:
+$9,833
State:
+$14,267
(% of AGI for various income ranges: 7.1% for AGIs below $10k, 3.0% for AGIs $10k-25k, 2.0% for AGIs $25k-50k, 1.8% for AGIs $50k-75k, 0.4% for AGIs $75k-100k, 7.9% for AGIs over 100k)
IRA payment deduction: $3,028 (reported on 2.6% of returns)
18519:
$3,028
Pennsylvania:
$2,903
Total itemized deductions: $13,420 (20% of AGI, reported on 14.7% of returns)
Here:
$13,420
State:
$18,804
Here:
19.5% of AGI
State:
19.5% of AGI
(% of AGI for various income ranges: 2.7% for AGIs $10k-25k, 5.0% for AGIs $25k-50k, 6.1% for AGIs $50k-75k, 9.0% for AGIs $75k-100k, 9.7% for AGIs over 100k)
Charity contributions deductions: $1,504 (2% of AGI, reported on 13.4% of returns)
Here:
$1,504
State:
$3,337
Here:
2.1% of AGI
State:
3.3% of AGI
(% of AGI for various income ranges: 0.2% for AGIs $10k-25k, 0.4% for AGIs $25k-50k, 0.6% for AGIs $50k-75k, 1.0% for AGIs $75k-100k, 1.4% for AGIs over 100k)
Total tax: $3,979 (reported on 74.3% of returns)
18519:
$3,979
State:
$8,008
(% of AGI for various income ranges: 2.2% for AGIs below $10k, 4.3% for AGIs $10k-25k, 7.4% for AGIs $25k-50k, 9.1% for AGIs $50k-75k, 11.0% for AGIs $75k-100k, 16.5% for AGIs over 100k)
Earned income credit: $1,537 (reported on 12.7% of returns)
Here:
$1,537
State:
$1,643
Percentage of individuals using paid preparers for their 2004 taxes: 55.3%
Here:
55%
State:
56%
(% for various income ranges: 48.6% for AGIs below $10k, 49.9% for AGIs $10k-25k, 58.0% for AGIs $25k-50k, 62.9% for AGIs $50k-75k, 66.2% for AGIs $75k-100k, 75.6% for AGIs over 100k)
Likely homosexual households (counted as self-reported same-sex unmarried-partner households)
Lesbian couples: 0.5% of all households
Gay men: 0.0% of all households
Household received Food Stamps/SNAP in the past 12 months: 576 Household did not receive Food Stamps/SNAP in the past 12 months: 1,892
Women who had a birth in the past 12 months: 9 (9 now married, 0 unmarried) Women who did not have a birth in the past 12 months: 977 (404 now married, 572 unmarried)
Housing units in zip code 18519 with a mortgage: 776 (120 second mortgage, 119 both second mortgage and home equity loan) Median monthly owner costs for units with a mortgage: $1,357 Median monthly owner costs for units without a mortgage: $494
Residents with income below the poverty level in 2022:
This zip code:
13.3%
Whole state:
11.8%
Residents with income below 50% of the poverty level in 2022:
This zip code:
4.1%
Whole state:
6.1%
Median number of rooms in houses and condos:
Here:
6.3
State:
6.8
Median number of rooms in apartments:
Here:
4.4
State:
4.3
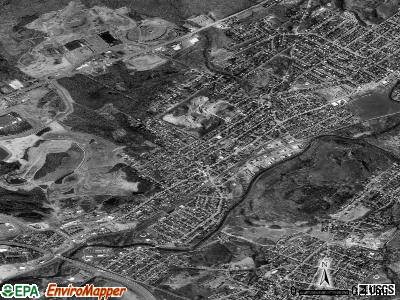
Notable locations in this zip code not listed on our city pages
Notable locations in zip code 18519: Dickson Station (A), Dickson City Fire Department Eagle Hose Company 1 Station 23 (B), Jermyn Number Four Breaker (C). Display/hide their locations on the map
In group quarters: 17 (-1 institutionalized population)
Size of family households: 809 2-persons, 210 3-persons, 135 4-persons, 177 5-persons
Size of nonfamily households: 816 1-person, 332 2-persons
601 married couples with children.
424 single-parent households (144 men, 280 women).
96.5% of residents of 18519 zip code speak English at home.
2.1% of residents speak Spanish at home (81% very well, 13% well, 6% not at all).
1.0% of residents speak other Indo-European language at home (86% very well, 14% not well).
0.1% of residents speak other language at home (100% very well).
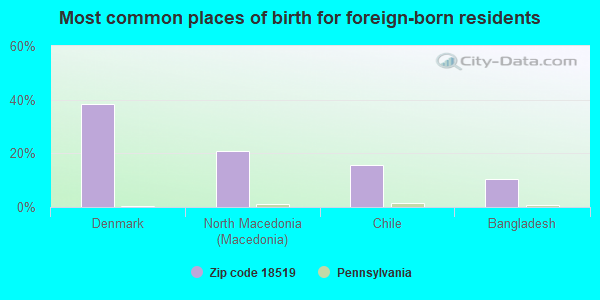
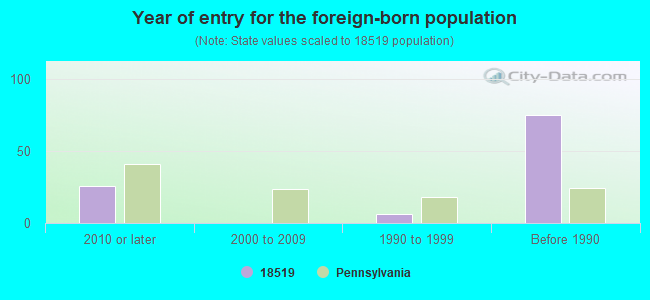
Foreign born population: 96 (1.9%) (49.4% of them are naturalized citizens)
This zip code:
1.9%
Whole state:
7.5%
39%Denmark
21%North Macedonia (Macedonia)
16%Chile
10%Bangladesh
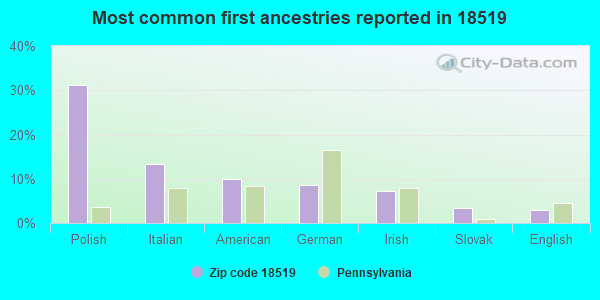
31%Polish
13%Italian
10%American
9%German
7%Irish
3%Slovak
3%English
Year of entry for the foreign-born population
262010 or later
02000 to 2009
61990 to 1999
75Before 1990
Facilities with environmental interests located in this zip code:
KIMS QUALITY CLNR / DICKSON CITY (801 BOULEVARD AVENUE in DICKSON CITY, PA)
AIR MINOR (AIRS/AFS) Small Quantity Generators, between 100 kg and 1000 kg of hazardous waste/month (Resource Conservation and Recovery Act (tracking hazardous waste)) - notification Business SIC classification: DRYCLEANING PLANTS, EXCEPT RUG CLEANING Organizations: OPERNAME (CONTACT/OPERATOR)
, REMBECKI, JOHN (CONTACT/OWNER)
Alternative names: BECKS CLEANERS, BECKS CLEANER SERVICE
Housing units lacking complete kitchen facilities: 0.3%
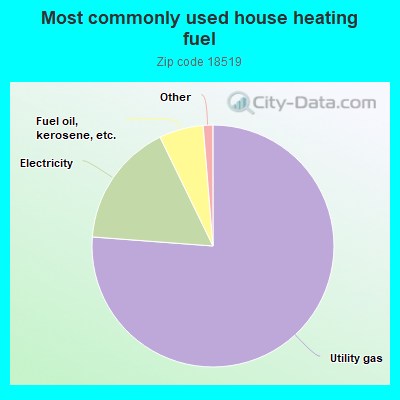
76.2%Utility gas
16.6%Electricity
5.9%Fuel oil, kerosene, etc.
Population in 1990: 5,012. Population change in the 1990s: +310 (+6.2%).
Place of birth for U.S.-born residents:
This state: 4,270
Northeast: 564
Midwest: 24
South: 55
West: 54
72% of the 18519 zip code residents lived in the same house 5 years ago. Out of people who lived in different houses, 83% lived in this county. Out of people who lived in different counties, 50% lived in Pennsylvania.
95% of the 18519 zip code residents lived in the same house 1 year ago. Out of people who lived in different houses, 100% moved from this county.
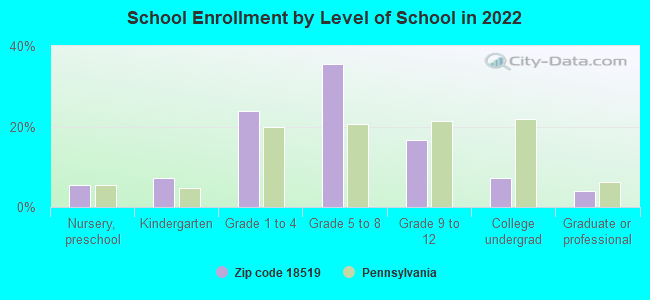
Private vs. public school enrollment:
Students in private schools in grades 1 to 8 (elementary and middle school): 201
Here:
29.8%
Pennsylvania:
15.7%
Students in private schools in grades 9 to 12 (high school): 4
Here:
2.3%
Pennsylvania:
13.4%
Students in private undergraduate colleges: 23
Here:
29.3%
Pennsylvania:
39.8%
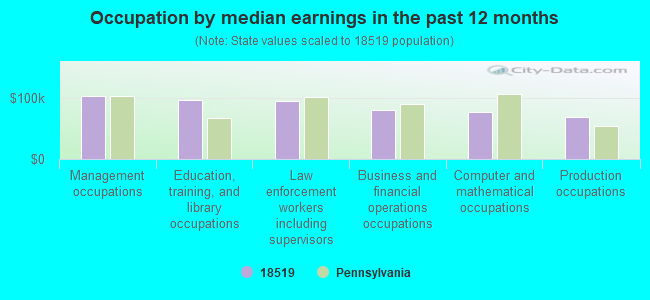
Occupation by median earnings in the past 12 months ($)
102,952Management occupations
95,440Education, training, and library occupations
95,145Law enforcement workers including supervisors
79,815Business and financial operations occupations
76,675Computer and mathematical occupations
69,136Production occupations
Companies with federal contracts located in this zip code:
NORTHEAST SURGERY CENTER (423 SCRANTON CARBONDALE HWY. in DICKSON CITY, PA; small business) : $1,803,313 in 374 contractsfrom 2004 to 2006
Contracts for Replenishable Field Medical Sets, Kits, and Outfits, Health Services -- Advanced Development (R&D), Laboratory Testing Services, Waste Treatment and Storage, and moreby Bureau of Prisoners/Federal Prison System Signed by year:2000: $0; 2001: $0; 2002: $0; 2003: $0; 2004: $183,000; 2005: $1,431,976; 2006: $188,337.
Biggest contracts:
$98,506 with Bureau of Prisoners/Federal Prison System for Replenishable Field Medical Sets, Kits, and Outfits. Taking place in NC. Signed on 2004-10-01. Completion date: 2005-09-30.
$60,000 with Bureau of Prisoners/Federal Prison System for Health Services -- Advanced Development (R&D). Taking place in IL. Signed on 2004-11-17. Completion date: 2004-11-24.
$39,300 with Bureau of Prisoners/Federal Prison System for Laboratory Testing Services. Taking place in LA. Signed on 2005-10-03. Completion date: 2006-09-30.
$28,300 with Bureau of Prisoners/Federal Prison System for Waste Treatment and Storage. Taking place in KY. Signed on 2005-11-01. Completion date: 2006-09-30.
SINIAWA CO 10 (RTE 6 in DICKSON CITY, PA; small business) : $99,252 in 44 contractsfrom 2002 to 2006
Contracts for Lease or Rental of Facilities -- Office Buildings by Public Buildings Service Signed by year:2000: $0; 2001: $0; 2002: $10,306; 2003: $43,074; 2004: $3,476; 2005: $23,286; 2006: $19,110.
Biggest contracts:
$5,175 with Public Buildings Service for Lease or Rental of Facilities -- Office Buildings. Signed on 2003-06-15. Completion date: 2003-06-15.
$5,175, same as above.Signed on 2003-09-15. Completion date: 2003-09-15.
$5,153, same as above.Signed on 2002-12-15. Completion date: 2002-12-15.
$5,153, same as above.Signed on 2003-09-15. Completion date: 2003-09-15.
DESIGN HOME GALLERY INC (2266 RT 6 SCRANTON/CARBON in DICKSON CITY, PA; small business) : $13,359 in 2 contractsfrom 2003 to 2004
$7,762 with Army for Floor Coverings. Signed on 2003-05-28. Completion date: 2003-06-13.
$5,597 with Army for Plastics Fabricated Materials. Signed on 2004-02-17. Completion date: 2004-03-05.
F J HAGER INC (919 VIEWMONT DR in SCRANTON, PA; small business)
$3,650 with Army for Household Furniture. Signed on 2004-10-25. Completion date: 2004-11-30.
Top industries in this zip code by the number of employees in 2005:
Administrative and Support and Waste Management and Remediation Services: Temporary Help Services (250-499 employees: 1 establishment)
Detailed PMIC statistics for the following Tracts:1115.00
, 1116.00
2003 - 2018 National Fire Incident Reporting System (NFIRS) incidents
Based on the data from the years 2003 - 2018 the average number of fires per year is 13. The highest number of reported fires - 50 took place in 2013, and the least - 0 in 2004. The data has a growing trend.
When looking into fire subcategories, the most reports belonged to: Structure Fires (41.8%), and Outside Fires (32.7%).
Fire incident types reported to NFIRS in Zip Code 18519

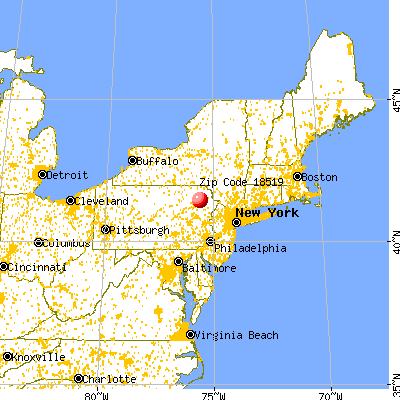


 Nearest zip codes: 18508, 18509, 18452, 18512, 18510, 18447.


 Based on the data from the years 2003 - 2018 the average number of fires per year is 13. The highest number of reported fires - 50 took place in 2013, and the least - 0 in 2004. The data has a growing trend.
 When looking into fire subcategories, the most reports belonged to: Structure Fires (41.8%), and Outside Fires (32.7%).