Estimated zip code population in 2022: 1,374 Zip code population in 2010: 1,924 Zip code population in 2000: 1,892
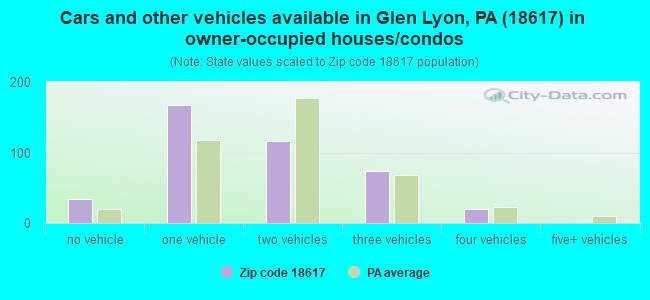
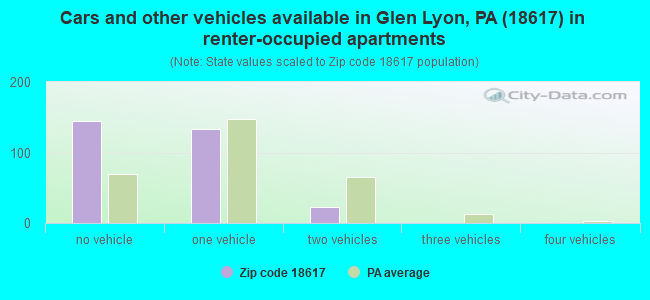
Houses and condos: 951 Renter-occupied apartments: 302
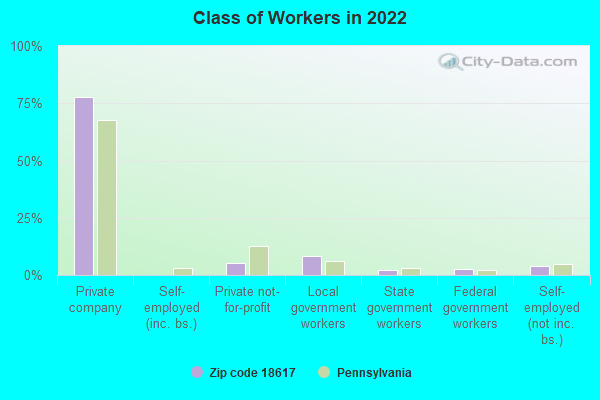
% of renters here:
42%
State:
31%
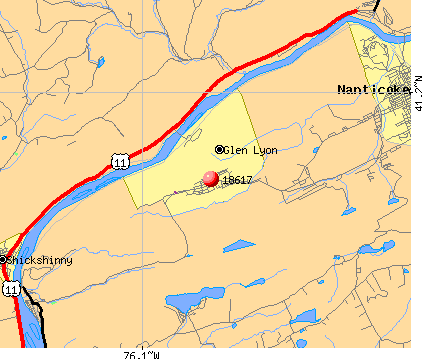
March 2022 cost of living index in zip code 18617: 93.1 (less than average, U.S. average is 100)
Land area: 6.1 sq. mi. Water area: 0.2 sq. mi.
Population density: 227 people per square mile
(very low).
OSM Map
General Map
Google Map
MSN Map
OSM Map
General Map
Google Map
MSN Map
OSM Map
General Map
Google Map
MSN Map
OSM Map
General Map
Google Map
MSN Map
Please wait while loading the map...
Real estate property taxes paid for housing units in 2022:
This zip code:
1.2% ($1,028)
Pennsylvania:
1.3% ($3,094)
Median real estate property taxes paid for housing units with mortgages in 2022: $994 (1.1%) Median real estate property taxes paid for housing units with no mortgage in 2022: $1,058 (1.2%)
Averages for the 2020 tax year for zip code 18617, filed in 2021:
Average Adjusted Gross Income (AGI) in 2020: $38,595 (Individual Income Tax Returns)
Here:
$38,595
State:
$75,707
Salary/wage: $33,740 (reported on 84.3% of returns)
Here:
$33,740
State:
$62,806
(% of AGI for various income ranges: 1010.4% for AGIs below $25k, 3292.0% for AGIs $25k-50k, 5190.9% for AGIs $50k-75k, 8465.0% for AGIs $75k-100k, 12216.7% for AGIs $100k-200k)
Taxable interest for individuals: $442 (reported on 14.5% of returns)
This zip code:
$442
Pennsylvania:
$1,633
(% of AGI for various income ranges: 3.1% for AGIs below $25k, 1.6% for AGIs $25k-50k, 9.1% for AGIs $50k-75k, 77.5% for AGIs $75k-100k)
Ordinary dividends: $817 (reported on 7.2% of returns)
Here:
$817
State:
$7,382
(% of AGI for various income ranges: 6.9% for AGIs below $25k, 28.2% for AGIs $50k-75k)
Net capital gain/loss in AGI: +$800 (reported on 3.6% of returns)
Here:
+$800
State:
+$23,522
(% of AGI for various income ranges: 9.6% for AGIs $25k-50k)
Profit/loss from business: +$2,920 (reported on 6.0% of returns)
Here:
+$2,920
State:
+$16,274
(% of AGI for various income ranges: 50.0% for AGIs below $25k, 14.5% for AGIs $50k-75k)
Taxable individual retirement arrangement distribution: $7,200 (reported on 4.8% of returns)
18617:
$7,200
Pennsylvania:
$18,583
(% of AGI for various income ranges: 55.4% for AGIs below $25k, 130.9% for AGIs $50k-75k)
Earned income credit: $2,305 (reported on 22.9% of returns)
Here:
$2,305
State:
$2,100
(% of AGI for various income ranges: 104.6% for AGIs below $25k, 66.4% for AGIs $25k-50k)
Percentage of individuals using paid preparers for their 2020 taxes: 95.2%
Here:
95%
State:
92%
(% for various income ranges: 93.9% for AGIs below $25k, 96.4% for AGIs $25k-50k, 92.3% for AGIs $50k-75k, 100.0% for AGIs $75k-100k, 100.0% for AGIs $100k-200k)
Averages for the 2012 tax year for zip code 18617, filed in 2013:
Average Adjusted Gross Income (AGI) in 2012: $32,747 (Individual Income Tax Returns)
Here:
$32,747
State:
$61,346
Salary/wage: $30,019 (reported on 84.0% of returns)
Here:
$30,019
State:
$51,902
(% of AGI for various income ranges: 70.9% for AGIs below $25k, 78.5% for AGIs $25k-50k, 77.8% for AGIs $50k-75k, 78.5% for AGIs $75k-100k)
Taxable interest for individuals: $424 (reported on 21.0% of returns)
This zip code:
$424
Pennsylvania:
$1,588
(% of AGI for various income ranges: 0.3% for AGIs below $25k, 0.1% for AGIs $25k-50k, 0.6% for AGIs $50k-75k)
Ordinary dividends: $612 (reported on 9.9% of returns)
Here:
$612
State:
$5,827
(% of AGI for various income ranges: 0.1% for AGIs below $25k, 0.3% for AGIs $25k-50k, 0.2% for AGIs $50k-75k)
Profit/loss from business: +$17,580 (reported on 6.2% of returns)
Here:
+$17,580
State:
+$16,268
(% of AGI for various income ranges: 3.5% for AGIs below $25k, 7.9% for AGIs $25k-50k)
Taxable individual retirement arrangement distribution: $8,360 (reported on 6.2% of returns)
18617:
$8,360
Pennsylvania:
$14,550
(% of AGI for various income ranges: 2.5% for AGIs below $25k, 3.3% for AGIs $25k-50k)
Total itemized deductions: $10,383 (19% of AGI, reported on 7.4% of returns)
Here:
$10,383
State:
$23,538
Here:
18.9% of AGI
State:
18.4% of AGI
(% of AGI for various income ranges: 5.1% for AGIs below $25k, 5.7% for AGIs $50k-75k)
Charity contributions: $1,167 (reported on 3.7% of returns)
Here:
$1,167
State:
$4,025
Taxes paid: $3,440 (reported on 6.2% of returns)
18617:
$3,440
State:
$9,982
(% of AGI for various income ranges: 1.2% for AGIs below $25k, 1.7% for AGIs $50k-75k)
Earned income credit: $2,455 (reported on 24.7% of returns)
Here:
$2,455
State:
$2,106
(% of AGI for various income ranges: 7.6% for AGIs below $25k, 1.5% for AGIs $25k-50k)
Percentage of individuals using paid preparers for their 2012 taxes: 54.3%
Here:
54%
State:
53%
(% for various income ranges: 51.3% for AGIs below $25k, 56.0% for AGIs $25k-50k, 63.6% for AGIs $50k-75k, 50.0% for AGIs $75k-100k)
Averages for the 2004 tax year for zip code 18617, filed in 2005:
Average Adjusted Gross Income (AGI) in 2004: $29,126 (Individual Income Tax Returns)
Here:
$29,126
State:
$48,049
Salary/wage: $27,698 (reported on 87.9% of returns)
Here:
$27,698
State:
$42,646
(% of AGI for various income ranges: 75.0% for AGIs below $10k, 80.5% for AGIs $10k-25k, 84.0% for AGIs $25k-50k, 87.9% for AGIs $50k-75k, 82.5% for AGIs $75k-100k, 81.8% for AGIs over 100k)
Taxable interest for individuals: $671 (reported on 35.1% of returns)
This zip code:
$671
Pennsylvania:
$1,657
(% of AGI for various income ranges: 2.8% for AGIs below $10k, 1.6% for AGIs $10k-25k, 0.7% for AGIs $25k-50k, 0.4% for AGIs $50k-75k, 0.2% for AGIs $75k-100k, 0.1% for AGIs over 100k)
Taxable dividends: $488 (reported on 15.3% of returns)
Here:
$488
State:
$3,566
(% of AGI for various income ranges: 0.7% for AGIs below $10k, 0.2% for AGIs $10k-25k, 0.4% for AGIs $25k-50k, 0.2% for AGIs $50k-75k, 0.0% for AGIs $75k-100k)
Net capital gain/loss: +$36 (reported on 6.7% of returns)
Here:
+$36
State:
+$9,716
Profit/loss from business: +$4,957 (reported on 5.6% of returns)
Here:
+$4,957
State:
+$14,267
Total itemized deductions: $11,954 (23% of AGI, reported on 8.0% of returns)
Here:
$11,954
State:
$18,804
Here:
22.7% of AGI
State:
19.5% of AGI
(% of AGI for various income ranges: 2.6% for AGIs $10k-25k, 3.2% for AGIs $25k-50k, 3.6% for AGIs $50k-75k, 8.0% for AGIs $75k-100k)
Charity contributions deductions: $1,288 (3% of AGI, reported on 6.4% of returns)
Here:
$1,288
State:
$3,337
Here:
2.5% of AGI
State:
3.3% of AGI
Total tax: $3,149 (reported on 70.1% of returns)
18617:
$3,149
State:
$8,008
(% of AGI for various income ranges: 1.8% for AGIs below $10k, 4.0% for AGIs $10k-25k, 6.9% for AGIs $25k-50k, 8.9% for AGIs $50k-75k, 12.0% for AGIs $75k-100k, 14.9% for AGIs over 100k)
Earned income credit: $1,694 (reported on 22.5% of returns)
Here:
$1,694
State:
$1,643
Percentage of individuals using paid preparers for their 2004 taxes: 56.7%
Here:
57%
State:
56%
(% for various income ranges: 48.2% for AGIs below $10k, 56.2% for AGIs $10k-25k, 59.9% for AGIs $25k-50k, 61.4% for AGIs $50k-75k, 96.2% for AGIs $75k-100k)
Likely homosexual households (counted as self-reported same-sex unmarried-partner households)
Lesbian couples: 1.2% of all households
Gay men: 0.0% of all households
Household received Food Stamps/SNAP in the past 12 months: 207 Household did not receive Food Stamps/SNAP in the past 12 months: 515
Women who did not have a birth in the past 12 months: 268 (118 now married, 149 unmarried)
Housing units in zip code 18617 with a mortgage: 153 (20 second mortgage, 20 both second mortgage and home equity loan) Median monthly owner costs for units with a mortgage: $1,046 Median monthly owner costs for units without a mortgage: $380
Residents with income below the poverty level in 2022:
This zip code:
17.7%
Whole state:
11.8%
Residents with income below 50% of the poverty level in 2022:
This zip code:
7.3%
Whole state:
6.1%
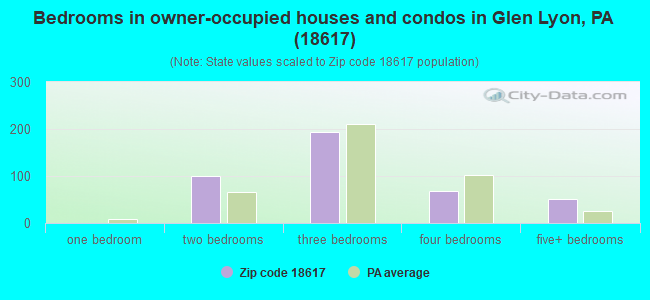
Median number of rooms in houses and condos:
Here:
6.5
State:
6.8
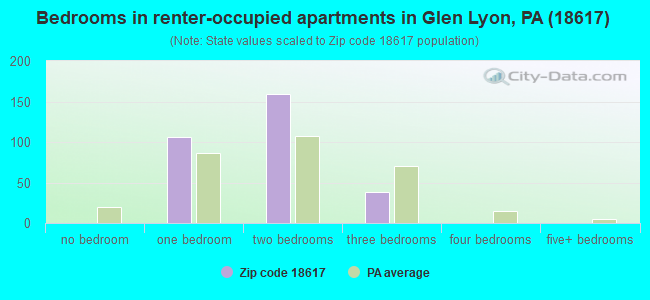
Median number of rooms in apartments:
Here:
4.1
State:
4.3
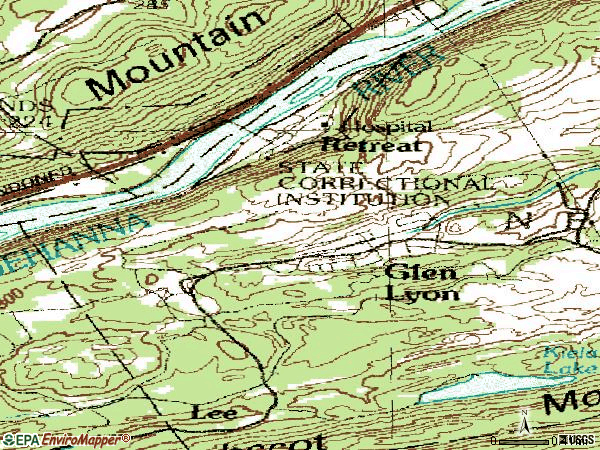
Notable locations in this zip code not listed on our city pages
Size of family households: 170 2-persons, 71 3-persons, 41 4-persons, 10 5-persons, 13 6-persons
Size of nonfamily households: 377 1-person, 33 2-persons
79 married couples with children.
74 single-parent households (4 men, 70 women).
98.0% of residents of 18617 zip code speak English at home.
0.4% of residents speak Spanish at home (100% very well).
0.9% of residents speak other Indo-European language at home (25% very well, 75% well).
Foreign born population: 0 (0.0%)
:
0.0%
Whole state:
7.5%
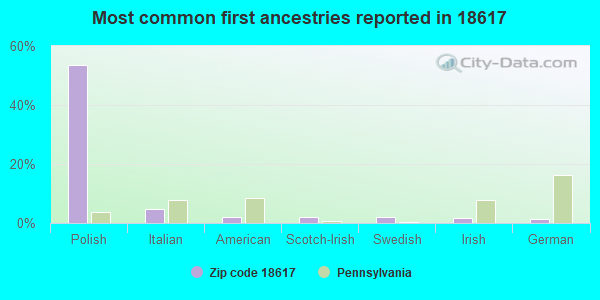
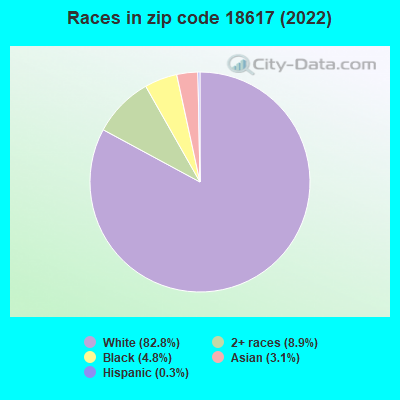
54%Polish
5%Italian
2%American
2%Scotch-Irish
2%Swedish
2%Irish
1%German
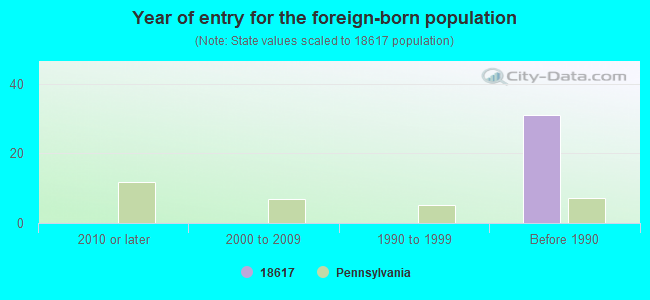
Year of entry for the foreign-born population
02010 or later
02000 to 2009
01990 to 1999
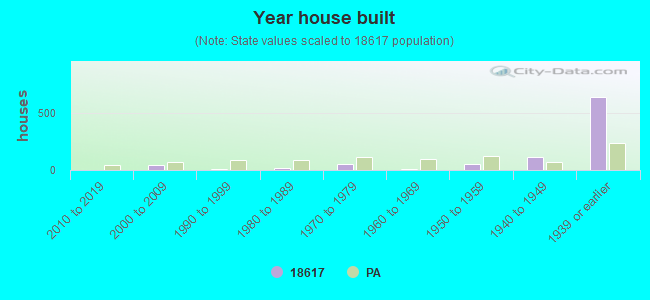
31Before 1990
Housing units lacking complete plumbing facilities: 16.8% Housing units lacking complete kitchen facilities: 12.3%
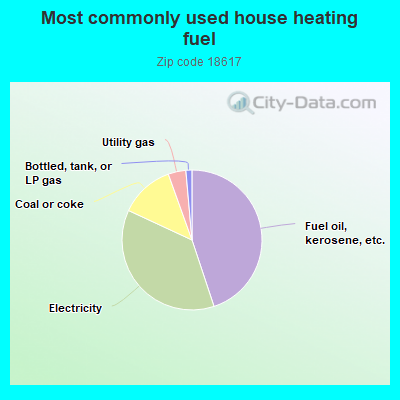
45.0%Fuel oil, kerosene, etc.
37.1%Electricity
12.6%Coal or coke
4.1%Utility gas
1.4%Bottled, tank, or LP gas
Population in 1990: 2,082.
Place of birth for U.S.-born residents:
This state: 1,158
Northeast: 82
Midwest: 27
South: 18
West: 44
65% of the 18617 zip code residents lived in the same house 5 years ago. Out of people who lived in different houses, 86% lived in this county. Out of people who lived in different counties, 50% lived in Pennsylvania.
98% of the 18617 zip code residents lived in the same house 1 year ago. Out of people who lived in different houses, 113% moved from this county.
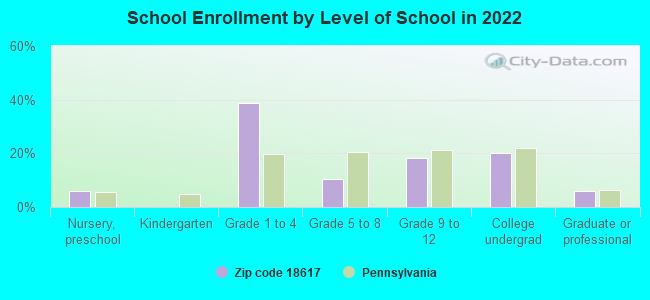
Private vs. public school enrollment:
Students in private schools in grades 1 to 8 (elementary and middle school): 52
Here:
86.8%
Pennsylvania:
15.7%
Students in private schools in grades 9 to 12 (high school):
Here:
0.0%
Pennsylvania:
13.4%
Students in private undergraduate colleges:
Here:
0.0%
Pennsylvania:
39.8%
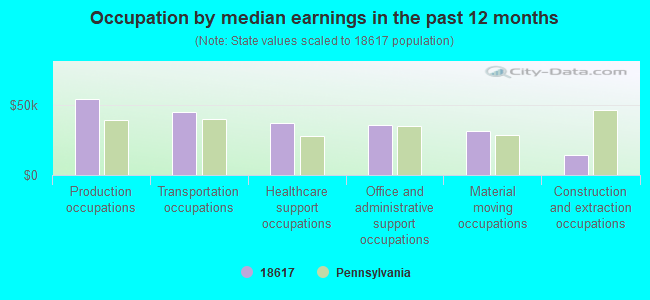
Occupation by median earnings in the past 12 months ($)
54,037Production occupations
44,631Transportation occupations
36,700Healthcare support occupations
35,201Office and administrative support occupations
31,113Material moving occupations
14,231Construction and extraction occupations
Top industries in this zip code by the number of employees in 2005:
Construction: New Single-Family Housing Construction (except Operative Builders) (5-9 employees: 1 establishment)
Other Services (except Public Administration): Civic and Social Organizations (1-4: 2)
Real Estate and Rental and Leasing: Lessors of Residential Buildings and Dwellings (1-4: 1)
Construction: Residential Remodelers (1-4: 1)
Accommodation and Food Services: Limited-Service Restaurants (1-4: 1)
Other Services (except Public Administration): Religious Organizations (1-4: 1)
Other Services (except Public Administration): Funeral Homes and Funeral Services (1-4: 1)
Professional, Scientific, and Technical Services: Other Services Related to Advertising (1-4: 1)
Home Mortgage Disclosure Act Aggregated Statistics For Year 2009 (Based on 2 partial tracts)
A) FHA, FSA/RHS & VA Home Purchase Loans
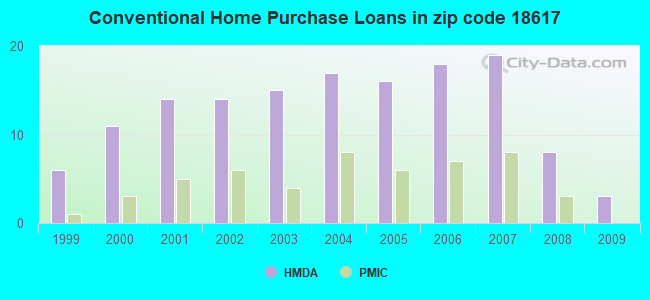
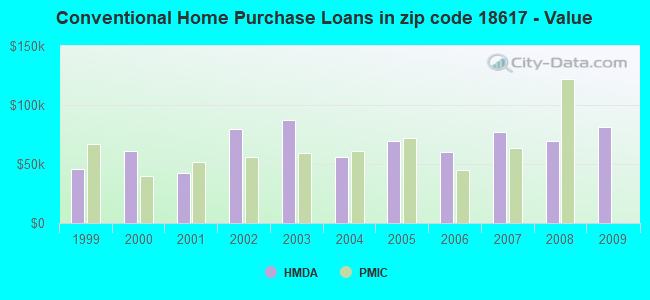
B) Conventional Home Purchase Loans
C) Refinancings
D) Home Improvement Loans
F) Non-occupant Loans on < 5 Family Dwellings (A B C & D)
G) Loans On Manufactured Home Dwelling (A B C & D)
Number
Average Value
Number
Average Value
Number
Average Value
Number
Average Value
Number
Average Value
Number
Average Value
LOANS ORIGINATED
5
$101,434
3
$81,240
15
$90,915
6
$16,905
1
$20,190
1
$48,370
APPLICATIONS APPROVED, NOT ACCEPTED
0
$0
1
$139,000
1
$108,480
1
$19,720
0
$0
0
$0
APPLICATIONS DENIED
2
$115,285
4
$69,735
14
$77,216
4
$38,742
1
$56,820
0
$0
APPLICATIONS WITHDRAWN
1
$81,240
0
$0
6
$77,172
0
$0
0
$0
0
$0
FILES CLOSED FOR INCOMPLETENESS
0
$0
0
$0
1
$93,450
0
$0
0
$0
0
$0
Aggregated Statistics For Year 2008 (Based on 2 partial tracts)
A) FHA, FSA/RHS & VA Home Purchase Loans
B) Conventional Home Purchase Loans
C) Refinancings
D) Home Improvement Loans
F) Non-occupant Loans on < 5 Family Dwellings (A B C & D)
G) Loans On Manufactured Home Dwelling (A B C & D)
Number
Average Value
Number
Average Value
Number
Average Value
Number
Average Value
Number
Average Value
Number
Average Value
LOANS ORIGINATED
5
$72,600
8
$69,442
11
$74,837
9
$23,741
1
$69,500
0
$0
APPLICATIONS APPROVED, NOT ACCEPTED
1
$76,080
0
$0
3
$93,763
1
$7,510
0
$0
1
$76,080
APPLICATIONS DENIED
0
$0
2
$49,310
26
$78,604
8
$34,515
1
$30,520
0
$0
APPLICATIONS WITHDRAWN
1
$55,410
1
$49,310
8
$83,589
0
$0
1
$63,870
0
$0
FILES CLOSED FOR INCOMPLETENESS
1
$109,420
0
$0
1
$52,130
0
$0
0
$0
0
$0
Aggregated Statistics For Year 2007 (Based on 2 partial tracts)
A) FHA, FSA/RHS & VA Home Purchase Loans
B) Conventional Home Purchase Loans
C) Refinancings
D) Home Improvement Loans
F) Non-occupant Loans on < 5 Family Dwellings (A B C & D)
Number
Average Value
Number
Average Value
Number
Average Value
Number
Average Value
Number
Average Value
LOANS ORIGINATED
1
$102,840
19
$76,767
25
$70,816
12
$29,468
3
$43,987
APPLICATIONS APPROVED, NOT ACCEPTED
0
$0
1
$50,250
5
$54,568
1
$46,960
0
$0
APPLICATIONS DENIED
0
$0
4
$68,445
37
$74,375
19
$58,749
0
$0
APPLICATIONS WITHDRAWN
0
$0
1
$39,450
11
$67,324
2
$59,170
1
$48,840
FILES CLOSED FOR INCOMPLETENESS
0
$0
1
$87,820
4
$117,635
0
$0
0
$0
Aggregated Statistics For Year 2006 (Based on 2 partial tracts)
A) FHA, FSA/RHS & VA Home Purchase Loans
B) Conventional Home Purchase Loans
C) Refinancings
D) Home Improvement Loans
F) Non-occupant Loans on < 5 Family Dwellings (A B C & D)
G) Loans On Manufactured Home Dwelling (A B C & D)
Number
Average Value
Number
Average Value
Number
Average Value
Number
Average Value
Number
Average Value
Number
Average Value
LOANS ORIGINATED
1
$133,840
18
$60,552
21
$65,162
13
$29,512
4
$39,448
0
$0
APPLICATIONS APPROVED, NOT ACCEPTED
0
$0
1
$101,430
3
$71,223
1
$41,790
0
$0
0
$0
APPLICATIONS DENIED
0
$0
7
$50,113
32
$76,251
13
$30,958
2
$28,410
1
$36,630
APPLICATIONS WITHDRAWN
0
$0
3
$33,967
23
$74,626
2
$66,215
1
$82,180
0
$0
FILES CLOSED FOR INCOMPLETENESS
0
$0
3
$76,077
8
$79,186
1
$35,690
0
$0
0
$0
Aggregated Statistics For Year 2005 (Based on 2 partial tracts)
B) Conventional Home Purchase Loans
C) Refinancings
D) Home Improvement Loans
F) Non-occupant Loans on < 5 Family Dwellings (A B C & D)
Number
Average Value
Number
Average Value
Number
Average Value
Number
Average Value
LOANS ORIGINATED
16
$69,736
31
$66,547
15
$23,417
5
$71,660
APPLICATIONS APPROVED, NOT ACCEPTED
3
$60,890
10
$66,214
1
$16,440
0
$0
APPLICATIONS DENIED
4
$44,965
51
$66,131
14
$48,570
5
$40,856
APPLICATIONS WITHDRAWN
6
$48,212
24
$73,766
4
$65,745
3
$54,003
FILES CLOSED FOR INCOMPLETENESS
0
$0
3
$83,433
1
$21,130
0
$0
Aggregated Statistics For Year 2004 (Based on 2 partial tracts)
A) FHA, FSA/RHS & VA Home Purchase Loans
B) Conventional Home Purchase Loans
C) Refinancings
D) Home Improvement Loans
F) Non-occupant Loans on < 5 Family Dwellings (A B C & D)
G) Loans On Manufactured Home Dwelling (A B C & D)
Number
Average Value
Number
Average Value
Number
Average Value
Number
Average Value
Number
Average Value
Number
Average Value
LOANS ORIGINATED
3
$72,473
17
$56,214
31
$66,744
15
$26,548
7
$44,009
0
$0
APPLICATIONS APPROVED, NOT ACCEPTED
0
$0
2
$44,375
10
$58,606
4
$26,298
3
$32,403
0
$0
APPLICATIONS DENIED
0
$0
5
$36,254
47
$61,378
16
$28,499
6
$26,610
1
$40,390
APPLICATIONS WITHDRAWN
0
$0
4
$109,300
20
$73,540
1
$35,220
1
$71,380
0
$0
FILES CLOSED FOR INCOMPLETENESS
0
$0
2
$80,535
1
$104,250
0
$0
0
$0
0
$0
Aggregated Statistics For Year 2003 (Based on 2 partial tracts)
A) FHA, FSA/RHS & VA Home Purchase Loans
B) Conventional Home Purchase Loans
C) Refinancings
D) Home Improvement Loans
F) Non-occupant Loans on < 5 Family Dwellings (A B C & D)
Number
Average Value
Number
Average Value
Number
Average Value
Number
Average Value
Number
Average Value
LOANS ORIGINATED
4
$71,028
15
$87,659
53
$60,330
8
$23,891
5
$39,352
APPLICATIONS APPROVED, NOT ACCEPTED
0
$0
3
$42,263
17
$49,501
4
$29,585
0
$0
APPLICATIONS DENIED
1
$45,080
2
$45,550
45
$66,412
10
$29,397
2
$84,060
APPLICATIONS WITHDRAWN
0
$0
2
$92,980
15
$82,086
0
$0
0
$0
FILES CLOSED FOR INCOMPLETENESS
0
$0
1
$36,630
1
$228,700
0
$0
0
$0
Aggregated Statistics For Year 2002 (Based on 2 partial tracts)
A) FHA, FSA/RHS & VA Home Purchase Loans
B) Conventional Home Purchase Loans
C) Refinancings
D) Home Improvement Loans
F) Non-occupant Loans on < 5 Family Dwellings (A B C & D)
Number
Average Value
Number
Average Value
Number
Average Value
Number
Average Value
Number
Average Value
LOANS ORIGINATED
1
$75,140
14
$79,261
41
$69,661
8
$25,124
1
$47,430
APPLICATIONS APPROVED, NOT ACCEPTED
0
$0
1
$41,320
15
$56,227
2
$17,375
0
$0
APPLICATIONS DENIED
0
$0
3
$23,167
31
$67,971
7
$20,997
2
$50,715
APPLICATIONS WITHDRAWN
0
$0
2
$74,195
14
$58,532
1
$26,300
1
$70,440
FILES CLOSED FOR INCOMPLETENESS
0
$0
1
$33,340
6
$52,595
0
$0
0
$0
Aggregated Statistics For Year 2001 (Based on 2 partial tracts)
A) FHA, FSA/RHS & VA Home Purchase Loans
B) Conventional Home Purchase Loans
C) Refinancings
D) Home Improvement Loans
F) Non-occupant Loans on < 5 Family Dwellings (A B C & D)
Number
Average Value
Number
Average Value
Number
Average Value
Number
Average Value
Number
Average Value
LOANS ORIGINATED
4
$41,560
14
$42,331
38
$58,008
9
$30,316
2
$37,100
APPLICATIONS APPROVED, NOT ACCEPTED
0
$0
3
$30,053
14
$49,543
2
$14,560
1
$46,020
APPLICATIONS DENIED
0
$0
6
$39,838
30
$56,227
13
$22,649
0
$0
APPLICATIONS WITHDRAWN
0
$0
1
$51,660
16
$52,243
2
$24,185
0
$0
FILES CLOSED FOR INCOMPLETENESS
0
$0
1
$54,470
3
$66,527
0
$0
0
$0
Aggregated Statistics For Year 2000 (Based on 2 partial tracts)
A) FHA, FSA/RHS & VA Home Purchase Loans
B) Conventional Home Purchase Loans
C) Refinancings
D) Home Improvement Loans
F) Non-occupant Loans on < 5 Family Dwellings (A B C & D)
Number
Average Value
Number
Average Value
Number
Average Value
Number
Average Value
Number
Average Value
LOANS ORIGINATED
6
$55,100
11
$61,305
23
$52,473
10
$20,287
4
$50,600
APPLICATIONS APPROVED, NOT ACCEPTED
0
$0
4
$41,560
8
$47,078
1
$12,210
3
$40,387
APPLICATIONS DENIED
0
$0
9
$36,211
23
$45,613
8
$17,786
1
$37,100
APPLICATIONS WITHDRAWN
0
$0
3
$33,653
18
$48,186
0
$0
2
$46,725
FILES CLOSED FOR INCOMPLETENESS
0
$0
0
$0
1
$97,210
0
$0
0
$0
Aggregated Statistics For Year 1999 (Based on 1 partial tract)
A) FHA, FSA/RHS & VA Home Purchase Loans
B) Conventional Home Purchase Loans
C) Refinancings
D) Home Improvement Loans
F) Non-occupant Loans on < 5 Family Dwellings (A B C & D)
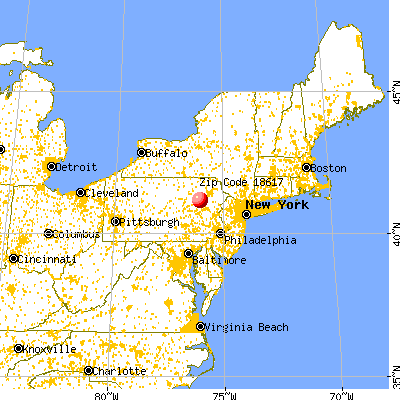


 Nearest zip codes: 18634, 18660, 18621, 18655, 18651, 18707.