Estimated zip code population in 2022: 30,931 Zip code population in 2010: 31,206 Zip code population in 2000: 32,747
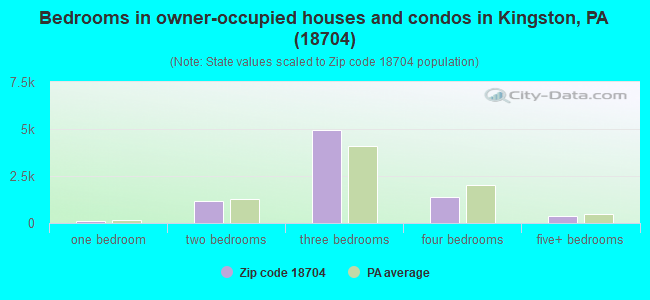
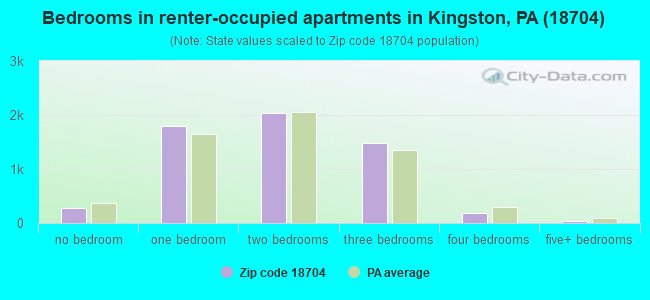
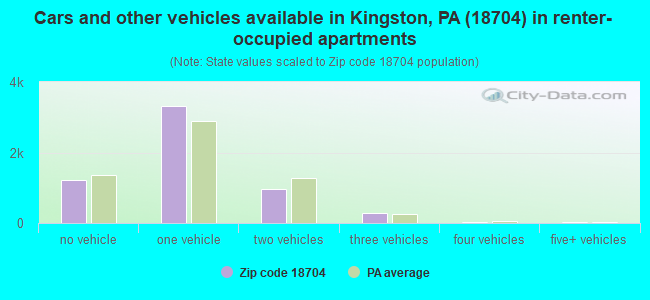
Houses and condos: 15,194 Renter-occupied apartments: 5,833
% of renters here:
42%
State:
31%
March 2022 cost of living index in zip code 18704: 93.5 (less than average, U.S. average is 100)
Land area: 10.0 sq. mi. Water area: 0.4 sq. mi.
Population density: 3,091 people per square mile
(average).
OSM Map
General Map
Google Map
MSN Map
OSM Map
General Map
Google Map
MSN Map
OSM Map
General Map
Google Map
MSN Map
OSM Map
General Map
Google Map
MSN Map
Please wait while loading the map...
Real estate property taxes paid for housing units in 2022:
This zip code:
1.5% ($2,437)
Pennsylvania:
1.3% ($3,094)
Median real estate property taxes paid for housing units with mortgages in 2022: $2,404 (1.5%) Median real estate property taxes paid for housing units with no mortgage in 2022: $2,476 (1.5%)
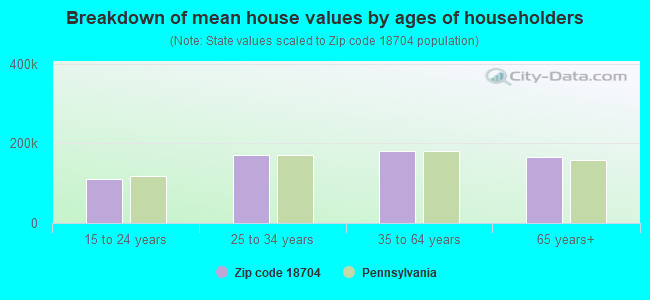
Estimated median house/condo value in 2022: $158,240
18704:
$158,240
Pennsylvania:
$245,500
According to our research of Pennsylvania and other state lists, there were 39 registered sex offenders living in 18704 zip code as of April 27, 2024. The ratio of all residents to sex offenders in zip code 18704 is 809 to 1. The ratio of registered sex offenders to all residents in this zip code is lower than the state average.
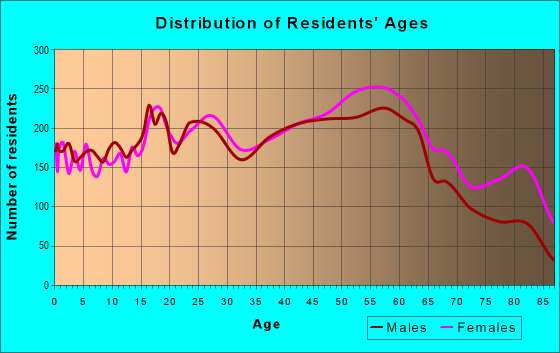
Median resident age:
This zip code:
41.6 years
Pennsylvania median age:
40.9 years
Average household size:
This zip code:
2.2 people
Pennsylvania:
2.4 people
Averages for the 2020 tax year for zip code 18704, filed in 2021:
Average Adjusted Gross Income (AGI) in 2020: $55,322 (Individual Income Tax Returns)
Here:
$55,322
State:
$75,707
Salary/wage: $45,256 (reported on 81.2% of returns)
Here:
$45,256
State:
$62,806
(% of AGI for various income ranges: 1001.3% for AGIs below $25k, 3352.7% for AGIs $25k-50k, 6063.6% for AGIs $50k-75k, 8944.2% for AGIs $75k-100k, 15863.5% for AGIs $100k-200k, 75338.8% for AGIs over 200k)
Taxable interest for individuals: $1,427 (reported on 24.0% of returns)
This zip code:
$1,427
Pennsylvania:
$1,633
(% of AGI for various income ranges: 13.1% for AGIs below $25k, 14.9% for AGIs $25k-50k, 46.1% for AGIs $50k-75k, 67.1% for AGIs $75k-100k, 125.4% for AGIs $100k-200k, 2048.8% for AGIs over 200k)
Ordinary dividends: $5,703 (reported on 18.2% of returns)
Here:
$5,703
State:
$7,382
(% of AGI for various income ranges: 24.5% for AGIs below $25k, 24.9% for AGIs $25k-50k, 87.0% for AGIs $50k-75k, 152.4% for AGIs $75k-100k, 401.1% for AGIs $100k-200k, 9477.5% for AGIs over 200k)
Net capital gain/loss in AGI: +$11,241 (reported on 13.7% of returns)
Here:
+$11,241
State:
+$23,522
(% of AGI for various income ranges: 2.5% for AGIs below $25k, 38.0% for AGIs $25k-50k, 68.2% for AGIs $50k-75k, 138.4% for AGIs $75k-100k, 496.6% for AGIs $100k-200k, 19522.5% for AGIs over 200k)
Profit/loss from business: +$13,311 (reported on 10.4% of returns)
Here:
+$13,311
State:
+$16,274
(% of AGI for various income ranges: 86.6% for AGIs below $25k, 78.6% for AGIs $25k-50k, 128.0% for AGIs $50k-75k, 179.7% for AGIs $75k-100k, 470.9% for AGIs $100k-200k, 8557.5% for AGIs over 200k)
Taxable individual retirement arrangement distribution: $19,267 (reported on 9.3% of returns)
18704:
$19,267
Pennsylvania:
$18,583
(% of AGI for various income ranges: 78.8% for AGIs below $25k, 77.2% for AGIs $25k-50k, 196.3% for AGIs $50k-75k, 298.5% for AGIs $75k-100k, 532.2% for AGIs $100k-200k, 13683.8% for AGIs over 200k)
Self-employed (Keogh) retirement plans: $17,425 (reported on 0.2% of returns)
18704:
$17,425
Pennsylvania:
$25,407
(% of AGI for various income ranges: 64.5% for AGIs $100k-200k)
Total itemized deductions: $34,480 (reported on 2.8% of returns)
Here:
$34,480
State:
$34,850
(% of AGI for various income ranges: 14.8% for AGIs below $25k, 43.5% for AGIs $25k-50k, 138.3% for AGIs $50k-75k, 184.0% for AGIs $75k-100k, 368.2% for AGIs $100k-200k, 6513.8% for AGIs over 200k)
Charity contributions: $9,543 (reported on 2.3% of returns)
Here:
$9,543
State:
$12,392
(% of AGI for various income ranges: 6.5% for AGIs $25k-50k, 14.2% for AGIs $50k-75k, 24.6% for AGIs $75k-100k, 59.8% for AGIs $100k-200k, 2661.2% for AGIs over 200k)
Taxes paid: $7,085 (reported on 2.8% of returns)
18704:
$7,085
State:
$8,200
(% of AGI for various income ranges: 2.6% for AGIs below $25k, 5.9% for AGIs $25k-50k, 27.5% for AGIs $50k-75k, 56.6% for AGIs $75k-100k, 104.1% for AGIs $100k-200k, 910.0% for AGIs over 200k)
Earned income credit: $2,140 (reported on 16.0% of returns)
Here:
$2,140
State:
$2,100
(% of AGI for various income ranges: 82.1% for AGIs below $25k, 58.7% for AGIs $25k-50k, 1.1% for AGIs $50k-75k)
Percentage of individuals using paid preparers for their 2020 taxes: 92.7%
Here:
93%
State:
92%
(% for various income ranges: 92.3% for AGIs below $25k, 93.8% for AGIs $25k-50k, 92.1% for AGIs $50k-75k, 93.5% for AGIs $75k-100k, 92.1% for AGIs $100k-200k, 90.3% for AGIs over 200k)
Averages for the 2012 tax year for zip code 18704, filed in 2013:
Average Adjusted Gross Income (AGI) in 2012: $46,129 (Individual Income Tax Returns)
Here:
$46,129
State:
$61,346
Salary/wage: $40,193 (reported on 82.6% of returns)
Here:
$40,193
State:
$51,902
(% of AGI for various income ranges: 72.2% for AGIs below $25k, 79.5% for AGIs $25k-50k, 77.3% for AGIs $50k-75k, 77.5% for AGIs $75k-100k, 74.5% for AGIs $100k-200k, 44.6% for AGIs over 200k)
Taxable interest for individuals: $1,309 (reported on 33.0% of returns)
This zip code:
$1,309
Pennsylvania:
$1,588
(% of AGI for various income ranges: 1.4% for AGIs below $25k, 0.7% for AGIs $25k-50k, 0.7% for AGIs $50k-75k, 0.7% for AGIs $75k-100k, 1.0% for AGIs $100k-200k, 1.5% for AGIs over 200k)
Ordinary dividends: $4,158 (reported on 23.2% of returns)
Here:
$4,158
State:
$5,827
(% of AGI for various income ranges: 1.8% for AGIs below $25k, 1.0% for AGIs $25k-50k, 1.3% for AGIs $50k-75k, 1.6% for AGIs $75k-100k, 2.0% for AGIs $100k-200k, 5.6% for AGIs over 200k)
Net capital gain/loss in AGI: +$4,500 (reported on 14.8% of returns)
Here:
+$4,500
State:
+$14,495
(% of AGI for various income ranges: 0.1% for AGIs $25k-50k, 0.3% for AGIs $50k-75k, 0.7% for AGIs $75k-100k, 1.5% for AGIs $100k-200k, 6.9% for AGIs over 200k)
Profit/loss from business: +$13,644 (reported on 9.7% of returns)
Here:
+$13,644
State:
+$16,268
(% of AGI for various income ranges: 5.2% for AGIs below $25k, 2.2% for AGIs $25k-50k, 1.5% for AGIs $50k-75k, 2.3% for AGIs $75k-100k, 3.1% for AGIs $100k-200k, 4.1% for AGIs over 200k)
Taxable individual retirement arrangement distribution: $12,191 (reported on 10.8% of returns)
18704:
$12,191
Pennsylvania:
$14,550
(% of AGI for various income ranges: 3.8% for AGIs below $25k, 2.6% for AGIs $25k-50k, 2.4% for AGIs $50k-75k, 2.7% for AGIs $75k-100k, 2.6% for AGIs $100k-200k, 3.6% for AGIs over 200k)
Self-employment retirement plans: $16,671 (reported on 0.4% of returns)
18704:
$16,671
Pennsylvania:
$20,922
Total itemized deductions: $18,783 (19% of AGI, reported on 20.3% of returns)
Here:
$18,783
State:
$23,538
Here:
18.5% of AGI
State:
18.4% of AGI
(% of AGI for various income ranges: 5.2% for AGIs below $25k, 6.1% for AGIs $25k-50k, 7.2% for AGIs $50k-75k, 9.1% for AGIs $75k-100k, 10.7% for AGIs $100k-200k, 10.8% for AGIs over 200k)
Charity contributions: $2,909 (reported on 16.2% of returns)
Here:
$2,909
State:
$4,025
(% of AGI for various income ranges: 0.3% for AGIs below $25k, 0.6% for AGIs $25k-50k, 0.7% for AGIs $50k-75k, 1.0% for AGIs $75k-100k, 1.4% for AGIs $100k-200k, 2.1% for AGIs over 200k)
Taxes paid: $7,465 (reported on 20.2% of returns)
18704:
$7,465
State:
$9,982
(% of AGI for various income ranges: 1.1% for AGIs below $25k, 1.7% for AGIs $25k-50k, 2.5% for AGIs $50k-75k, 3.4% for AGIs $75k-100k, 4.9% for AGIs $100k-200k, 5.6% for AGIs over 200k)
Earned income credit: $2,029 (reported on 16.3% of returns)
Here:
$2,029
State:
$2,106
(% of AGI for various income ranges: 5.1% for AGIs below $25k, 0.7% for AGIs $25k-50k)
Percentage of individuals using paid preparers for their 2012 taxes: 54.4%
Here:
54%
State:
53%
(% for various income ranges: 50.3% for AGIs below $25k, 50.9% for AGIs $25k-50k, 59.0% for AGIs $50k-75k, 62.8% for AGIs $75k-100k, 65.5% for AGIs $100k-200k, 87.5% for AGIs over 200k)
Averages for the 2004 tax year for zip code 18704, filed in 2005:
Average Adjusted Gross Income (AGI) in 2004: $38,341 (Individual Income Tax Returns)
Here:
$38,341
State:
$48,049
Salary/wage: $34,329 (reported on 82.9% of returns)
Here:
$34,329
State:
$42,646
(% of AGI for various income ranges: 100.7% for AGIs below $10k, 73.5% for AGIs $10k-25k, 82.6% for AGIs $25k-50k, 82.1% for AGIs $50k-75k, 81.9% for AGIs $75k-100k, 55.5% for AGIs over 100k)
Taxable interest for individuals: $1,642 (reported on 49.9% of returns)
This zip code:
$1,642
Pennsylvania:
$1,657
(% of AGI for various income ranges: 7.9% for AGIs below $10k, 3.0% for AGIs $10k-25k, 1.7% for AGIs $25k-50k, 1.5% for AGIs $50k-75k, 1.7% for AGIs $75k-100k, 2.4% for AGIs over 100k)
Taxable dividends: $3,187 (reported on 29.0% of returns)
Here:
$3,187
State:
$3,566
(% of AGI for various income ranges: 6.9% for AGIs below $10k, 2.2% for AGIs $10k-25k, 1.4% for AGIs $25k-50k, 1.3% for AGIs $50k-75k, 1.6% for AGIs $75k-100k, 4.3% for AGIs over 100k)
Net capital gain/loss: +$4,851 (reported on 20.2% of returns)
Here:
+$4,851
State:
+$9,716
(% of AGI for various income ranges: -4.0% for AGIs below $10k, 0.2% for AGIs $10k-25k, 0.4% for AGIs $25k-50k, 0.7% for AGIs $50k-75k, 0.9% for AGIs $75k-100k, 8.1% for AGIs over 100k)
Profit/loss from business: +$15,626 (reported on 9.7% of returns)
Here:
+$15,626
State:
+$14,267
(% of AGI for various income ranges: 5.2% for AGIs below $10k, 3.8% for AGIs $10k-25k, 1.8% for AGIs $25k-50k, 2.1% for AGIs $50k-75k, 2.9% for AGIs $75k-100k, 7.7% for AGIs over 100k)
IRA payment deduction: $2,636 (reported on 2.9% of returns)
18704:
$2,636
Pennsylvania:
$2,903
(% of AGI for various income ranges: 0.4% for AGIs below $10k, 0.3% for AGIs $10k-25k, 0.3% for AGIs $25k-50k, 0.2% for AGIs $50k-75k, 0.1% for AGIs $75k-100k, 0.1% for AGIs over 100k)
Self-employed pension: $14,559 (reported on 0.6% of returns)
Here:
$14,559
Pennsylvania:
$14,674
Total itemized deductions: $15,816 (19% of AGI, reported on 21.7% of returns)
Here:
$15,816
State:
$18,804
Here:
18.8% of AGI
State:
19.5% of AGI
(% of AGI for various income ranges: 7.1% for AGIs below $10k, 5.9% for AGIs $10k-25k, 7.1% for AGIs $25k-50k, 8.9% for AGIs $50k-75k, 11.0% for AGIs $75k-100k, 11.0% for AGIs over 100k)
Charity contributions deductions: $2,849 (3% of AGI, reported on 19.8% of returns)
Here:
$2,849
State:
$3,337
Here:
3.2% of AGI
State:
3.3% of AGI
(% of AGI for various income ranges: 0.4% for AGIs below $10k, 0.5% for AGIs $10k-25k, 0.8% for AGIs $25k-50k, 1.1% for AGIs $50k-75k, 1.5% for AGIs $75k-100k, 2.8% for AGIs over 100k)
Total tax: $5,887 (reported on 73.6% of returns)
18704:
$5,887
State:
$8,008
(% of AGI for various income ranges: 2.7% for AGIs below $10k, 4.5% for AGIs $10k-25k, 7.5% for AGIs $25k-50k, 9.5% for AGIs $50k-75k, 11.0% for AGIs $75k-100k, 19.6% for AGIs over 100k)
Earned income credit: $1,506 (reported on 12.5% of returns)
Here:
$1,506
State:
$1,643
Percentage of individuals using paid preparers for their 2004 taxes: 55.4%
Here:
55%
State:
56%
(% for various income ranges: 51.7% for AGIs below $10k, 53.7% for AGIs $10k-25k, 54.1% for AGIs $25k-50k, 57.5% for AGIs $50k-75k, 62.0% for AGIs $75k-100k, 73.2% for AGIs over 100k)
Likely homosexual households (counted as self-reported same-sex unmarried-partner households)
Lesbian couples: 0.0% of all households
Gay men: 0.0% of all households
Household received Food Stamps/SNAP in the past 12 months: 3,051 Household did not receive Food Stamps/SNAP in the past 12 months: 10,902
Women who had a birth in the past 12 months: 382 (259 now married, 119 unmarried) Women who did not have a birth in the past 12 months: 6,766 (2,190 now married, 4,592 unmarried)
Housing units in zip code 18704 with a mortgage: 4,458 (472 second mortgage, 31 home equity loan, 386 both second mortgage and home equity loan) Houses without a mortgage: 400
Median monthly owner costs for units with a mortgage: $1,169 Median monthly owner costs for units without a mortgage: $568
Residents with income below the poverty level in 2022:
This zip code:
16.3%
Whole state:
11.8%
Residents with income below 50% of the poverty level in 2022:
This zip code:
7.9%
Whole state:
6.1%
Median number of rooms in houses and condos:
Here:
6.7
State:
6.8
Median number of rooms in apartments:
Here:
4.4
State:
4.3
Notable locations in this zip code not listed on our city pages
Notable locations in zip code 18704: Harry E Breaker Station (A), Slocum Station (B), Harvey Junction Station (C), Harvey Junction (D), Maltby Station (E), Columbian Volunteer Fire Department (F), Independent Fire Company 1 (G), Columbia Hose Company 3 (H), Woodward Hill Hose Company 4 (I), Courtdale Volunteer Hose Company (J), Edwardsville Volunteer Firemens Community (K), Forty Fort Volunteer Fire Company (L), Pringle Volunteer Fire Department (M), Franklin Hose Company 2 (N), Swoyersville Volunteer Hose Company 2 (O), Swoyersville Volunteer Hose Company 1 (P), J Donald and Marion Munson Fieldhouse (Q), Larksville Volunteer Fire Company 1 (R), Kingston Firemens Community Ambulance (S), Maltby Volunteer Fire Company (T). Display/hide their locations on the map
2,830 married couples with children.
2,445 single-parent households (614 men, 1,831 women).
91.9% of residents of 18704 zip code speak English at home.
4.7% of residents speak Spanish at home (69% very well, 17% well, 10% not well, 5% not at all).
2.3% of residents speak other Indo-European language at home (78% very well, 19% well, 2% not well, 1% not at all).
0.3% of residents speak Asian or Pacific Island language at home (86% very well, 5% well, 9% not well).
0.7% of residents speak other language at home (80% very well, 20% well).
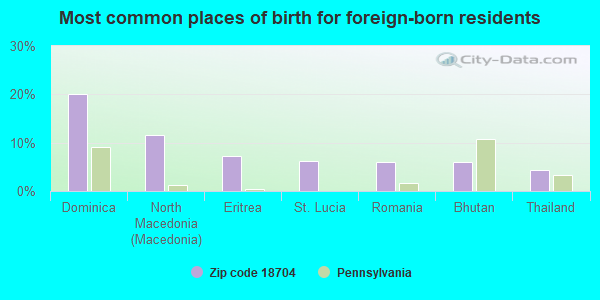
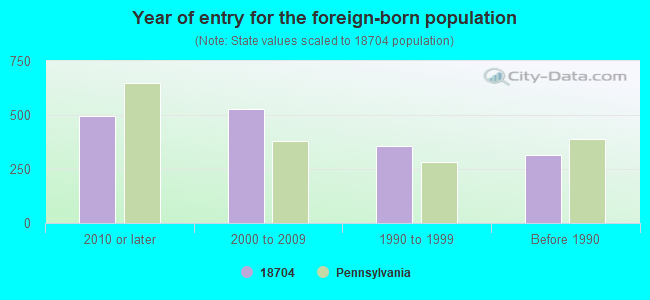
Foreign born population: 1,219 (3.9%) (54.3% of them are naturalized citizens)
Major facilities with environmental interests located in this zip code:
BISCONTINI DISTR CTR (232 DIVISION ST in KINGSTON, PA)
STATE MASTER (Pennsylvania database) - RCRIS-PAD007814957, HAZARDOUS WASTE PROGRAM, PCS-PAR802209, National Pollutant Discharge Elimination System Permit National Pollutant Discharge Elimination System NON-MAJOR (Tracking pollutant discharge elimination systems) - permit Small Quantity Generators, between 100 kg and 1000 kg of hazardous waste/month (Resource Conservation and Recovery Act (tracking hazardous waste)) - notification Business SIC classification: GENERAL WAREHOUSING AND STORAGE; SPECIAL WAREHOUSING AND STORAGE Organizations: OPERNAME (CONTACT/OPERATOR)
, BISCONTINI, RICHARD (CONTACT/OWNER)
, BISCONTINI DISTRIBUTION CENTERS (CONTACT/OWNER)
Alternative names: BISCONTINI DISTRIBUTION CENTER, BISCONTINI DISTRIBUTTION CENTR, BISCONTINI WHSE & DIST CO
AUTO PAINT (340 PIERCE ST in KINGSTON, PA)
STATE MASTER (Pennsylvania database) - RCRIS-PAD981940539, HAZARDOUS WASTE PROGRAM (Resource Conservation and Recovery Act (tracking hazardous waste)) Organizations: OPERNAME (CONTACT/OPERATOR)
AVALON CLEANERS (511 PIERCE ST in KINGSTON, PA)
AIR MINOR (AIRS/AFS) Small Quantity Generators, between 100 kg and 1000 kg of hazardous waste/month (Resource Conservation and Recovery Act (tracking hazardous waste)) - notification Business SIC classification: DRYCLEANING PLANTS, EXCEPT RUG CLEANING Organizations: OPERNAME (CONTACT/OPERATOR)
, O T A REALTY INC (CONTACT/OWNER)
Alternative names: AVALON CLNR / KINGSTON, AVALON CLNR SVC
ALPHA OMEGA ACADEMY (OWEN & MALTBY STREETS in KINGSTON, PA)
(Integrated Compliance Information System) - ICIS-03-1989-0866, FORMAL ENFORCEMENT ACTION COMPLIANCE ACTIVITY (Tracking inspections of insecticide, fungicide, and rodenticide, and toxic substances) Business SIC classification: ELEMENTARY AND SECONDARY SCHOOLS
AMOCO OIL COMPANY WILKES BARRE TERMINAL (70 SOUTH WYOMING AVENUE in KINGSTON, PA)
AIR MAJOR (AIRS/AFS) Small Quantity Generators, between 100 kg and 1000 kg of hazardous waste/month (Resource Conservation and Recovery Act (tracking hazardous waste)) - notification Business SIC classification: PETROLEUM BULK STATIONS AND TERMINALS Organizations: OPERNAME (CONTACT/OPERATOR)
Alternative names: ATLANTIC REF & MKTG
BELRICK METAL PRODUCTS CO (R 1109 MAIN ST in KINGSTON, PA)
(Resource Conservation and Recovery Act (tracking hazardous waste)) Business NAICS classification: SPECIAL DIE AND TOOL, DIE SET, JIG, AND FIXTURE MANUFACTURING. Organizations: OPERNAME (CONTACT/OPERATOR)
, OWNERNAME (CONTACT/OWNER)
ACME MARKETS INCORPORATED (180 WELLES STREET in FORTY FORT, PA)
Small Quantity Generators, between 100 kg and 1000 kg of hazardous waste/month (Resource Conservation and Recovery Act (tracking hazardous waste)) - notification Organizations: OPERNAME (CONTACT/OPERATOR)
AIRCO TECHWELD (NORTHAMPTON ST in KINGSTON, PA)
Small Quantity Generators, between 100 kg and 1000 kg of hazardous waste/month (Resource Conservation and Recovery Act (tracking hazardous waste)) - notification Organizations: OPERNAME (CONTACT/OPERATOR)
ATLANTIC SERVICE STATION (101 S WYOMING AVE in KINGSTON, PA)
Conditionally Exempt Small Quantity Generators, less than 100 kg/month of hazardous waste (Resource Conservation and Recovery Act (tracking hazardous waste)) - notification Organizations: OPERNAME (CONTACT/OPERATOR)
, ATLANTIC REFINING & MARKETING (CONTACT/OWNER)
ATLANTIC SERVICE STATION (937 WYOMING AVE in FORTY FORT, PA)
Conditionally Exempt Small Quantity Generators, less than 100 kg/month of hazardous waste (Resource Conservation and Recovery Act (tracking hazardous waste)) - notification Organizations: OPERNAME (CONTACT/OPERATOR)
, ATLANTIC REFINING & MARKETING (CONTACT/OWNER)
B E S ENVIRONMENTAL SPECIALISTS (225 WYOMING AVE in KINGSTON, PA)
TRANSPORTER (Resource Conservation and Recovery Act (tracking hazardous waste)) Organizations: OPERNAME (CONTACT/OPERATOR)
, BARNOWSKI, MARTHA F (CONTACT/OWNER)
APPLE ST WELDING & METAL WORK (19 APPLE ST in LARKSVILLE, PA)
Conditionally Exempt Small Quantity Generators, less than 100 kg/month of hazardous waste (Resource Conservation and Recovery Act (tracking hazardous waste)) - notification Organizations: PREBY JR RAYMOND J (CONTACT/OWNER)
B & B AUTO (305 MAIN ST in SWOYERSVILLE, PA)
Conditionally Exempt Small Quantity Generators, less than 100 kg/month of hazardous waste (Resource Conservation and Recovery Act (tracking hazardous waste)) - notification Organizations: FRANK BRENNAN (CONTACT/OWNER)
Housing units lacking complete plumbing facilities: 2.3% Housing units lacking complete kitchen facilities: 1.3%
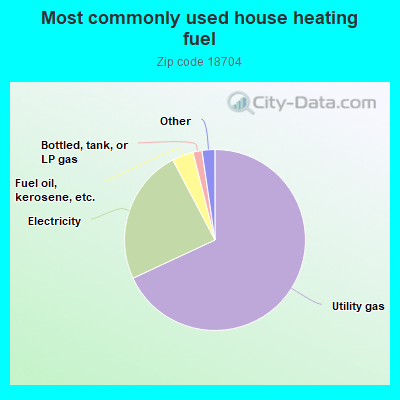
68.0%Utility gas
24.2%Electricity
3.8%Fuel oil, kerosene, etc.
1.6%Bottled, tank, or LP gas
1.0%No fuel used
0.7%Other fuel
0.5%Wood
Population in 1990: 33,661.
Place of birth for U.S.-born residents:
This state: 23,697
Northeast: 3,288
Midwest: 504
South: 966
West: 683
70% of the 18704 zip code residents lived in the same house 5 years ago. Out of people who lived in different houses, 79% lived in this county. Out of people who lived in different counties, 50% lived in Pennsylvania.
89% of the 18704 zip code residents lived in the same house 1 year ago. Out of people who lived in different houses, 66% moved from this county. Out of people who lived in different houses, 15% moved from different county within same state. Out of people who lived in different houses, 12% moved from different state. Out of people who lived in different houses, 5% moved from abroad.
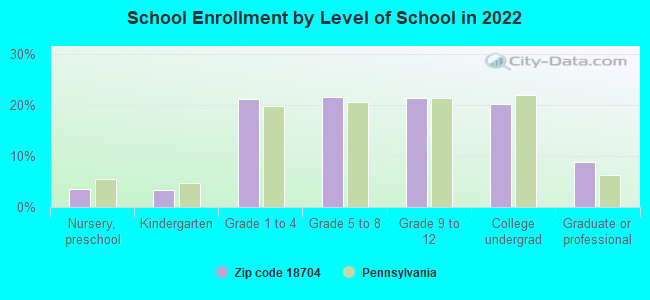
Private vs. public school enrollment:
Students in private schools in grades 1 to 8 (elementary and middle school): 453
Here:
17.8%
Pennsylvania:
15.7%
Students in private schools in grades 9 to 12 (high school): 251
Here:
19.7%
Pennsylvania:
13.4%
Students in private undergraduate colleges: 493
Here:
40.8%
Pennsylvania:
39.8%
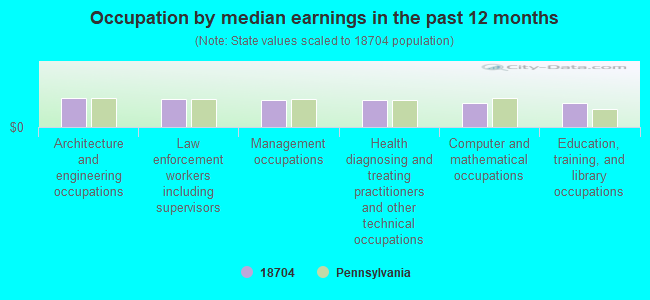
Occupation by median earnings in the past 12 months ($)
75,160Architecture and engineering occupations
72,528Law enforcement workers including supervisors
69,460Management occupations
68,923Health diagnosing and treating practitioners and other technical occupations
62,678Computer and mathematical occupations
61,764Education, training, and library occupations
Companies with biggest federal contracts located in this zip code:
RALMARK COMPANY (83 EAST LUZERNE AVENUE in LARKSVILLE, PA; small business) : $424,259 in 31 contractsfrom 2000 to 2006
Contracts for Gears, Pulleys, Sprockets, and Transmission Chain, Invalid code: 1640 by Defense Logistics Agency Signed by year:2000: $91,564; 2001: $0; 2002: $0; 2003: $0; 2004: $80,310; 2005: $178,609; 2006: $73,776.
Biggest contracts:
$62,398 with Defense Logistics Agency for Gears, Pulleys, Sprockets, and Transmission Chain. Signed on 2000-09-08. Completion date: 2000-12-27.
$37,470 with Defense Logistics Agency for Invalid code: 1640. Signed on 2004-05-03. Completion date: 2004-08-01.
$35,856, same as above.Signed on 2004-01-21. Completion date: 2004-04-20.
$31,012, same as above.Signed on 2006-04-19. Completion date: 2006-07-18.
CREATIVE BUSINESS INTERIORS (210 DIVISION STREET in KINGSTON, PA; small business) : $410,120 in 20 contractsfrom 2000 to 2006
Contracts for Miscellaneous Materials Handling Equipment, Maintenance, Repair and Rebuilding of Equipment -- Automatic Data Processing Equipment (Including Firmware), Software, Supplies and Support Equipment, Maintenance, Repair and Rebuilding of Equipment -- Miscellaneous, Maintenance, Repair or Alteration of Real Property -- Other Non-Building Facilities, and moreby Army Signed by year:2000: $285,823; 2001: $0; 2002: $0; 2003: $15,029; 2004: $28,040; 2005: $40,308; 2006: $40,920.
Biggest contracts:
$193,638 with Army for Miscellaneous Materials Handling Equipment. Taking place in OH. Signed on 2000-05-24. Completion date: 2000-07-10.
$92,185 with Army for Maintenance, Repair and Rebuilding of Equipment -- Automatic Data Processing Equipment (Including Firmware), Software, Supplies and Support Equipment. Taking place in OH. Signed on 2000-05-25. Completion date: 2000-06-30.
$40,525 with Army for Maintenance, Repair and Rebuilding of Equipment -- Miscellaneous. Signed on 2006-05-08. Completion date: 2007-05-08.
$10,340 with Army for Maintenance, Repair or Alteration of Real Property -- Other Non-Building Facilities. Signed on 2005-05-23. Completion date: 2005-12-31.
TED THORSEN L L C (131 WELLES STREET in FORTY FORT, PA; small business) : $179,190 in 11 contractsfrom 2002 to 2006
Contracts for Miscellaneous Electric Power and Distribution Equipment, Maintenance, Repair and Rebuilding of Equipment -- Materials Handling Equipment, Material Handling Equipment, Nonself-Propelled, Office Supplies, and moreby Air Force, SOCIAL SECURITY ADMINISTRATION, Army, Internal Revenue Service, and others Signed by year:2000: $0; 2001: $0; 2002: $32,000; 2003: $52,041; 2004: $65,656; 2005: $10,198; 2006: $19,295.
Biggest contracts:
$39,386 with Air Force for Miscellaneous Electric Power and Distribution Equipment. Signed on 2004-09-24. Completion date: 2004-10-30.
$32,000 with SOCIAL SECURITY ADMINISTRATION for Maintenance, Repair and Rebuilding of Equipment -- Materials Handling Equipment. Signed on 2002-08-15. Completion date: 2002-08-15.
$23,260 with SOCIAL SECURITY ADMINISTRATION for Material Handling Equipment, Nonself-Propelled. Signed on 2003-08-15. Completion date: 2003-10-15.
$21,600 with Army for Material Handling Equipment, Nonself-Propelled. Signed on 2003-12-17. Completion date: 2003-12-30.
PHASOR CORP (239 SCHUYLER AVE in KINGSTON, PA; small business) : $111,425 in 4 contractsfrom 2005 to 2006
$43,400 with Army for Maintenance, Repair and Rebuilding of Equipment -- Miscellaneous. Signed on 2005-03-31. Completion date: 2005-05-06.
$32,760 with Army for Maintenance, Repair and Rebuilding of Equipment -- Electrical and Electronic Equipment Components. Signed on 2005-06-17. Completion date: 2005-07-29.
$29,735 with Army for Maintenance, Repair or Alteration of Real Property -- Maintenance Buildings. Signed on 2005-11-28. Completion date: 2006-01-31.
$5,530 with Army for Maintenance, Repair and Rebuilding of Equipment -- Weapons. Signed on 2006-01-10. Completion date: 2006-02-10.
HOLENA CONSTRUCTION (20 E BENNETT STREET in KINGSTON, PA; small business) : $50,250 in 2 contractsfrom 2000 to 2003
$80,324 with Army for Maintenance, Repair or Alteration of Real Property -- Maintenance Buildings. Signed on 2000-11-01. Completion date: 2001-03-30.
-$30,074, same as above.Signed on 2003-08-19. Completion date: 2003-08-19.
VALLY INDUSTRIES,INC (247 RIVER STREET in FORTY FORT, PA; small business)
$42,500 with Army for Maintenance, Repair or Alteration of Real Property -- Miscellaneous Buildings. Signed on 2003-02-13. Completion date: 2003-03-15.
GARRETY GUTTERS (128 W VAUGHN ST in KINGSTON, PA; small business) : $42,335 in 5 contractsfrom 2002 to 2005
Contracts for Maintenance, Repair or Alteration of Real Property -- Unimproved Real Property (Land), Maintenance, Repair or Alteration of Real Property -- Maintenance Buildings by Army Signed by year:2000: $0; 2001: $0; 2002: $7,645; 2003: $23,940; 2004: $0; 2005: $10,750; 2006: $0.
Biggest contracts:
$16,599 with Army for Maintenance, Repair or Alteration of Real Property -- Unimproved Real Property (Land). Signed on 2003-09-26. Completion date: 2003-10-27.
$10,750 with Army for Maintenance, Repair or Alteration of Real Property -- Maintenance Buildings. Signed on 2005-02-11. Completion date: 2005-04-15.
$7,645, same as above.Signed on 2002-12-18. Completion date: 2003-04-30.
$5,821, same as above.Signed on 2003-04-03. Completion date: 2003-04-30.
JANE EVANCHIK (195 DIVISION ST in KINGSTON, PA; small business) : $25,080 in 4 contractsfrom 2004 to 2005
$8,640 with Army for Custodial Janitorial Services. Signed on 2005-12-05. Completion date: 2005-09-30.
$8,280, same as above.Signed on 2004-10-26. Completion date: 2005-09-30.
$4,080 with U.S. Army Corps of Engineers - civil program financing only for Custodial Janitorial Services. Signed on 2004-12-22. Completion date: 2005-09-30.
$4,080 with Army for Custodial Janitorial Services. Signed on 2004-12-22. Completion date: 2005-09-30.
CHARLIE S SERVICES, INC.ANY IN (311-313 HUGHES STREET in SWOYERSVILLE, PA; small business)
$25,000 with Army for Construction of Structures and Facilities -- Other Administrative Facilities and Service Buildings. Signed on 1999-12-06. Completion date: 2000-12-14.
DESIGNER ACOUSTICS INC (74 DILLEY ST in KINGSTON, PA; small business)
$21,427 with Army for Maintenance, Repair and Rebuilding of Equipment -- Miscellaneous. Signed on 2003-09-29. Completion date: 2003-10-10.
Top industries in this zip code by the number of employees in 2005:
Health Care and Social Assistance: Offices of Physicians (except Mental Health Specialists) (100-249 employees: 1 establishment, 20-49 employees: 8 establishments, 10-19 employees: 9 establishments, 5-9 employees: 20 establishments, 1-4 employees: 32 establishments)
Health Care and Social Assistance: Home Health Care Services (100-249: 1, 50-99: 4, 20-49: 5, 10-19: 2)
Management of Companies and Enterprises: Corporate, Subsidiary, and Regional Managing Offices (250-499: 1, 100-249: 1, 50-99: 1, 10-19: 1, 5-9: 1, 1-4: 1)
2004 - 2018 National Fire Incident Reporting System (NFIRS) incidents
According to the data from the years 2004 - 2018 the average number of fire incidents per year is 97. The highest number of reported fire incidents - 225 took place in 2015, and the least - 0 in 2007. The data has an increasing trend.
When looking into fire subcategories, the most incidents belonged to: Structure Fires (75.5%), and Outside Fires (16.8%).
Fire incident types reported to NFIRS in Zip Code 18704
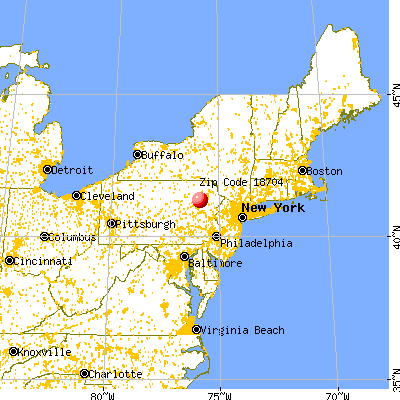


 Nearest zip codes: 18709, 18701, 18651, 18708, 18706, 18705.


 According to the data from the years 2004 - 2018 the average number of fire incidents per year is 97. The highest number of reported fire incidents - 225 took place in 2015, and the least - 0 in 2007. The data has an increasing trend.
 When looking into fire subcategories, the most incidents belonged to: Structure Fires (75.5%), and Outside Fires (16.8%).