Estimated zip code population in 2022: 15,366 Zip code population in 2010: 14,806 Zip code population in 2000: 15,485
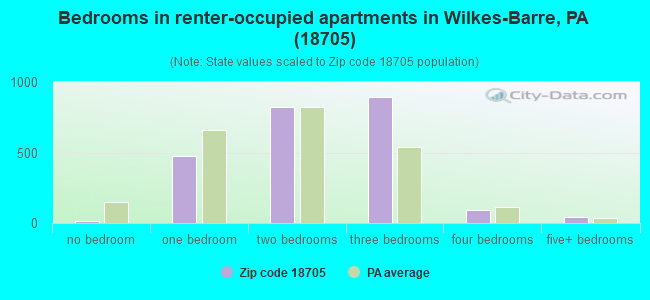
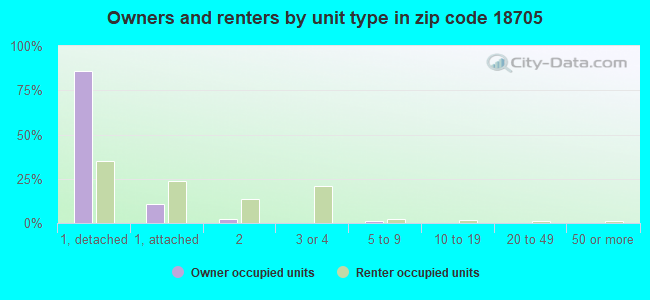
Houses and condos: 7,536 Renter-occupied apartments: 2,369
% of renters here:
36%
State:
31%
March 2022 cost of living index in zip code 18705: 93.1 (less than average, U.S. average is 100)
Land area: 5.5 sq. mi. Water area: 0.1 sq. mi.
Population density: 2,815 people per square mile
(average).
OSM Map
General Map
Google Map
MSN Map
OSM Map
General Map
Google Map
MSN Map
OSM Map
General Map
Google Map
MSN Map
OSM Map
General Map
Google Map
MSN Map
Please wait while loading the map...
Real estate property taxes paid for housing units in 2022:
This zip code:
1.7% ($2,143)
Pennsylvania:
1.3% ($3,094)
Median real estate property taxes paid for housing units with mortgages in 2022: $2,289 (1.6%) Median real estate property taxes paid for housing units with no mortgage in 2022: $2,023 (1.8%)
Estimated median house/condo value in 2022: $124,704
18705:
$124,704
Pennsylvania:
$245,500
According to our research of Pennsylvania and other state lists, there were 3 registered sex offenders living in 18705 zip code as of April 26, 2024. The ratio of all residents to sex offenders in zip code 18705 is 4,934 to 1. The ratio of registered sex offenders to all residents in this zip code is much lower than the state average.
Median resident age:
This zip code:
38.9 years
Pennsylvania median age:
40.9 years
Average household size:
This zip code:
2.3 people
Pennsylvania:
2.4 people
Averages for the 2020 tax year for zip code 18705, filed in 2021:
Average Adjusted Gross Income (AGI) in 2020: $47,509 (Individual Income Tax Returns)
Here:
$47,509
State:
$75,707
Salary/wage: $40,860 (reported on 80.2% of returns)
Here:
$40,860
State:
$62,806
(% of AGI for various income ranges: 1031.9% for AGIs below $25k, 3285.6% for AGIs $25k-50k, 5755.1% for AGIs $50k-75k, 8469.6% for AGIs $75k-100k, 14366.1% for AGIs $100k-200k, 56566.7% for AGIs over 200k)
Taxable interest for individuals: $1,204 (reported on 24.2% of returns)
This zip code:
$1,204
Pennsylvania:
$1,633
(% of AGI for various income ranges: 17.3% for AGIs below $25k, 18.9% for AGIs $25k-50k, 59.7% for AGIs $50k-75k, 68.0% for AGIs $75k-100k, 105.7% for AGIs $100k-200k, 846.7% for AGIs over 200k)
Ordinary dividends: $3,315 (reported on 16.4% of returns)
Here:
$3,315
State:
$7,382
(% of AGI for various income ranges: 19.8% for AGIs below $25k, 29.0% for AGIs $25k-50k, 67.5% for AGIs $50k-75k, 131.3% for AGIs $75k-100k, 268.9% for AGIs $100k-200k, 2966.7% for AGIs over 200k)
Net capital gain/loss in AGI: +$9,333 (reported on 11.2% of returns)
Here:
+$9,333
State:
+$23,522
(% of AGI for various income ranges: 3.0% for AGIs below $25k, 23.9% for AGIs $25k-50k, 60.0% for AGIs $50k-75k, 95.3% for AGIs $75k-100k, 381.3% for AGIs $100k-200k, 16820.0% for AGIs over 200k)
Profit/loss from business: +$9,682 (reported on 9.2% of returns)
Here:
+$9,682
State:
+$16,274
(% of AGI for various income ranges: 45.5% for AGIs below $25k, 71.4% for AGIs $25k-50k, 74.5% for AGIs $50k-75k, 93.3% for AGIs $75k-100k, 427.6% for AGIs $100k-200k, 5446.7% for AGIs over 200k)
Taxable individual retirement arrangement distribution: $11,939 (reported on 10.0% of returns)
18705:
$11,939
Pennsylvania:
$18,583
(% of AGI for various income ranges: 67.6% for AGIs below $25k, 70.2% for AGIs $25k-50k, 173.3% for AGIs $50k-75k, 418.9% for AGIs $75k-100k, 695.0% for AGIs $100k-200k)
Total itemized deductions: $28,725 (reported on 2.0% of returns)
Here:
$28,725
State:
$34,850
(% of AGI for various income ranges: 35.5% for AGIs $25k-50k, 100.2% for AGIs $50k-75k, 121.1% for AGIs $75k-100k, 532.4% for AGIs $100k-200k)
Charity contributions: $4,773 (reported on 1.4% of returns)
Here:
$4,773
State:
$12,392
(% of AGI for various income ranges: 1.6% for AGIs below $25k, 9.4% for AGIs $50k-75k, 25.3% for AGIs $75k-100k, 63.9% for AGIs $100k-200k)
Taxes paid: $6,320 (reported on 1.9% of returns)
18705:
$6,320
State:
$8,200
(% of AGI for various income ranges: 7.4% for AGIs $25k-50k, 17.0% for AGIs $50k-75k, 43.3% for AGIs $75k-100k, 98.5% for AGIs $100k-200k)
Earned income credit: $2,117 (reported on 18.3% of returns)
Here:
$2,117
State:
$2,100
(% of AGI for various income ranges: 86.3% for AGIs below $25k, 63.2% for AGIs $25k-50k)
Percentage of individuals using paid preparers for their 2020 taxes: 92.4%
Here:
92%
State:
92%
(% for various income ranges: 91.0% for AGIs below $25k, 94.3% for AGIs $25k-50k, 93.0% for AGIs $50k-75k, 90.5% for AGIs $75k-100k, 91.7% for AGIs $100k-200k, 100.0% for AGIs over 200k)
Averages for the 2012 tax year for zip code 18705, filed in 2013:
Average Adjusted Gross Income (AGI) in 2012: $41,238 (Individual Income Tax Returns)
Here:
$41,238
State:
$61,346
Salary/wage: $36,977 (reported on 81.9% of returns)
Here:
$36,977
State:
$51,902
(% of AGI for various income ranges: 70.9% for AGIs below $25k, 80.0% for AGIs $25k-50k, 76.5% for AGIs $50k-75k, 75.7% for AGIs $75k-100k, 72.5% for AGIs $100k-200k, 49.5% for AGIs over 200k)
Taxable interest for individuals: $1,033 (reported on 33.2% of returns)
This zip code:
$1,033
Pennsylvania:
$1,588
(% of AGI for various income ranges: 1.4% for AGIs below $25k, 0.8% for AGIs $25k-50k, 0.7% for AGIs $50k-75k, 0.6% for AGIs $75k-100k, 0.8% for AGIs $100k-200k, 0.7% for AGIs over 200k)
Ordinary dividends: $2,303 (reported on 20.7% of returns)
Here:
$2,303
State:
$5,827
(% of AGI for various income ranges: 1.2% for AGIs below $25k, 0.8% for AGIs $25k-50k, 1.0% for AGIs $50k-75k, 1.2% for AGIs $75k-100k, 1.4% for AGIs $100k-200k, 1.9% for AGIs over 200k)
Net capital gain/loss in AGI: +$2,209 (reported on 10.7% of returns)
Here:
+$2,209
State:
+$14,495
(% of AGI for various income ranges: 0.3% for AGIs $25k-50k, 0.5% for AGIs $50k-75k, 0.8% for AGIs $75k-100k, 1.1% for AGIs $100k-200k, 1.3% for AGIs over 200k)
Profit/loss from business: +$12,351 (reported on 8.0% of returns)
Here:
+$12,351
State:
+$16,268
(% of AGI for various income ranges: 3.7% for AGIs below $25k, 1.3% for AGIs $25k-50k, 1.6% for AGIs $50k-75k, 1.3% for AGIs $75k-100k, 5.6% for AGIs $100k-200k)
Taxable individual retirement arrangement distribution: $9,180 (reported on 10.4% of returns)
18705:
$9,180
Pennsylvania:
$14,550
(% of AGI for various income ranges: 3.6% for AGIs below $25k, 1.8% for AGIs $25k-50k, 2.3% for AGIs $50k-75k, 2.4% for AGIs $75k-100k, 3.1% for AGIs $100k-200k)
Total itemized deductions: $16,360 (19% of AGI, reported on 16.2% of returns)
Here:
$16,360
State:
$23,538
Here:
18.5% of AGI
State:
18.4% of AGI
(% of AGI for various income ranges: 3.4% for AGIs below $25k, 4.7% for AGIs $25k-50k, 6.3% for AGIs $50k-75k, 7.4% for AGIs $75k-100k, 9.1% for AGIs $100k-200k, 8.5% for AGIs over 200k)
Charity contributions: $2,032 (reported on 12.4% of returns)
Here:
$2,032
State:
$4,025
(% of AGI for various income ranges: 0.2% for AGIs below $25k, 0.3% for AGIs $25k-50k, 0.6% for AGIs $50k-75k, 0.7% for AGIs $75k-100k, 1.0% for AGIs $100k-200k, 1.2% for AGIs over 200k)
Taxes paid: $6,958 (reported on 16.2% of returns)
18705:
$6,958
State:
$9,982
(% of AGI for various income ranges: 0.9% for AGIs below $25k, 1.4% for AGIs $25k-50k, 2.5% for AGIs $50k-75k, 3.0% for AGIs $75k-100k, 4.6% for AGIs $100k-200k, 5.2% for AGIs over 200k)
Earned income credit: $2,064 (reported on 17.7% of returns)
Here:
$2,064
State:
$2,106
(% of AGI for various income ranges: 5.2% for AGIs below $25k, 0.8% for AGIs $25k-50k)
Percentage of individuals using paid preparers for their 2012 taxes: 53.3%
Here:
53%
State:
53%
(% for various income ranges: 50.6% for AGIs below $25k, 52.4% for AGIs $25k-50k, 56.2% for AGIs $50k-75k, 58.9% for AGIs $75k-100k, 60.4% for AGIs $100k-200k, 83.3% for AGIs over 200k)
Averages for the 2004 tax year for zip code 18705, filed in 2005:
Average Adjusted Gross Income (AGI) in 2004: $34,431 (Individual Income Tax Returns)
Here:
$34,431
State:
$48,049
Salary/wage: $32,318 (reported on 83.5% of returns)
Here:
$32,318
State:
$42,646
(% of AGI for various income ranges: 73.7% for AGIs below $10k, 73.8% for AGIs $10k-25k, 81.7% for AGIs $25k-50k, 82.1% for AGIs $50k-75k, 83.1% for AGIs $75k-100k, 68.3% for AGIs over 100k)
Taxable interest for individuals: $1,399 (reported on 51.1% of returns)
This zip code:
$1,399
Pennsylvania:
$1,657
(% of AGI for various income ranges: 5.7% for AGIs below $10k, 3.1% for AGIs $10k-25k, 1.6% for AGIs $25k-50k, 1.6% for AGIs $50k-75k, 1.7% for AGIs $75k-100k, 2.4% for AGIs over 100k)
Taxable dividends: $1,408 (reported on 26.5% of returns)
Here:
$1,408
State:
$3,566
(% of AGI for various income ranges: 2.7% for AGIs below $10k, 1.5% for AGIs $10k-25k, 0.9% for AGIs $25k-50k, 0.8% for AGIs $50k-75k, 0.7% for AGIs $75k-100k, 1.4% for AGIs over 100k)
Net capital gain/loss: +$1,508 (reported on 15.7% of returns)
Here:
+$1,508
State:
+$9,716
(% of AGI for various income ranges: -2.6% for AGIs below $10k, -0.1% for AGIs $10k-25k, -0.2% for AGIs $25k-50k, 0.6% for AGIs $50k-75k, 1.0% for AGIs $75k-100k, 3.2% for AGIs over 100k)
Profit/loss from business: +$14,173 (reported on 8.2% of returns)
Here:
+$14,173
State:
+$14,267
(% of AGI for various income ranges: 5.8% for AGIs below $10k, 2.7% for AGIs $10k-25k, 2.0% for AGIs $25k-50k, 1.8% for AGIs $50k-75k, 1.5% for AGIs $75k-100k, 9.4% for AGIs over 100k)
IRA payment deduction: $2,783 (reported on 2.9% of returns)
18705:
$2,783
Pennsylvania:
$2,903
(% of AGI for various income ranges: 0.3% for AGIs $10k-25k, 0.3% for AGIs $25k-50k, 0.2% for AGIs $50k-75k, 0.1% for AGIs $75k-100k, 0.2% for AGIs over 100k)
Self-employed pension: $16,350 (reported on 0.3% of returns)
Here:
$16,350
Pennsylvania:
$14,674
Total itemized deductions: $13,736 (19% of AGI, reported on 17.5% of returns)
Here:
$13,736
State:
$18,804
Here:
19.1% of AGI
State:
19.5% of AGI
(% of AGI for various income ranges: 4.0% for AGIs below $10k, 3.6% for AGIs $10k-25k, 5.8% for AGIs $25k-50k, 7.5% for AGIs $50k-75k, 9.2% for AGIs $75k-100k, 9.8% for AGIs over 100k)
Charity contributions deductions: $1,705 (2% of AGI, reported on 15.9% of returns)
Here:
$1,705
State:
$3,337
Here:
2.3% of AGI
State:
3.3% of AGI
(% of AGI for various income ranges: 0.2% for AGIs below $10k, 0.4% for AGIs $10k-25k, 0.5% for AGIs $25k-50k, 0.8% for AGIs $50k-75k, 1.0% for AGIs $75k-100k, 1.5% for AGIs over 100k)
Total tax: $4,553 (reported on 73.4% of returns)
18705:
$4,553
State:
$8,008
(% of AGI for various income ranges: 1.9% for AGIs below $10k, 4.1% for AGIs $10k-25k, 7.5% for AGIs $25k-50k, 9.3% for AGIs $50k-75k, 11.2% for AGIs $75k-100k, 18.7% for AGIs over 100k)
Earned income credit: $1,574 (reported on 13.9% of returns)
Here:
$1,574
State:
$1,643
Percentage of individuals using paid preparers for their 2004 taxes: 54.4%
Here:
54%
State:
56%
(% for various income ranges: 48.3% for AGIs below $10k, 53.8% for AGIs $10k-25k, 54.5% for AGIs $25k-50k, 60.9% for AGIs $50k-75k, 57.7% for AGIs $75k-100k, 64.9% for AGIs over 100k)
Likely homosexual households (counted as self-reported same-sex unmarried-partner households)
Lesbian couples: 0.1% of all households
Gay men: 0.1% of all households
Household received Food Stamps/SNAP in the past 12 months: 1,236 Household did not receive Food Stamps/SNAP in the past 12 months: 5,352
Women who had a birth in the past 12 months: 281 (150 now married, 120 unmarried) Women who did not have a birth in the past 12 months: 3,037 (1,184 now married, 1,853 unmarried)
Housing units in zip code 18705 with a mortgage: 1,956 (125 second mortgage, 7 home equity loan, 95 both second mortgage and home equity loan) Houses without a mortgage: 63
Median monthly owner costs for units with a mortgage: $1,178 Median monthly owner costs for units without a mortgage: $492
Residents with income below the poverty level in 2022:
This zip code:
16.8%
Whole state:
11.8%
Residents with income below 50% of the poverty level in 2022:
This zip code:
11.4%
Whole state:
6.1%
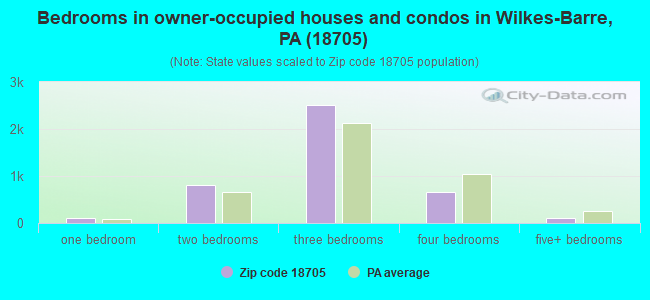
Median number of rooms in houses and condos:
Here:
6.2
State:
6.8
Median number of rooms in apartments:
Here:
5.5
State:
4.3
Notable locations in this zip code not listed on our city pages
Notable locations in zip code 18705: Port Bowkley Station (A), Parsons Station (B), Plains Township Fire Department (C), Wilkes - Barre Fire Department Hollenback Station (D). Display/hide their locations on the map
1,584 married couples with children.
1,148 single-parent households (319 men, 829 women).
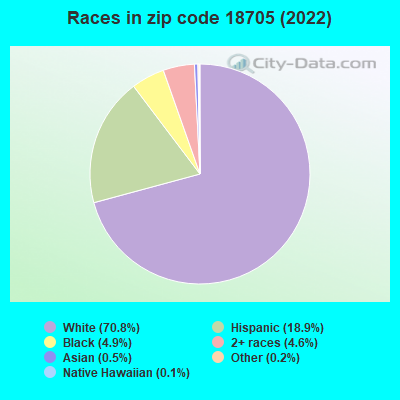
81.3% of residents of 18705 zip code speak English at home.
14.0% of residents speak Spanish at home (56% very well, 19% well, 17% not well, 7% not at all).
3.6% of residents speak other Indo-European language at home (78% very well, 6% well, 14% not well, 2% not at all).
0.8% of residents speak Asian or Pacific Island language at home (61% very well, 22% well, 17% not well).
0.7% of residents speak other language at home (100% very well).
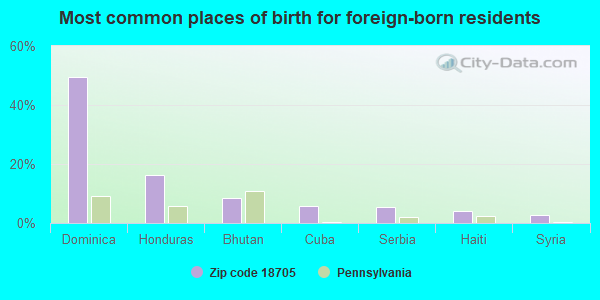
Foreign born population: 1,600 (10.4%) (39.7% of them are naturalized citizens)
This zip code:
10.4%
Whole state:
7.5%
49%Dominica
16%Honduras
9%Bhutan
6%Cuba
5%Serbia
4%Haiti
3%Syria
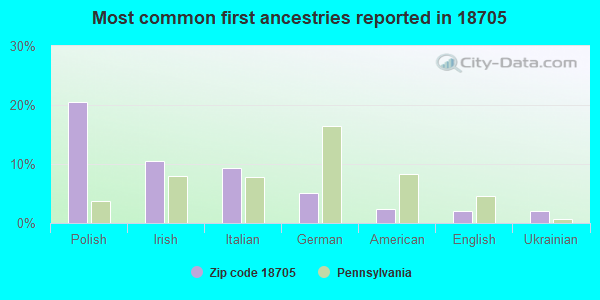
20%Polish
11%Irish
9%Italian
5%German
2%American
2%English
2%Ukrainian
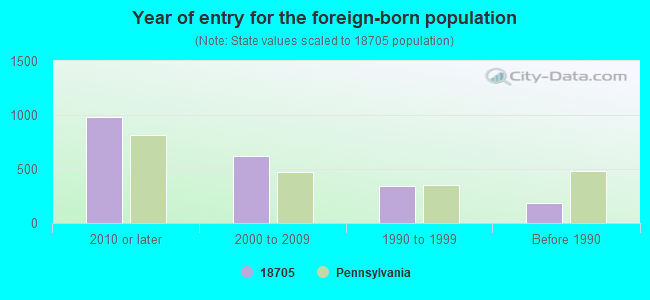
Year of entry for the foreign-born population
9802010 or later
6212000 to 2009
3381990 to 1999
181Before 1990
Facilities with environmental interests located in this zip code:
ALTEC IND (250 LAIRD STREET in PLAINS, PA)
AIR MINOR (AIRS/AFS) STATE MASTER (Pennsylvania database) - PCS-PAR802206, National Pollutant Discharge Elimination System Permit, AFS-63-0362926-1, AIR PROGRAM, RCRIS-PAD146743216, HAZARDOUS WASTE PROGRAM National Pollutant Discharge Elimination System NON-MAJOR (Tracking pollutant discharge elimination systems) - permit HAZARDOUS WASTE BIENNIAL REPORTER (Resource Conservation and Recovery Act (tracking hazardous waste)) Small Quantity Generators, between 100 kg and 1000 kg of hazardous waste/month (Resource Conservation and Recovery Act (tracking hazardous waste)) TRI REPORTER (Tracking of toxic chemicals releasing facilities) Business SIC classification: TRUCK AND BUS BODIES Business NAICS classification: MOTOR VEHICLE BODY MANUFACTURING. Organizations: ALTEC INDUSTRIES, INC. (CONTACT/GENERAL)
, OPERNAME (CONTACT/OPERATOR)
, ALTEC INDUSTRIES INC (CONTACT/OPERATOR)
, ALTEC INDUSTRIES, INC. (CONTACT/OWNER)
Housing units lacking complete plumbing facilities: 1.7% Housing units lacking complete kitchen facilities: 2.5%
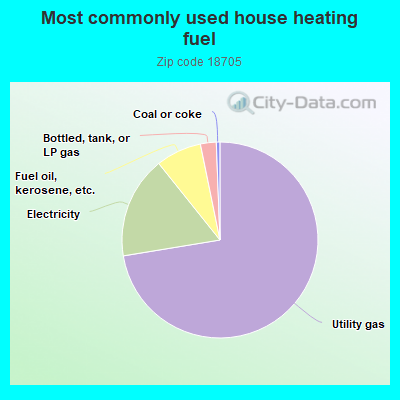
72.2%Utility gas
16.8%Electricity
7.5%Fuel oil, kerosene, etc.
2.6%Bottled, tank, or LP gas
0.6%Coal or coke
Population in 1990: 17,504.
Place of birth for U.S.-born residents:
This state: 10,822
Northeast: 1,607
Midwest: 103
South: 536
West: 225
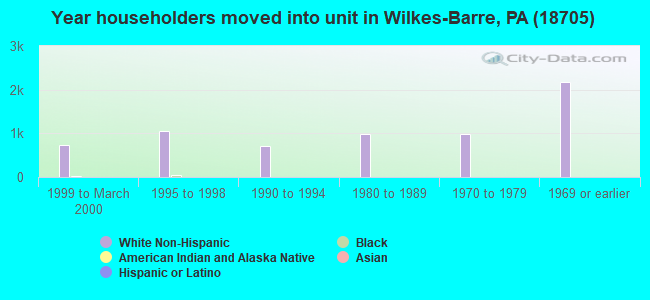
75% of the 18705 zip code residents lived in the same house 5 years ago. Out of people who lived in different houses, 85% lived in this county. Out of people who lived in different counties, 50% lived in Pennsylvania.
87% of the 18705 zip code residents lived in the same house 1 year ago. Out of people who lived in different houses, 61% moved from this county. Out of people who lived in different houses, 1% moved from different county within same state. Out of people who lived in different houses, 33% moved from different state. Out of people who lived in different houses, 5% moved from abroad.
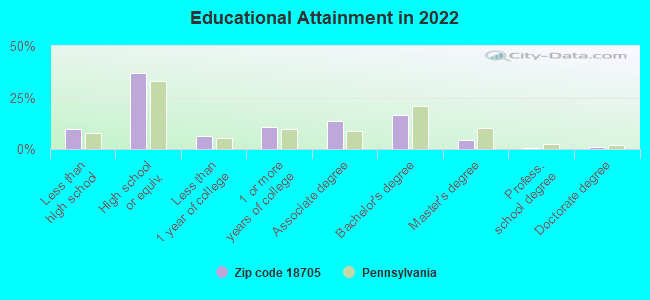
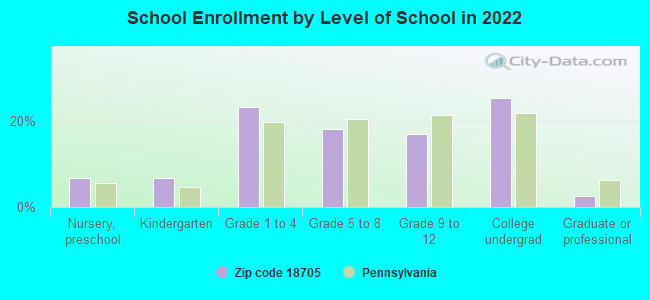
Private vs. public school enrollment:
Students in private schools in grades 1 to 8 (elementary and middle school): 121
Here:
9.3%
Pennsylvania:
15.7%
Students in private schools in grades 9 to 12 (high school): 23
Here:
4.4%
Pennsylvania:
13.4%
Students in private undergraduate colleges: 274
Here:
34.3%
Pennsylvania:
39.8%
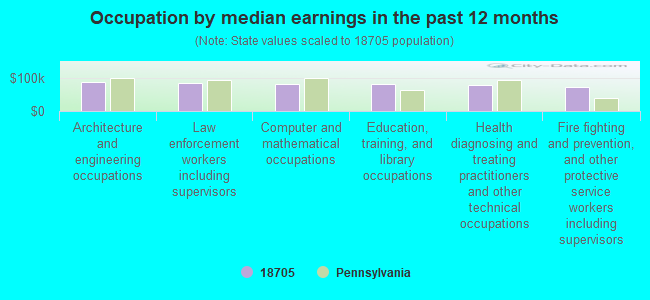
Occupation by median earnings in the past 12 months ($)
86,543Architecture and engineering occupations
84,053Law enforcement workers including supervisors
82,073Computer and mathematical occupations
80,741Education, training, and library occupations
78,997Health diagnosing and treating practitioners and other technical occupations
71,898Fire fighting and prevention, and other protective service workers including supervisors
Companies with federal contracts located in this zip code:
AG ALBERT ED ALBERT GJ ALBERT (610 N PENNSYLVANIA AVE in WILKES BARRE, PA; small business) : $324,487 in 57 contractsfrom 2000 to 2006
Contracts for Plate, Sheet, Strip, and Foil; Nonferrous Base Metal, Pipe, Tube and Rigid Tubing, Miscellaneous Items, Bars and Rods, Nonferrous Base Metal, and moreby Army Signed by year:2000: $27,834; 2001: $0; 2002: $6,075; 2003: $62,155; 2004: $72,060; 2005: $119,337; 2006: $37,026.
Biggest contracts:
$27,834 with Army for Plate, Sheet, Strip, and Foil; Nonferrous Base Metal. Signed on 2000-03-30. Completion date: 2000-04-11.
$22,513, same as above.Signed on 2006-01-19. Completion date: 2006-02-03.
$22,424, same as above.Signed on 2005-09-16. Completion date: 2005-10-11.
$15,418, same as above.Signed on 2003-06-13. Completion date: 2003-07-07.
SINCAVAGE LUMBER COMPANY (60 MAFFETT ST in PLAINS, PA; small business) : $151,352 in 11 contractsfrom 2003 to 2006
Contracts for Plywood and Veneer, Airframe Structural Components, Lumber and Related Basic Wood Materials, Hardware, Commercial, and moreby Army Signed by year:2000: $0; 2001: $0; 2002: $0; 2003: $3,745; 2004: $13,564; 2005: $66,867; 2006: $67,176.
Biggest contracts:
$57,801 with Army for Plywood and Veneer. Signed on 2006-03-09. Completion date: 2006-03-24.
$35,282, same as above.Signed on 2005-09-15. Completion date: 2005-10-07.
$19,119 with Army for Airframe Structural Components. Signed on 2005-12-27. Completion date: 2006-01-27.
$9,375 with Army for Lumber and Related Basic Wood Materials. Signed on 2006-01-23. Completion date: 2006-02-03.
K-PAT KARPET, INC (105 GEORGE AVENUE in PARSONS, PA; small business) : $36,506 in 6 contractsfrom 2001 to 2005
Contracts for Landscaping/Groundskeeping Services by Navy Signed by year:2000: $0; 2001: $7,896; 2002: $8,957; 2003: $9,365; 2004: $0; 2005: $10,288; 2006: $0.
Biggest contracts:
$10,288 with Navy for Landscaping/Groundskeeping Services. Signed on 2005-04-25. Completion date: 2005-10-31.
$9,365, same as above.Signed on 2003-03-31. Completion date: 2001-03-30.
$8,957, same as above.Signed on 2002-02-06. Completion date: 2001-03-30.
$8,576, same as above.Signed on 2001-03-20. Completion date: 2001-03-30.
UNIFILT CORPORATION (89 MILLER ST 153 in WILKES BARRE, PA; small business)
$15,150 with Army for Water Purification Equipment. Taking place in DC. Signed on 2006-01-24. Completion date: 2006-03-01.
FRANCHELLI ENTERPRISES (P.O. BOX 1668 in PLAINS, PA; small business) 9 employees, $1700000 revenue
$3,995 with Bureau of Prisoners/Federal Prison System for Construction of Structures and Facilities -- Penal Facilities. Signed on 2005-06-02. Completion date: 2005-06-30.
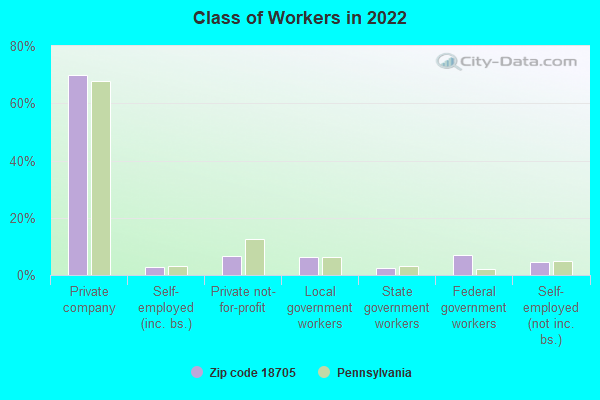
Top industries in this zip code by the number of employees in 2005:
Administrative and Support and Waste Management and Remediation Services: Travel Agencies (250-499 employees: 1 establishment)
Management of Companies and Enterprises: Corporate, Subsidiary, and Regional Managing Offices (100-249: 1, 50-99: 1)
2011 - 2018 National Fire Incident Reporting System (NFIRS) incidents
According to the data from the years 2011 - 2018 the average number of fire incidents per year is 42. The highest number of reported fire incidents - 73 took place in 2014, and the least - 20 in 2015. The data has a decreasing trend.
When looking into fire subcategories, the most incidents belonged to: Outside Fires (37.0%), and Mobile Property/Vehicle Fires (27.1%).
Fire incident types reported to NFIRS in Zip Code 18705

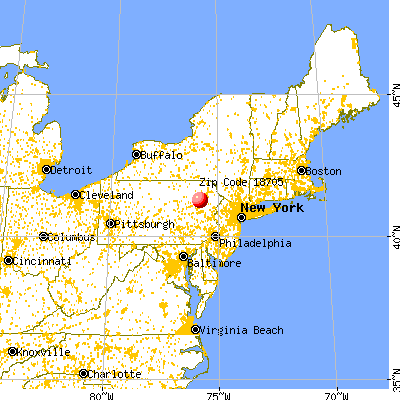


 Nearest zip codes: 18701, 18709, 18644, 18704, 18702, 18643.
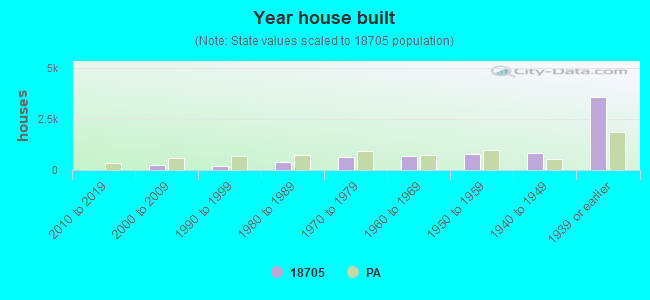


 According to the data from the years 2011 - 2018 the average number of fire incidents per year is 42. The highest number of reported fire incidents - 73 took place in 2014, and the least - 20 in 2015. The data has a decreasing trend.
 When looking into fire subcategories, the most incidents belonged to: Outside Fires (37.0%), and Mobile Property/Vehicle Fires (27.1%).